Maria Saraiva Mendes Assunção
Licenciada em Biologia Celular e Molecular
mRNA genotyping by gold nanoprobes
Dissertação para obtenção do Grau de Mestre em
Biotecnologia
Orientador: Prof. Doutor Pedro Viana Baptista, Professor auxiliar, FCT/UNL
Co-orientador: Doutor Gonçalo Doria, Investigador, FCT/UNL
Júri:
Presidente: Prof. Doutora Cecília Roque
Arguente: Prof. Doutora Alexandra R. Fernandes Vogal(ais): Prof. Doutor Pedro Viana Baptista
mRNA genotyping by gold nanoprobes
Copyright Maria Saraiva Mendes Assunção, FCT/UNL, UNL
A Faculdade de Ciências e Tecnologia e a Universidade Nova de Lisboa têm o direito, perpétuo e sem
limites geográficos, de arquivar e publicar esta dissertação através de exemplares impressos
reproduzidos em papel ou de forma digital, ou por qualquer outro meio conhecido ou que venha a ser
inventado, e de a divulgar através de repositórios científicos e de admitir a sua cópia e distribuição com
objectivos educacionais ou de investigação, não comerciais, desde que seja dado crédito ao autor e
RESUMO
A bionanotecnologia tem surgido como uma área com grande potencial para o diagnóstico molecular. Nomeadamente, a utilização de nanopartículas de ouro tem permitido o desenvolvimento de métodos de diagnóstico molecular mais sensíveis e com maior especificidade, a uma fracção do custo inerente aos testes convencionais.
No presente trabalho investigou-se a capacidade das nanossondas de ouro detectarem alvos com diferenças de uma só base em moléculas de RNA recorrendo ao método colorimétrico de non-cross-linking. Como proof-of-concept foram desenhadas, sintetizadas e caracterizadas nanossondas de ouro para a detecção de três SNPs (c.2732C>T, c.3232A>G e o c.3238G>A) presentes no gene BRCA1, um gene associado ao cancro da mama hereditário. Com o intuito de obter materiais de referência susceptíveis de utilização para calibração do método, fragmentos genómicos amplificados a partir de amostras biológicas contendo as sequências de interesse foram clonados em vector apropriado para posterior transcrição in vitro/in vivo.
Inicialmente, averiguou-se a capacidade das nanossondas detectarem oligonucletídeos sintéticos complementares, seguindo-se condições de maior complexidade através de spiking em RNA total de Saccharomyces cerevisiae. Por último, foram utilizados produtos de transcrição in vitro/in vivo. Foi possível detectar especificamente o alvo complementar em 0.12pmol/μL numa proporção de 0.25% de alvo complementar/RNA total. Foi também possível discriminar ambos os alelos do SNP c.3232A>G directamente em RNA utilizando apenas 0.08pmol/μL de transcrito sintetizado in vitro. No caso das amostras de transcritos in vivo, os resultados foram inconclusivos.
ABSTRACT
Bionanotechnology has emerged as a field with great potential for molecular diagnose. Namely, the use of gold nanoparticles has allowed the development of molecular diagnostic methods with greater sensitivity and specificity at a fraction of the cost inherent to conventional techniques.
The present work assessed the ability of gold nanoprobes to detect targets with single base differences in RNA molecules following the colorimetric non-cross-linking method. As proof-of-concept, gold nanoprobes were designed, synthesized and characterized to detect three different SNPs (c.2731C>T, c.3232A>G and c.3238G>A) in the BRCA1 gene, a gene associated with inherited breast cancer.
Reference materials, susceptible to be used for the calibration of the method, were created by cloning genomic fragments amplified from biological samples containing the sequences of interest in an appropriate vector for subsequent in vitro/in vivo transcription.
Initially, the ability of target recognition by the gold nanoprobes was assessed using synthetic oligonucleotides targets alone and spiked-in total RNA of Saccharomyces cerevisiae, and later using transcripts synthetized in vitro/in vivo. This study revealed the capacity of target detection up to 0.25% of complementary target/total RNA, for a final concentration of complementary target of 0.12pmol/μL. It was also possible to detect and discriminate both c.3232A>G SNP
alleles using only 0.08pmol/μL of in vitro transcript. For the in vivo transcript samples the results
were inconclusive.
INDEX
RESUMO... I
ABSTRACT... III
INDEX... V
FIGURE INDEX... IX
TABLE INDEX... XI
LIST OF ABBERVIATION... XIII
1. INTRODUCTION... 1
1.1 From genome to transcriptome... 1
1.2 Nanodiagnostics... 6
1.2.1 Gold Nanoparticles (AuNPs)... 6
1.2.2 Methods based in Au-nanoprobes... 7
1.2.3 Non-cross-linking method (our method)... 8
1.3 Proof-of-concept: BRCA1 targets... 9
1.4 Objectives... 11
2. MATERIALS AND METHODS... 13
2.1 Materials... 13
2.1.1 Equipment and specialized material... 13
2.1.2 Chemical Reagents... 13
2.1.3 Solutions... 14
2.1.4 Biological Material... 16
2.1.4.2 Oligonucleotides... 16
2.1.4.3 Human genomic DNA samples... 18
2.2 Methods... 18
2.2.1 Target Sequence Preparation... 18
2.2.1.1 Preparation of competent E. coli cells... 18
2.2.1.2 PCR amplification... 18
2.2.1.3 Cloning... 19
2.2.1.3.1 Ligation... 19
2.2.1.3.2 Transformation of E. coliDH5α...... 19
2.2.1.3.3 Transformation of E. coli BL21 (DE3) pLysE... 20
2.2.1.4 Plasmid extraction and purification... 20
2.2.1.5 Purification of template for in vitro transcription... 21
2.2.1.6 In vitro Transcription... 21
2.2.1.6.1 In vitro transcript purification... 21
2.2.1.6.2 Target quantification... 23
2.2.1.7 Total RNA Extraction from S. cerevisiae...... 23
2.2.1.8 IPTG induction of E. coli BL21 and total RNA extraction... 23
2.2.2 Nanoprobes Preparation... 24
2.2.2.1 AuNPs synthesis... 24
2.2.2.2 TEM analysis... 24
2.2.2.3 Nanoprobe synthesis... 25
2.2.2.5 Non-cross-linking hybridization assay... 26
2.2.2.6 Determination of Au-nanoprobes’ density by fluorescent assays... 27
3. RESULTS AND DISCUSSION... 29
3.1. Biological Sample preparation... 29
3.1.1 In vitro transcription... 29
3.2. Synthesis and Characterization of Au-nanoprobes... 31
3.3 in vitro RNA transcript detection... 41
3.4.in vivo RNA transcript detection... 44
4. CONCLUSIONS AND FUTURE PERSPECTIVES... 47
REFERENCES... 49
APPENDICES... 57
Appendix A - Products of PCR amplification... 57
Appendix B - pJET1.2/blunt vector map... 58
Appendix C - Sequences of the plasmids... 59
Appendix D - Isolation of in vitro RNA transcripts by agarose gel purification.... 65
FIGURE INDEX
Figure 3.1 - In vitro transcription... 30
Figure 3.2 - AuNPs characterization... 32
Figure 3.3 - Complementarity between probes and targets... 33
Figure 3.4 - AuNPs vs Au-nanoprobes stability... 34
Figure 3.5 - Au-nanoprobe stability to increasing salt concentration... 35
Figure 3.6 - %Dispersion of Au-nanoprobes with ssDNA upon salt addition... 38
Figure 3.7 - Non-cross-linking target quantification... 39
Figure 3.8 - RNA spike-in assay... 40
Figure 3.9 - Non-cross-linking assay with unpurified in vitro transcripts... 41
Figure 3.10 - Effect of transcript purification on the non-cross-linking method... 42
Figure 3.11 - SNP detection assay with in vitro transcripts... 43
Figure A.1 - pJET1.2/blunt vector map... 55
Figure A.2 - Agarose gel electrophoresis of transcripts after purification by freeze and squeeze method... 65
TABLE INDEX
Table 1.1 - Technologies for gene expression genotyping... 5
Table 1.2 - Allele frequencies of the most frequent BRCA1 SNPs... 10
Table 2.1 - Chemical reagents... 13
Table 2.2 - Primers... 17
Table 2.3 - Synthetic ssDNA targets... 17
Table 2.4 - Thiol-modified ssDNA probes... 17
Table 2.5 - Biological samples genotype... 18
Table 2.6 - Stability assays... 26
Table 3.1 - Au-nanoprobes and their fully complementary targets... 33
Table 3.2 - Characterization of Au-nanoprobes... 35
Table 3.3 - Non-cross-linking assay using synthetic ssDNA targets... 37
LIST OF ABBREVIATIONS
Abs - Absorbance
ARMS - Amplification Refractory Mutation System AuNPs - Gold nanoparticles
Au-nanoprobes - Thiol-ssDNA modified gold nanoparticles
AuAg alloy nanoprobes - Thiol-ssDNA modified gold-silver nanoparticles b - bases
bp - base pairs
CAGE - Cap Analysis of Gene expression CCC - Critical Coagulation Concentration DEPC - Diethyl pyrocarbonate
DMSO - Methyl Sulphoxide DNA - Deoxyribonucleic acid
cDNA - Complementary Deoxyribonucleic acid ssDNA - Single stranded Deoxyribonucleic acid DTT - Dithiothreitol
ELOSA - Enzyme Linked Oligo Sorbant Assay FISH - Fluorescent in situ Hybridization GWAS - Genome wide association studies
IPO-FG - Instituto Português de Oncologia-Francisco Gentil IPTG - isopropyl-beta-D-thiogalactopyranoside
LAMP - Loop Mediated Amplification LB medium - Luria-Bertani medium NPs - Nanoparticles
NTPs - Nucleosides triphosphate dNTPs - deoxynucleotides triphosphate OD - Optical Density
o/n - Over night
PMAGE - Poly Multiplex Analysis of Gene Expression eQTL - Expression Quantitative Trait Loci
RCA - Rolling Circle Amplification
RFLP - Restriction Fragment Length Polymorphism RNA - Ribonucleic acid
mRNA - Messenger Ribonucleic acid miRNA- Micro Ribonucleic acid rRNA - Ribosomal Ribonucleic acid tRNA- Transfer Ribonucleic acid rpm - revolutions per minute
RT-PCR - Reverse Transcription Polymerase Chain Reaction
qRT-PCR - Real time Reverse Transcription Polymerase Chain Reaction SAGE - Serial Analysis of Gene Expression
SDS - Sodium Dodecyl Sulphate
SMART - Signal Mediated Amplification of Ribonucleic acid Technology SNP - Single nucleotide polymorphism
SOB medium - Super Optimal Broth medium
SOC medium - Super Optimal broth with Catabolite repression
medium
SPR - Surface plasmon resonanceTEM - Transmission Electron Microscopy TAE - Tris-acetate-EDTA
TBE - Tris-borate-EDTA
VNTR - Variable number of tandem repeats
1. INTRODUCTION
1.1 From genome to transcriptome
The revealing of the human genome sequence in 2001 has given rise to a new post-genomic era with unprecedented benefits for the future of medicine and biotechnology[1]. Biomedical research has since focused on understanding the relationship between genetic factors, the environment and human traits. The big goal is to achieve a more efficient prediction, prevention, diagnosis and treatment of a disease, i.e. to reach a personalized medicine[2,3,4,5].
Genetic variability can be presented in many forms, including variable number of tandem repeats (VNTR), presence and absence of transposable elements, deletions, duplications, inversions and single nucleotide polymorphisms (SNPs)[6]. The latter is the most common one, being the cause of 90% of all variations in the human genome[7]. SNPs are single nucleotide variations within the genome that are present at least in 1% of a certain population[8], and provide a powerful resource as disease biomarkers in genome wide association studies (GWAS)[9].
Genetic variation can influence gene expression, both qualitative and quantitative, thus making it essential to characterize the transcriptome towards understanding the development of diseases. The transcriptome is the complete set of transcripts (e.g. mRNA, rRNA, tRNA, miRNA and many others) and their expression level within a cell, in specific physiological conditions [10]. SNP correlation in the transcriptome can be considered a quantitative trait. These correlation studies allow identification of genomic loci that regulate expression levels of mRNAs or proteins, known as expression Quantitative Trait Loci (eQTL)[11].
Target amplification is also possible through isothermal amplification methods[21], which enables DNA/RNA amplification without the thermocycling apparatus needed for PCR. Examples of these techniques are rolling circle amplification (RCA)[22], loop mediated amplification (LAMP)[23]
and signal mediated amplification of RNA technology (SMART)[24]. These methods achieve
amplification at a constant temperature using DNA polymerases with strong displacement activity such as Pfu, Bst and Aac polymerases. RCA involves only one primer, which can be also the template. The hybridization of the primer to a circularized DNA (probe) enables numerous rounds of isothermal enzymatic synthesis by continuously progressing around the circular DNA[22]. The LAMP technique in contrast to RCA, requires a set of four (to six) specific
designed primers. The amplification is also assured by a polymerase with displacement activity
only in the presence of the complementary target. This method has been applied to the characterization of RNA molecules by adding a first step of reverse transcription. Through this approach, Curtis et al.[26] managed to detect specific RNA sequences from HIV-1-infected individuals using blood directly from patients. More recently, using the same method, Li et al.[27] achieved real time detection and quantification of microRNAs in total RNA. Another isothermal amplification method is the SMART technique, which also enables detection of DNA or RNA targets by amplification of the signal of detection. It depends on two probes (extension and template), each having a complementary region to the target at adjacent positions to one another. When the probes encounter complementary target hybridization occurs and the DNA polymerase extends the extension probe by copying the template probe. This template probe possesses a T7 RNA polymerase promoter sequence. Only the double stranded sequence enables the activity of the T7 RNA polymerase, thus generating RNA copies. This technique has been used to detected gene expression by Wharam and co-workers[24], where they accomplished the detection of the SMART amplified signal through an Enzyme Linked Oligosorbent Assay (ELOSA).
Enzymatic cleavage is another genotyping approach based on the ability of certain enzymes, i.e. restriction enzymes, to cleave DNA by recognition of specific sequences. Restriction fragments length polymorphism (RFLP), can be used to characterize DNA/RNA once different sequences will have different patterns of cleavage by the specific restriction enzymes. The products can then be analyzed by gel electrophoresis[48]. This technique has the disadvantage of being dependent on the restriction enzymes available and thus to the restriction sequences. Another drawback is the impossibility to use RNA directly in RFLP analysis, since there are no known restriction enzymes for RNA cleavage[49]. Thus, genotyping RNA molecules by RFLP require a first step of RT-PCR to provide cDNA for enzyme recognition[28].
Ribonuclease Protection assay. In this assay a high specific radiolabeled single stranded cRNA is synthesized and hybridized in excess to the target mRNA. Then a combination of RNaseA and RNaseT1 is used to digest the free mRNA and the digestion product is analyzed by polyacrylamide gel/microchip electrophoresis and autoradiography/phosphorImaging to reveal which mRNA was effectively protected from RNase digestion due to the formation of a duplex between the target mRNA and the cRNA probe[31, 32, 33].
Hybridization approaches are based on the capacity of hybridization between two complementary single stranded sequences and in the differences in stability of the formed double-strand. Examples of hybridization techniques for RNA analysis are Northern blot[34,35], fluorescent in situ hybridization (FISH) assays[36, 37,38] and Microarrays[39, 40]. Northern blot and FISH technologies are the only ones to directly detect RNA, by hybridization with labeled probes. FISH enables also the detection and localization of specific mRNA sequences in vivo. Microarray analysis is also based on hybridization specifically between the microarray probes and target sequences which are typically fluorescently labeled. The use of these platforms to quantify gene expression is achieved indirectly through hybridization between fluorescent labeled cDNA synthesized by RT-PCR and the microarray probes. However, the use of retro transcription for quantification of the RNA molecule does not allow the detection of subtle changes in gene expression. This is a big weakness once the levels of gene expression are very important to understand the biological process[45]. These techniques along with other hybridization techniques have some drawbacks typical of an hybridization method, such as the need for previous knowledge about the target DNA/RNA; high background noise due to cross hybridization; saturation of the signal; and, above all, limitations upon the hybridization efficiency that depends on the sequence[40].
Despite all the genotyping technologies available, sequencing is still the gold standard for genotyping, offering the highest degree of specificity and selectivity. During the last ten years a lot of improvements have been made in sequencing technologies. The main sequencing method is the Sanger method, based on electrophoresis of fluorescently labeled sequencing reaction products[50]. In the past 5 years plenty of new sequencing platforms have been
developed, the so called ―massively parallel‖ sequencing or high-throughput second generation
sequencing increasing the data output, e.g. pyrosequencing[12].
usually NIaIII. The linkers containing a restriction site sequence of a specific restriction enzyme that can cleave the cDNA in short tags are then joined to the cDNA. These tags are joined to form a chain, and undergo amplification by PCR, prior to sequencing. In the end it is possible to identity and characterize the absolute abundance of the analyzed transcripts. Moreover, the tags can be cloned, providing a library of that specific set of transcripts[44].
The most modern RNA sequencing technique is the so called RNA-seq, based on the new generation high-throughput sequencing platforms that were initially developed for the analysis of DNA[46]. Briefly, a population of RNA is converted to cDNA fragments with adapters attached to both ends. Each molecule with or without amplification is then submitted to high-throughput sequencing. This sequencing technique provides very important information about the transcriptome once it enables not only the detection but also the measurement of expression, by means of the absolute abundance of coding and non-coding transcripts. Other advantage of this high-throughput sequence method is the reduction of the required amount of RNA sample[45]. In fact, sequencing platforms are very important so as to identify previously uncharacterized genes and genes expression profiles of normal and pathological disease tissues[44,46].
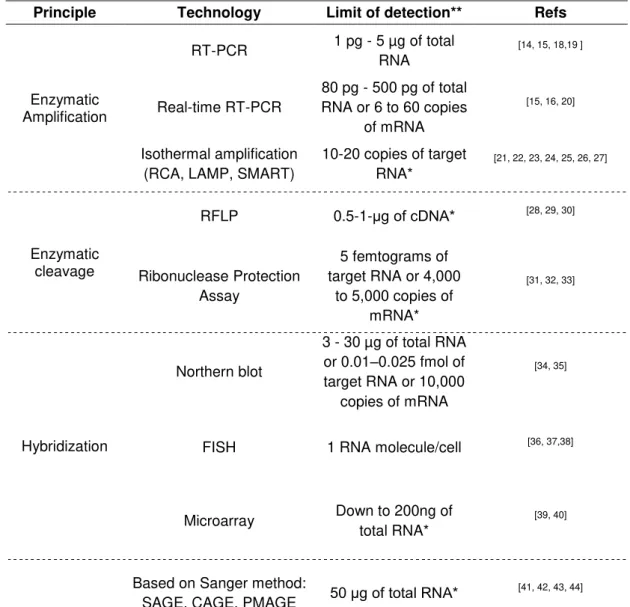
Table 1.1 - Technologies for gene expression genotyping. The principle and their limit of detection are underlined.
Principle Technology Limit of detection** Refs
Enzymatic Amplification
RT-PCR 1 pg - 5 µg of total RNA
[14, 15, 18,19]
Real-time RT-PCR
80 pg - 500 pg of total RNA or 6 to 60 copies
of mRNA
[15, 16, 20]
Isothermal amplification (RCA, LAMP, SMART)
10-20 copies of target RNA*
[21, 22, 23, 24, 25, 26, 27]
Enzymatic cleavage
RFLP 0.5-1-μg of cDNA* [28, 29, 30]
Ribonuclease Protection Assay
5 femtograms of target RNA or 4,000
to 5,000 copies of mRNA*
[31, 32, 33]
Hybridization
Northern blot
3 - 30 µg of total RNA or 0.01–0.025 fmol of target RNA or 10,000
copies of mRNA
[34, 35]
FISH 1 RNA molecule/cell [36, 37,38]
Microarray Down to 200ng of total RNA*
[39, 40]
Sequencing
Based on Sanger method:
SAGE, CAGE, PMAGE 50 μg of total RNA*
[41, 42, 43, 44]
High-throughput
sequencing: RNA-seq
500 pg of total RNA* [45, 46, 47]
* requires a step of retro-transcription and amplification to cDNA prior to detection ** Limit of detection may vary according to the target mRNA expression in total RNA
1.2 Nanodiagnostics
Nanodiagnostics can be defined as the use and control of nanomaterials combined with biomolecules for molecular diagnostics[53]. In general, the great advantage of working at the nanoscale is that biomolecules and nanostructures are at the same nanometer scale requiring less amount of sample while increasing sensitivity[54,55]. In particular, nanoparticles (NPs) have revealed to be very promising nanostructures for molecular diagnostics due to their unique physicochemical properties such as high surface to volume ratio; enhanced photoemission; high electrical and heat conductivity; and improved surface catalytic activity. These properties may vary depending on their size (e.g. 1-100nm) and composition which are usually inorganic materials[56], such as noble metals (e.g Au, Ag, Pt)[57], magnetic metals (e.g. Fe304, Co)
[58,59] , semi conductors (e.g. CdSe, CdS)[60,61] or a combinations of the previously mentioned[62,63]. Among these, noble metal NPs are the most promising for the development of diagnostic techniques due to their accessible synthesis and derivatization, and unique size and shape-dependent optical properties[64,65].
For noble metal NPs smaller than the wavelength of the incident light, the interaction between
the electromagnetic waves of light and the electrons across the NP’s surface induces
oscillations of these electrons, giving rise to a phenomenon known as Surface Plasmon Resonance (SPR). This SPR is responsible for the enhancement of scattering and absorption of electromagnetic radiation across the noble metal NPs[66], providing intense colors in the visible spectrum to the colloidal solutions. These optical properties are dependent on the composition, size, morphology, dielectric properties of the surrounding medium and inter particle distances[67,68]. Some of these properties have been explored in the development of new and faster molecular diagnostic techniques, with increased sensitivity and simplicity at lower costs.
1.2.1 Gold Nanoparticles (AuNPs)
Gold nanoparticles (AuNPs) are the most widely reported and promising noble metal NPs for biomedical applications, not only for their well-known syntheses methods, but also for their capacity of bioconjugation[64]. The most common method for AuNPs syntheses is the
Turkevich’s method, which is based on the reduction of chlorauric acid with sodium citrate[69,70].
The citrate ions act both as reducing and capping agent, enabling a stable and modestly monodisperse colloid aqueous solution of AuNPs that can be easily derivatized with biomolecules usually through a thiol or amine moiety.
particle distance and a concomitant lower resonance frequency, promoting a shift of the SPR absorption peak to longer wavelengths. As a consequence, the colloidal solution changes color from red to blue, a phenomenon that has been explored in the development of colorimetric molecular diagnostic methods[71].
AuNPs have been reported to be successfully bioconjugated with many different biofunctional groups such as antibodies[72,73], carbohydrates[74], peptides[75] and oligonucleotides[76,77,78] towards a specific biomolecular recognition. The derivatization of AuNPs with thiol-modified oligonucleotides (i.e. Au-nanoprobes) has emerged as a promising next generation biomarker technology[54, 65, 79].
Taking advantage of the amazing AuNPs properties, several molecular detection methods with great potential for point-of-care diagnostic have been developed for the specific and sensitive detection of nucleic acids sequences.
The capacity of single stranded nucleic acids (ssDNA) to non-specifically adsorb to the AuNP’s surface and increase the stabilization upon salt-induced aggregation has been explored by Li and co-workers[80]. In this colorimetric assay detection is based on non-functionalized AuNPs. The identification of specific sequences within a PCR amplicon is achieved by hybridization with ssDNA probes that would otherwise adsorb to the AuNPs surface and stabilize them. The hybridization of ssDNA probes with the amplicon inhibits their adsorptions to the AuNPs and, consequently, they aggregate upon an increasing ionic strength and the solution changes color from red to blue. If the amplicon has no complementarity to the ssDNA probes, they will remain adsorbed to the AuNPs providing an increased stability to the increasing ionic strength and, thus, the colloidal solution does not aggregate and remains red. This method has been successfully used for the characterization of single nucleotide variations in DNA. Nonetheless, this simple method has some drawbacks, mainly the limited control over the adsorption/desorption of the single stranded oligonucleotides which can give rise to false negatives/positive results[80].
1.2.2 Methods based in Au-nanoprobes
Functionalized AuNPs have been used in a variety of formats towards the development of molecular diagnostics protocols.
The colorimetric detection of DNA based on Au-nanoprobes was firstly reported by Mirkin and co-workers in 1996[76]. This approach is known as cross-linking method because it uses two different Au-nanoprobes with complementary sequences to adjacent regions within the target. This way when hybridization of both Au-nanoprobes with the target occurs due to their complementarity, a cross-linked network between AuNPs is formed and the inter particle distance decreases, which leads to a colorimetric change from red to blue. The detection of a single-base mismatch in DNA targets can be successfully reached using this system with appropriate temperature control[70].
Mirkin et al. used Au-nanoprobes labeled with Raman-active dyes and oligonucleotides to accomplish multiplexed multicolor detection of DNA and RNA targets reaching a limit of detection of 20fM with a single base resolution[83]. Another example was provided by Glynou et al.[84], where the detection of 500 copies of prostate-specific antigen through the hybridization with Au-nanoprobes in a chromatographic stripe (dipstick) can be achieved by naked eye. In this method, similarly to current pregnancy tests, biotinylated RT-PCR products are hybridized to a specific oligo(dA)-tailed probe and loaded on the chromatographic stripe. As the buffer migrates through the stripe, the biotinylated RT-PCR products are immobilized by streptavidin spotted in a specific location of the stripe. Finally, to detect the presence of the DNA target in the streptavidin spot, poly-dT Au-nanoprobes are used to hybridize to the poly-dA probe. A mRNA expression array was also recently demonstrated by Huber and co-workers[85] by using a surface-immobilized probe to capture the complementary transcripts from total human RNA samples. After hybridization, poly- T(20) Au-nanoprobes hybridized to the -polyA tails of the captured targets. Through this method the authors were able to detect specific transcripts from 0.5µg of human total RNA without enzymatic amplification.
1.2.3 Non-cross-linking method (our method)
A non-cross-linking method for detection of gene expression without the need for retro-transcription was developed by Baptista and co-workers[78]. This approach relies on the differential stability of the Au-nanoprobes in the presence/absence of a complementary target upon increasing ionic strength of the solution. The presence of fully complementary target and its hybridization to the Au-nanoprobe prevents aggregation upon salt addition and the solution remains red. In contrast, the presence of a non-complementary target or a target harboring a single point mismatch cannot prevent the Au-nanoprobe aggregation upon increasing the ionic strength, and the solution changes color from red to blue.
between Au-nanoprobes associated with the negatively charged backbone of the hybridized nucleic acid targets[78,86,87,88]. Recently, steric hindrance has also been thought to be associated to the stabilization in this non-cross-linking method, in which the hybridization to a complementary target provides a greater steric hindrance to the Au-nanoprobe and contributes to prevent inter-particle aggregation[89]. The method has been successfully applied to detected
gene expression in 0.3 μg of total RNA without reverse transcription or PCR amplification[78],
and Mycobacterium Tuberculosis DNA in clinical samples after PCR amplification[86] with a limit of detection of 0.75 μg of total DNA. The method is also able to discriminate single nucleotide polymorphisms in PCR products of relevant biological samples with a sensitivity of 75
fmol/μL[90,91]
. More recently, it has been reported the detection and quantification of the BCR-ABL fusion transcript, which is responsible for chronic myeloid leukemia[92]. This detection was reached with discrimination of 50% of complementarity between the target and the Au-nanoprobe, with a limit of detection of 10 ng/μl[92]. This method has also been described to have the ability to differentially detect two distinct target sequences in a multiplex colorimetric assay by using Au-nanoprobes combined with AuAg-alloy nanoprobes, taking advantage of different SPR absorbance peaks[93]. The colorimetric changes that occur in the non-cross-linking method can be assessed directly by the naked eye or quantified through UV-visible spectroscopy [78] or through the use of a light sensitive amorphous/nanocrystalline silicon pi’ii’’n photovoltaic sensor developed by the same authors[94]. The colorimetric changes can be quantified through a ratio between the SPR peak of the dispersed solution, around 525nm, and the aggregated SPR peak that shifts to longer wavelengths, usually 15 minutes after salt addition[78,90].
Once the non-cross linking method developed by Baptista and co-workers[78 have proved to have a single base resolution on DNA at room temperature and to have been successfully applied on the direct detection and quantification on mRNA, the work presented in this thesis aim to verify the possibility of the direct detection of single base differences directly on mRNA.
1.3 Proof-of-concept: BRCA1 targets
gene. Nonetheless, the strong linkage disequilibrium region within this gene enables haplotype based studies. The most frequent SNPs found in BRCA1 gene are used to characterize these haplotypes[98].
In this work, attention was focused on three of the most frequent SNPs present in BRCA1 gene, namely, c.2731C>T (dbSNP rs#: rs799917), c.3232A>G (dbSNP rs#: rs16941) and c.3238G>A (dbSNP rs#: rs4986852) – see also Table 1.2.
Table 1.2- Allele frequencies of the most frequent BRCA1 SNPs
SNP frequency according to HAPMAP-CEU
Wild-type Heterozygous Homozygous
c.2731C>T 0.434 0.46 0.106
c.3232A>G 0.442 0.451 0.106
c.3238G>A 0.912 0.088 0
All these variations are missense polymorphisms located within exon 11 of BRCA1. Nonetheless, their impact on risk of breast and ovarian cancer is not clear. Studies indicate that SNP c.3238G>A may play a role in disease predisposition[99]. The other two SNPs are generally found to be non-pathological[100,101], although some associations with breast cancer have been found[102].
1.4 Objectives
This work aimed at assessing the possibility of using DNA functionalized AuNPs (i.e. Au-nanoprobes) to detect single nucleotide differences directly in RNA targets via the non-cross-linking method. As proof-of-concept, the three of the most frequent SNPs found in BRCA1 gene were used as targets.
To achieve this objective, several intermediate objectives were set forward to fulfill the ultimate goal:
- amplicons from patient samples harboring the SNPs of interest were cloned into an expression vector so as to provide plenty of biological material for subsequent tests, to be used as templates for in vitro/in vivo transcription reactions and to transform suitable bacterial hosts to create an expression model
- optimization of in vitro and in vivo expression of the SNP transcripts so as to produce the RNA targets required for method validation and calibration
- synthesis and characterization of AuNPs suitable for functionalization with thiol-modified oligonucleotides
- Au-nanoprobes for the detection of each SNP in RNA were designed and synthesized - Characterization of the Au-nanoprobes in terms of stability, capacity of hybridization and
quantification of a synthetic ssDNA oligonucleotide target, alone and in spike-in mixtures of total RNA purified from suitable cells
2. MATERIALS AND METHODS
2.1 Materials
2.1.1 Equipment and specialized material
- UV-Vis Spectrophotometer UV Mini-1240 (Shimadzu, Germany),
- UV-Vis Spectrophotometer Nanodrop ND-1000 (Nanodrop Technologies, USA) - Microplate reader Infinite M200 with Absorbance module (Tecan, Switzerland)
- Thermal Cycler DNA Engine (Bio-Rad, USA), Thermal Cycler Tgradient (Biometra, Germany) - Gel Doc XR+ Molecular Imager system (Bio-Rad, USA)
- Ultrasonic bath Elmasonic S10H (Elma, Germany)
- E-Gel® iBase™ Power System with E-Gel® Safe Imager and E-Gel® EX pre-cast gel, 2% (Invitrogen, USA)
- pH meter Basic 20 with combined glass electrode 5209 (Crison, Spain) - Quartz absorption cells – 105.202-QS (Hellma, Germany)
- 384 well small volume, LoBase Polystyrene microplates, black – Cat.No.788096 (Greiner Bio-One)
- NAP-5 columns (GE Healthcare, Sweden)
- Costar® Spin-X® Centrifuge Tube Filters, 0.22 μm Pore CA Membrane Sterile (Corning, USA) - Spectra/Por 1 Dialysis Tubing, 10mm width, part no. 132645 (Spectrum Labs, USA)
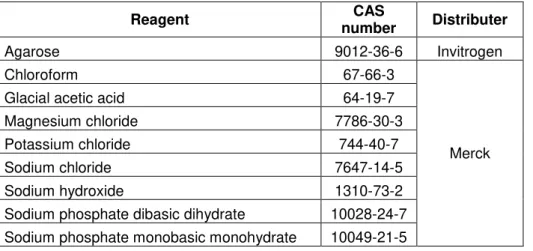
2.1.2 Chemical Reagents
Table 2.1 - Chemical reagents
Reagent number CAS Distributer
Agarose 9012-36-6 Invitrogen
Chloroform 67-66-3
Merck
Glacial acetic acid 64-19-7
Magnesium chloride 7786-30-3
Potassium chloride 744-40-7
Sodium chloride 7647-14-5
Sodium hydroxide 1310-73-2
Reagent (cont.) CAS
number Distributer
Ampicillin 69-53-4
Sigma-Aldrich
Boric acid 10043-35-3
Glycerol 56-81-5
Glucose 50-99-07
Gold(III) chloride trihydrate 16961-25-4
Manganese chloride 13446-34-9
Methyl sulfoxide (DMSO) 67-68-5
PIPES 5625-37-6
Potassium hydroxide 1310-58-3
Sodium citrate tribasic dihydrate 6132-04-3 Sodium Dodecyl Sulfate (SDS) 151-21-3 Ethylenediamine tetraacetic acid 60-00-4
Fluka Dithiothreitol (DTT) solution, 1M 3483-12-3
Phenol 108-95-2
Tris(hydroxymethyl)aminomethane 77-86-1
Diethyl Pyrocarbonate 4525-33-1
Tryptone 91079-40-2
Difco
Bacteriological agar 9002-18-0
Proteinase K 39450-01-6 Roche
Yeast extract 8013-01-2 USB
Gel red n.a Biotium
Calcium chloride 10035-04-8 AppliChem
Bacteriological agar 9002-18-0 Difco
Peptone n.a Panreac
Sodium acetate 6131-90-4
Jose M. VAz Pereira, LDA
2.1.3 Solutions
10mM (Sodium) Phosphate buffer, (pH8) 9.32 mM Na2HPO4 0.68 mM NaH2PO4
Synthesis Buffer I 2% (w/v) SDS
Synthesis Buffer II 1.5 M NaCl 0.01% (w/v) SDS
10 mM Phosphate buffer, pH 8 Sterilize by filtration and store at 4ºC
AL I
.
50 mM Glucose 25 mM Tris-HCl, pH 8 10 mM EDTA, pH 8
Sterilize by autoclaving and store at 4ºC.
AL II 200 mM NaOH
1% (w/v) SDS
Prepare fresh before use (room temperature).
AL III 3 M Sodium acetate (adjust pH to 4.8 with glacial acetic acid)
Store at 4ºC.
Luria-Bertani medium (LB medium) 1% (w/v) tryptone 0.5% (w/v) yeast extract 171 mM NaCl
Adjust to pH 7 with NaOH. Sterilize by autoclaving and store at 4ºC.
(For solid medium, add 1.4% (w/v) of Agar)
Super Optimal Broth (SOB medium) 2% (w/v) tryptone 0.5% (w/v) yeast extract 10 mM NaCl
2.5 mM KCl 10 mM MgCl2 * 10mM MgSO4*
Adjust to pH 7 with NaOH. Sterilize by autoclaving and store at 4ºC.
*Add sterile MgCl2 and MgSO4 just before use.
Super Optimal broth with Catabolite repression (SOC medium)
Same as SOB medium plus add 20 mM glucose (sterile) after autoclaving SOB medium and cooling down to 60ºC or less.
Yeast Extract Peptone Dextrose medium (YPD medium)
1% (w/v) yeast extract 2% (w/v) Peptone 2% (w/v) Glucose
Sterilize by autoclaving and store at 4ºC.
Terrific Broth medium (TB medium) 10 mM PIPES 15 mM CaCl2 250 mM KCl 55 mM MnCl2
2.1.4 Biological Material
2.1.4.1 Molecular Biology
Enzymes
DreamTaq DNA polymerase (Fermentas, Canada) T7 RNA polymerase (Fermentas, Canada)
Restriction enzyme; XhoI and AluI (New England Biolabs, USA) DNAse I, RNase-free (Fermentas, Canada)\
Lyticase (Sigma-Aldrich,USA) Lysozyme (Sigma-Aldrich,USA)
DNA size markers
GeneRuler™ DNA Ladder Mix, ready-to-use (Fermentas, Canada)
RiboRuler™ High Range RNA Ladder (Fermentas, Canada)
Kits
CloneJET™ PCR Cloning Kit (Fermentas, Canada) GeneJET™ RNA purification Kit (Fermentas, Canada) Quant-iT™ OliGreen® ssDNA Assay Kit (Invitrogen, USA)
Microorganisms
Escherichia coli DH5α
Escherichia coli BL21 (DE3) pLysE (Bioline, USA) Saccharomyces cerevisiae CBS 8803
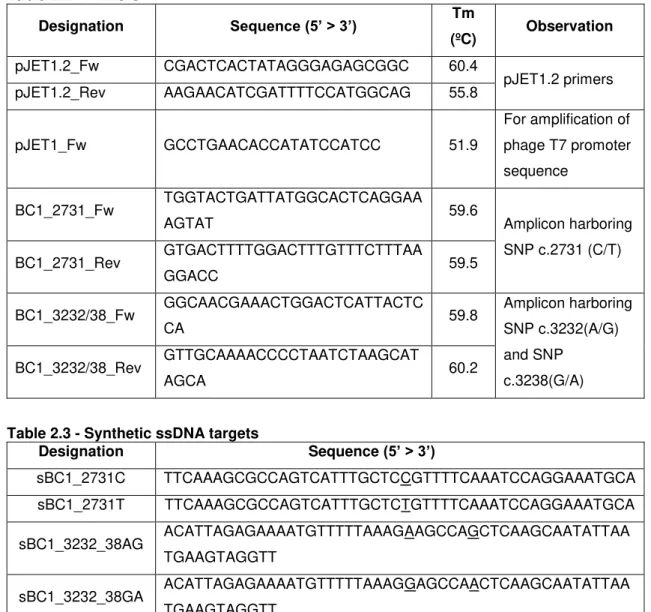
2.1.4.2 Oligonucleotides
Table 2.2 - Primers
Designation Sequence (5’ > 3’) Tm
(ºC) Observation
pJET1.2_Fw CGACTCACTATAGGGAGAGCGGC 60.4
pJET1.2 primers
pJET1.2_Rev AAGAACATCGATTTTCCATGGCAG 55.8
pJET1_Fw GCCTGAACACCATATCCATCC 51.9
For amplification of phage T7 promoter sequence
BC1_2731_Fw TGGTACTGATTATGGCACTCAGGAA
AGTAT 59.6 Amplicon harboring
SNP c.2731 (C/T)
BC1_2731_Rev GTGACTTTTGGACTTTGTTTCTTTAA
GGACC 59.5
BC1_3232/38_Fw GGCAACGAAACTGGACTCATTACTC
CA 59.8
Amplicon harboring SNP c.3232(A/G) and SNP
c.3238(G/A) BC1_3232/38_Rev GTTGCAAAACCCCTAATCTAAGCAT
AGCA 60.2
Table 2.3 - Synthetic ssDNA targets
Designation Sequence (5’ > 3’)
sBC1_2731C TTCAAAGCGCCAGTCATTTGCTCCGTTTTCAAATCCAGGAAATGCA
sBC1_2731T TTCAAAGCGCCAGTCATTTGCTCTGTTTTCAAATCCAGGAAATGCA
sBC1_3232_38AG ACATTAGAGAAAATGTTTTTAAAGAAGCCAGCTCAAGCAATATTAA TGAAGTAGGTT
sBC1_3232_38GA ACATTAGAGAAAATGTTTTTAAAGGAGCCAACTCAAGCAATATTAA TGAAGTAGGTT
Table 2.4 - Thiol-modified ssDNA probes
Designation Sequence (5’ > 3’) Modification
BC1_2731C TGCATTTCCTGGATTTGAAAACG 5’-thiol
BC1_2731T TGCATTTCCTGGATTTGAAAACA 5’-thiol
BC1_3232A TCTTTAAAAACATTTTCTCTAATGT 3’-thiol
BC1_3232G CCTTTAAAAACATTTTCTCTAATGT 3’-thiol
BC1_3238G AACCTACTTCATTAATATTGCTTGAGC 5’-thiol
BC1_3238A AACCTACTTCATTAATATTGCTTGAGT 5’-thiol
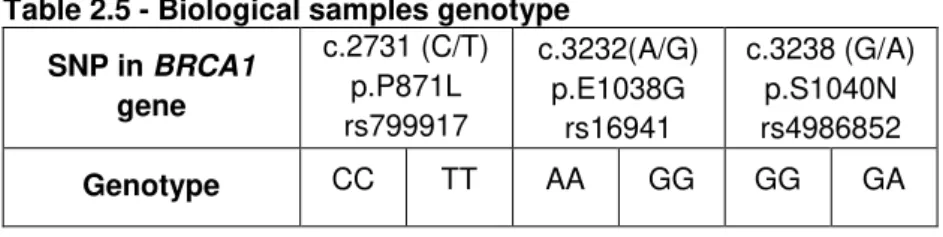
2.1.4.3 Human genomic DNA samples
Human genomic DNA samples harboring SNPs in the BRCA1 gene were gently provided by Drª. Fátima Vaz from the Molecular Biology Department and Breast Cancer Risk Evaluation Clinic, Instituto Português de Oncologia de Lisboa, Francisco Gentil.
Table 2.5 - Biological samples genotype
SNP in BRCA1 gene
c.2731 (C/T) p.P871L rs799917
c.3232(A/G) p.E1038G
rs16941
c.3238 (G/A) p.S1040N rs4986852
Genotype CC TT AA GG GG GA
2.2 Methods
2.2.1 Target Sequence Preparation
2.2.1.1 Preparation of competent E. coli cells (adapted from Inoue et al.[105])
1. E. coli DH5α cells were inoculated on a LB agar plate and incubated at 37ºC overnight. 2. A large colony was inoculated in 125 mL SOB medium in a 500 mL flask and grown at 20ºC with vigorous shaking up to OD600nm = 0.5 (normally 24 - 36 hours).
3. The flask was placed on ice for 10 min.
4. Cells were pelleted by spinning at 1,663× g for 10 min at 4ºC.
5. The cells were gently resuspended in 40 mL ice-cold TB and stored on ice for 10 min. 6. Cells were pelleted by spinning at 1,663× g for 10 min at 4ºC.
7. The cells were gently resuspended in 5 mL ice-cold TB and 350 μL DMSO (DMSO was stored at -20ºC o/n before use).
8. Competent cells were aliquoted in 200 μL fractions and stored at -80ºC until use.
2.2.1.2 PCR amplification
Reaction Mixture
Component per reaction (Vtotal=20μL)
10X DreamTaq buffer inc. MgCl2 2 μL
dNTP mix - 5 mM each 0.8 μL
Forward primer - 10 μM 0.5 μL
Reverse primer - 10 μM 0.5 μL
DreamTaq DNA polymerase - 5u/μL 0.1 μL
Water, nuclease-free to 20 μL
Reaction program
A first target denaturation was performed at 94ºC for 2 min, followed by 25 cycles of PCR, each cycle consisting of 95ºC for 30 seconds, annealing at 60ºC for 30 seconds, extension at 72ºC for 45 seconds and with a final extension step at 72ºC for 7 min.
These conditions were used for all PCR amplifications. Amplicons’ size and integrity were confirmed by electrophoresis (90 V, 1 hour) in 1% agarose gel with 1x TBE. The expected size of the amplicons can be found in Appendix A.
2.2.1.3 Cloning
2.2.1.3.1 Ligation
1. The amplicons of interest were extracted using the E-Gel® electrophoresis system with E-Gel® EX pre-cast 2% agarose gels, following the manufacturer's instructions.
2. The extracted amplicon (100 ng) was inserted into a linearized blunt-end pJET1.2 cloning
vector using the GeneJET™ PCR Cloning Kit and following the manufacturer’s Sticky-End
protocol.
2.2.1.3.2 Transformation of E. coliDH5α
1. The ligation product (2 μL) was added to 20 μL of E.coli DH5α competent cells and let to rest on ice for 30 minutes. 150 ng of purified pUC18 plasmid was used as positive control and as negative control, the ligation product was replaced by sterile H2O.
2. The cells were then submitted to a heat shock at 42ºC for 90 seconds and rapidly transferred to ice.
3. After 2 minutes on ice, 80 μL of SOC medium was added and the cells were incubated for 1
hour in a shaking water bath at 37ºC.
4. After incubation, 100 μL of the transformed competent cells were cultured on LB agar plates
with 100 μg/mL ampicillin and incubated o/n at 37ºC.
5. Up to three transformed colonies were resuspended in 25 μL of sterile H2O.
7. Stock solutions of the transformed cells were prepared by adding 300 μL of glycerol to 700
μL of culture and stored at -80ºC. The remaining volume of culture was used to extract and
purify the cloned plasmid, following step 2. onwards of the ―Plasmid extraction and purification‖ protocol.
2.2.1.3.3 Transformation of E. coli BL21 (DE3) pLysE
E. coli BL21 (DE3) pLysE competent cells (100 µl) were transformed with 10 ng of plasmid DNA (pBC1_2731C, pBC1_2731T, pBC1_3232_38AA and pBC1_3232_38GG) purified from the DH5α clones following manufacture’s transformation protocol. As positive control 200 pg of pUC19 plasmid provided by the manufactures were used.
2.2.1.4 Plasmid extraction and purification
1. An E. coli colony was inoculated in 2 mL of LB medium and 100 μg/mL ampicillin and incubated o/n in a shaking water bath at 37ºC.
2. Cells were pelleted by spinning at 16,707× g for 2 min at 4ºC in 1.5 mL eppendorfs.
3. The supernatant was discarded and the pellet was resuspended in 100 μL of ice-cold AL I solution.
4. After 5 minutes on ice, 200 μL of AL II solution was added and mixed by inversion.
5. After 5 minutes on ice, 150 μL of AL III solution was added and vigorously mixed by vortex.
6. After 5 minutes on ice, the lysate was centrifuged at 21,460× g for 5 minutes at 0ºC.
7. The supernatant was transferred to a sterile 1.5 mL eppendorf and 2 volumes of ice-cold absolute ethanol and 0.3 M of sodium acetate were added.
8. The plasmid DNA was left to precipitate at -20ºC o/n (or at -80ºC for 2 hours).
9. Afterwards, the precipitate was centrifuged at 21,460× g for 15 minutes at 0ºC and the supernatant was discarded.
10. The pellet was washed with 500 μL of ice-cold 70% ethanol and centrifuged at 21,460× g for 5 minutes at 0ºC.
11. The supernatant was discarded and the pellet was dried using a speed-vac system and
resuspended in 50 μL of sterile H2O.
12. RNase A was added to a final concentration of 25 μg/ml and incubated for 1 hour at 37ºC. 13. Two extractions with 1 volume of phenol were performed, followed by one extraction with 1 volume of chloroform.
2.2.1.5 Purification of template for in vitro transcription
The plasmids harboring the sequences of interest were used as template for PCR using the pJET1Fw primer and the reverse primer specific to each insert. The use of pJET1Fw primer allows the amplification of the phage T7 promoter sequence within the amplicon. The PCR amplification was carried out as described in 2.2.1.4 PCR amplification. The resulting amplicons were purified by phenol/chloroform extraction, followed by precipitation as described in 2.2.1.3 Plasmid extraction and purification, step 13 and 14. The pellet was then resuspended in 50μL of DEPC treated water.
2.2.1.6 In vitro Transcription
Reaction Mixture
Component per reaction (Vtotal=50μL)
15X Transcription buffer 10 μL
NTP mix – 10mM each 10 μL
Linear template DNA 1 μg
T7 RNA polymerase 1.5 μL
DEPC- treated water to 50 μL
Reaction program
The reaction mixtures were incubated at 37°C for 2 hours, followed by heat inactivation of the enzyme at 70ºC for 10 minutes.
2.2.2.1.6.1. In vitro transcript purification
A. Purification from agarose gel
1. The in vitro transcript was purified by excision from 2% agarose gel after electrophoresis (40 V, 2h30, 1x TAE).
A.I - Squeeze and freeze
1. The excised gel slice was frozen at -80°C during 20 minutes followed by centrifugation in a Spin-X tube according to the manufacturer’s instructions. The transcript was collected in microcentrifuge tube while the agarose is retained on the Spin-X membrane.
The concentration and quality of the purified in vitro transcripts were determined by UV/Vis spectroscopy at 260nm and by the 260nm/230nm and 260nm/280nm ratios. The correct size and integrity of the transcript was verified by agarose gel (2%, 1x TBE) electrophoresis (90V, 1h30).
A.II - Electroelution in dialysis tubing
Preparation of Dialysis Tubing
1. Tubing were cut into pieces of 10 cm length and left to boil for 10 minutes in a large volume of 2% (w/v) sodium bicarbonate and 1mM EDTA (pH 8) treated with DEPC 0.1% (v/v).
2. Dialysis Tubing were then thoroughly rinsed with water treated with DEPC and left to boiled 10min in 1mM EDTA (pH 8)
3. Tubing were allowed to cool and stored at 4ºC until further use.
Electroelution
1. One end of the bag was sealed with plastic clip, and the tubing was filled with 1x TAE buffer. 2. The band on interest was excised from the gel (as mentioned in Purification of the gel step 1) and placed inside the tubing.
3. The gel slice was allowed to sink to the bottom of the bag and the buffer was squeezed out leaving just enough to maintain the slice in contact with the buffer, and the bag was then sealed with another plastic clip.
4. The bag was immersed in an electrophoresis tank, maintaining the gel slice in parallel with the electrodes. Electric current (30V) was applied for 40 minutes.
5. Afterwards polarity was reversed for 1 minute to release any RNA that could adhere to the tubing.
6. The bag was then opened and the TAE recovered, precipitated and washed as described in
2.2.1.3 plasmid extraction and purification, step 7 to 11.
B. Desalting NAP-5 column
1. Purification of the in vitro transcript products through a desalting NAP-5 column, according to
manufacturer’s instructions, using 500 µl of water treated with DEPC as eluent.
C. Phenol/chloroform extraction
Note: For the NAP-5 desalting and phenol/chloroform extraction, elimination of the template was performed with DNAse I as described by the manufacture (2U of DNAse I per 50 μL of transcription reaction, at 37 ºC for 15 min).
2.2.1.6.2 Target Quantification
Quantification of synthetic ssDNA targets
All synthetic ssDNA targets were quantified through UV-vis spectroscopy using the extinction coefficient at 260nm of each ssDNA oligonucleotides, calculated according to OligoCalc bioinformatic tool available on-line [106].
Quantification of in vitro transcripts
Quantification of the in vitro transcripts was performed by agarose gel (2%, 1x TBE) electrophoresis (90 V, 1h30) analysis, using the fluorescence intensity of a known DNA/RNA ladder as reference. For RNA quantification the comparison of intensity was made using the 500 b fragment of the RNA ladder, RiboRuler™High Range, as reference. For the DNA template quantification, the 500pb fragment of the GeneRuler™ DNA Ladder Mix was used as fluorescent reference. The DNA template concentration within the purified transcripts was used to ensure that concentration of template does not exceeded the limits of detection reported (900ng) [90,91].
2.2.1.7 Total RNA Extraction from S. cerevisiae
An S. cerevisiae colony was inoculated in 400ml YPD medium and incubated o/n in a shaking water bath (150 rpm) at 25ºC. Yeast cells were harvested at the exponential phase of growth (OD600nm = 0.5 ~ 1). Total yeast RNA purification was performed using GeneJET™ RNA
Purification as described in the manufacture’s protocol. Integrity of total RNA was verified by agarose gel (2%, 1x TBE) electrophoresis (90V, 1h30). The concentration and quality of the transcripts was determined by UV/Vis spectroscopy at 260nm and by 260nm/230nm and 260nm/280nm ratios, respectively.
2.2.1.8 IPTG induction of E. coli BL21 and total RNA extraction
2. Afterwards, a dilution with new LB broth (provided with the antibiotics mention in step 1) was performed to achieve 0.05-0.1 OD600. These cultures were incubated at 37°C until OD600=0.4 (~ 3 hours).
3. Each flask was split in two: one for induction with 1mM IPTG and the other with no addition of IPTG, for expression control, and cultures were let to shake for 2 hours at 37ºC.
4. Total E.coli RNA extraction was performed by using GeneJET™ RNA Purification as
described in the manufacture’s protocol. Integrity of total RNA was verified by agarose gel (2%,
1x TBE) electrophoresis (90V, 1h30). The concentration and quality of the transcripts was determined by UV/Vis spectroscopy at 260nm and by the ratio 260nm/230nm and 260nm/280nm.
2.2.2 Nanoprobes Preparation
2.2.2.1 AuNPs synthesis (adapted from Lee and Meisel[107])
All glass material used in the synthesis process was previously treated with aqua regia (1 vol HCL: 3 vol HNO3) and washed with ultrapure milli-Q H2O (18.2 MOhm.cm resistivity at 25 °C).
1. In a 500 mL round bottom flask, 250 mL of 1 mM HAuCl4 were brought to a boil while vigorously stirring.
2. While in reflux, 25 mL of 38.8 mM sodium citrate were quickly added and the mixture was kept refluxing for 15 minutes with continuous stirring.
3. The colloidal solution was left to cool to room temperature while keeping the continuous stirring.
4. The colloidal solution was then transferred to a 250 mL Erlenmeyer flask with a ground glass cap and stored in the dark at room temperature until further use.
5. AuNPs concentration was determined by the Lambert–Beer law assuming a calculated molar absortivity for the plasmon resonance band maximum (526 nm) of 2.33×10⁸ M−1 cm−1.
6. Morphological characterization of the AuNP was performed by Transmission Electron Microscopy (TEM).
2.2.2.2 TEM analysis
microscope operated at 200 kV. Particle size and polydispersity were determined from the TEM pictures using the imaging software Carnoy 2.0, by analyzing at least 100 AuNPs.
2.2.2.3 Nanoprobe synthesis - Ultrasound method(adapted from Hurst et al.[108])
1. Three extractions with two volumes of ethyl acetate to 500 μL of thiol-modified oligonucleotide were performed.
2. The aqueous phase was further purified through a desalting NAP-5 column, according to
manufacturer’s instructions, using 10 mM phosphate buffer (pH8) as eluent.
3. The purified thiol-modified oligonucleotides were quantified by UV/Vis spectroscopy using the extinction coefficient at 260 nm provided by the manufacturer. Purified thiol-modified oligonucleotides were added to the colloidal solution of AuNPs in 1:200 (AuNP:oligos) ratio. 4. Synthesis Buffer I was then added to achieve a final concentration of 10 mM phosphate buffer (pH8), 0.01% (w/v) SDS. The solution vial was then submersed in an ultrasound bath for 10 seconds and let to rest at room temperature for 20 minutes.
5. Afterwards, a certain volume of Synthesis Buffer II was added to sequentially increase ionic strength up the final concentration of 0.05, 0.1, 0.2 and 0.3 M NaCl, respectively. Aftereach buffer addition, the vial was submersed in an ultrasound bath for 10 seconds and let to rest at room temperature for 20 minutes before the next increment.
6. After an o/n period at room temperature, the functionalized AuNPs were distributed in 1.5 mL eppendorfs and centrifuged at 21,460× g for 20 minutes.
7. The supernatant was discarded and the resulting oily pellet was washed twice with 1 mL of 10 mM phosphate buffer (pH8) and once with 1 mL of PBS solution
8. The supernatant was then finally redispersed in 500 μL/eppendorf of the same PBS solution.
The resulting solutions of each eppendorf were then gathered in a polypropylene 25 mL vial with a conical skirted base and stored in the dark at 4ºC until further use.
9. The final concentration of functionalized AuNPs (i.e. Au-nanoprobes) was determined by the Lambert–Beer law assuming a molar absorptivity for the plasmon resonance band maximum (526 nm) of 2.33×10⁸ M−1 cm−1.
10. Au-nanoprobes aliquots (13 nM) were prepared from stock solution using PBS as eluent and stored in the dark at 4ºC until further use.
2.2.2.4 Au-nanoprobes stability assays
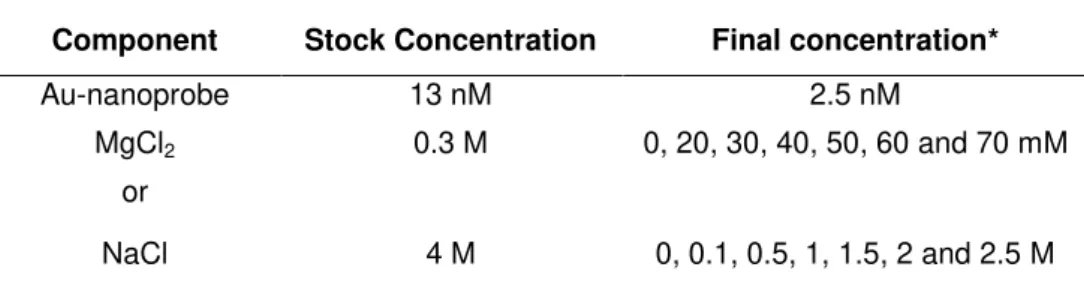
Table 2.6 - Stability assays
Component Stock Concentration Final concentration*
Au-nanoprobe 13 nM 2.5 nM
MgCl2 0.3 M 0, 20, 30, 40, 50, 60 and 70 mM
or
NaCl 4 M 0, 0.1, 0.5, 1, 1.5, 2 and 2.5 M
*10 mM phosphate buffer was added to fulfill a final volume of 30 µL
2. The solutions were heated for 10 minutes at 95ºC and let to cool for 30 minutes at room temperature.
3. Salt was added to the solutions and UV–visible spectrum were registered 15 minutes after salt addition.
2.2.2.5 Non-cross-linking hybridization assay
1. Assay solutions were prepared by mixing the Au-nanoprobe solution (final concentration of 2.5 nM) to the appropriate target (final concentration varied from 0.03 pmol/μL to 1 pmol/μL), and using 10 mM phosphate buffer to fulfill the final volume (60 μL for spectrophotometer
measurements or 30 μL for microplate measurements). As targets: the complementary target is
fully complementary to the probe (detecting the allele of interest), the mismatch target has only one base of difference (i.e it mimics the non-complementary allele for the same locus). As negative control a non-complementary target was added to solution, i.e a target from other locus than the one tested in the assay. A blank solution was prepared replacing DNA/RNA targets with 10mM phosphate buffer.
2. The solutions were heated for 10 min at 95ºC and then allowed to cool down for 30 minutes at room temperature.
3. MgCl2 was added to the final concentration determined by the Au-nanoprobe stability assays. UV-visible spectrum were registered 15 minutes after salt addition.
Spike-in assay
Assays were performed with 2.5 nM of Au-nanoprobes in a final volume of 30 μL. Fixed concentrations of the ssDNA oligonucleotide target (complementary or non-complementary target, as described in 2.2.2.5 Non-cross-linking hybridization assay step 1, were added to a final concentration of 120 fmol/μL (1.6 ng/μL). Total RNA of S.cerevisiae was added to a final
concentration of 1.6, 160, 228.6, 400, 640 ng/μL, in order to have decreasing % of ssDNA
buffer (pH8) was added. A blank assay was performed by adding only S.cerevisiae’s total RNA. As negative control an assay was performed with a non-complementary target.
2.2.2.6 Determination of Au-nanoprobes’ density by fluorescent assays (adapted from Sato et al. [109])
1. To release the thiol-oligonucleotides from the AuNPs surface, DTT was added (final concentration 100 mM) to 2.5 nM Au-nanoprobes in a total volume of 100 μL 1x TE.
3. RESULTS AND DISCUSSION
3.1. Biological Sample preparation
Human genomic DNA samples harboring SNPs in the BRCA1 gene were gently provided by Drª. Fátima Vaz from Instituto Português de Oncologia de Lisboa, Francisco Gentil (Table 2.5
2.1.4.6 Human genomic DNA samples). Based on these variants a set of synthetic oligonucleotides were designed to harbor the sequence variants of interest and used to test the capacity of Au-nanoprobes hybridization to the complementary targets (sBC1_2731C, sBC1_2731T, sBC1_3232_38AG and sBC1_3232_38GA). Simultaneously to achieve the in vitro/in vivo transcripts needed for the proof-of-concept, human genomic DNA samples harboring the SNP of interest were cloned into a pJET1.2 vector and subsequently transformed in E. coli DH5α, to guarantee a more stable insert and higher plasmid yield, and in E. coli BL21(DE3) pLysE, for in vivo transcription. The pJET1.2 vector harbors a T7 promoter sequence allowing in vitro or in vivo transcription of the insert sequence (Appendix B - Figure A.1). After screening of the correct orientation of the insert (by PCR screening) four different clones were sequenced (Appendix C): two clones harboring a 381 bp sequence with the c.2731C or c.2731T allele (pBC1_2731C and pBC1_2731T, respectively); and two clones harboring a 394 bp sequence with the c.3232A and c.3238A or c.3232G and c.3238G alleles (pBC1_3232_38AA and pBC1_3232_38GG, respectively).
3.1.2 In vitro transcription
Figure 3.1- In vitro transcription. Agarose gel (2%, 1x TBE, 0.5x Gelred TM) electrophoresis (80 V, 1h30). 1) Template BC1_2731C for transcription (473 bp); 2) in vitro transcription (resulting transcript of 431b) using BC1_2731C as template; 3) in vitro transcription using BC1_2731C as template, after incubation with DNAseI; L) RiboRulerTMHigh Range RNA Ladder.
The in vitro transcript cannot be directly used in detection assays because it induces aggregation of Au-nanoprobes prior to the hybridization step (3.3.2 in vitro RNA transcript). This issue has been previously described and the aggregation was suggested to be induced by the components within the transcription buffer[110]. Additionally, the presence of the template may also interfere with transcript quantification and probe stabilization. For these reasons the in vitro transcripts needed to be purified prior to their use in the non-cross-linking assay. This task revealed to be the most difficult one in the development of this work.
The extraction and purification of the transcript from agarose gel electrophoresis is a simply way to ensure only the presence of the RNA molecules of interest and, therefore, have a greater control over the assays. However to avoid contaminations or transcript damage, only a part of the agarose gels containing samples for slicing reference were stained with the fluorescent dye and submitted to UV light. The remaining gel was free from dye and UV exposure and the samples were sliced using the stained part of the gel as reference. Afterwards, purification of the transcript products within the slice of gel was carried out by two different methods:
i) squeeze and freeze method using a Spin-X tube.In this method the gel slice is frozen and then eluted through a column by centrifugation, retaining the agarose and the transcript and buffer are collected. This method allowed to isolate RNA (Appendix D, Figure A.2), but with a very low yield not sufficient to be used in the non-cross-linking assays.
ii) membrane dialysis. The possibility that a significant amount of transcript could remain in
the agarose fraction or in the column’s membrane, leaded to try a purification using membrane
dialysis. This method revealed to have even less yield and, therefore, there was a need to change the purification strategy.
1 2 3 L
1500 b 1000 b
Since the transcription buffer strongly induces nanoprobe aggregation, thus being the main impeditive cause for carrying out the assays, the next step was to purify the transcription product. Two different approaches were made in parallel.
iii) NAP-5 column, a desalting column. A simple elution of the in vitro transcription product through a NAP-5 column had been effective for other transcription products purification used for detection by the non-cross-linking method [110]. Unfortunately, in this case, the purified product induced stabilization of the Au-nanoprobes in the negative control. These results will be discussed later (see 3.3 in vitro RNA transcript detection).
iv) phenol/chloroform extraction. T7 RNase manufacturers’ suggest a phenol/chloroform extraction for the purification of the transcript and removal of the polymerase enzyme. This method revealed not to interfere with the capability of detection of the Au-nanoprobe system (see 3.3 in vitro RNA transcript detection).
These two last purification strategies do not manage to eliminate the DNA template from the purified solution. For this reason, an incubation with DNAse I was also performed. As a result, the DNA template and DNA/RNA hybrids were digested, but hydrolysis of RNA alone was also observed as it can be observed in Figure 3.1. This may be due to contamination of RNases in the DNase I. In fact residual RNase activity in DNase preparations have been already reported [111]
. Considering this, the colorimetric assays with in vitro transcripts were performed without digesting the samples with DNase I and a parallel assay with the template alone was also performed to rule out the possible interference of the DNA template (see 3.3 In vitro transcript).
3.2 Synthesis and Characterization of Au-nanoprobes
Synthesis of AuNPs
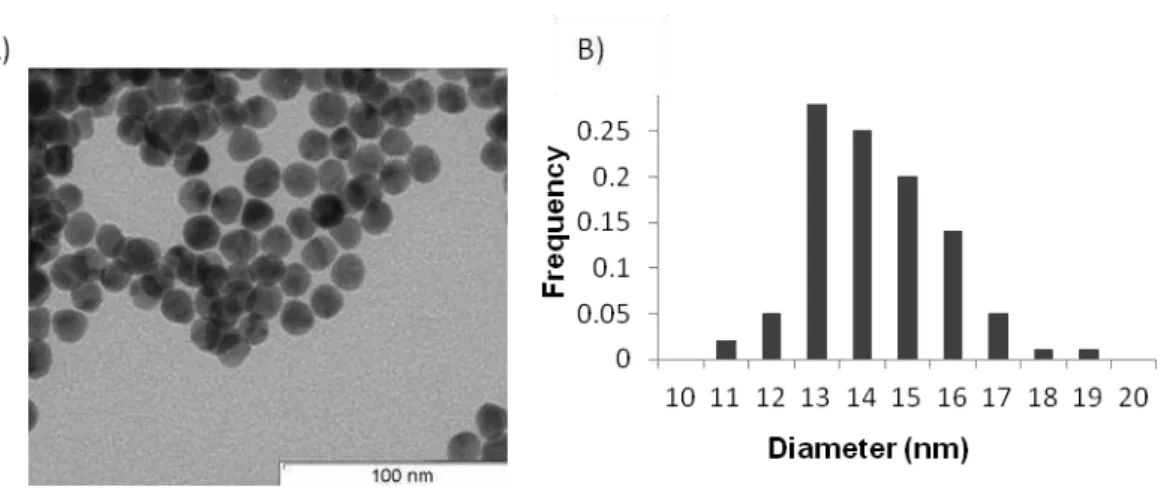
Figure 3.2 - AuNPs characterization.(A) TEM image of AuNPs. (B) Size histogram corresponding to the measurements of 120 AuNPs. AuNPs diameter (nm)= 14.2±1.5 (Average±STD)
AuNPs showed an average diameter of circa 14 nm, as determined by the measuring of 120 NPs from 5 TEM micrographs (Figure 3.2B), in agreement with previous reports following the same method[90,91,92].
Probe Design
To study the single base mismatch resolution of the non-cross-linking method in RNA transcripts, three different SNPs located in the BRCA1 gene coding region were used as proof-of-concept. For each SNP two probes were designed in order to detect each allele. The probes were derived from the complete coding sequence of BRCA1 (GenBank accession no. U14680). In order to hybridize to the RNA, the thiol-modified oligonucleotides were designed to be the antisense sequence, so as to be complementary to the RNA target.
Figure 3.3 - Complementarity between probes and targets. The BC1_3232A probe, with the variant nucleotide in the 5´end of the modified oligonucleotide, and BC1_3238G probe, with the variant
nucleotide in the 3’ end of the modified oligonucleotide, both hybridize to the synthetic oligonucleotide sBC1_3232_38AG.
The AuNPs functionalization was performed according to the ultrasound method described by Hurst et al.[108] and using a ratio of 200 oligonucleotides per AuNP. This method is preferred over the so called classic method described by Storfhoff et al.[70] since it has been reported to allow better reproducibility between batches and to be less time consuming[89]. Thus, a total of six Au-nanoprobes sequences were designed to detect each possible allele of the three SNP of interest, in order to characterize homo- and heterozygotes individuals (see Table 3.1).
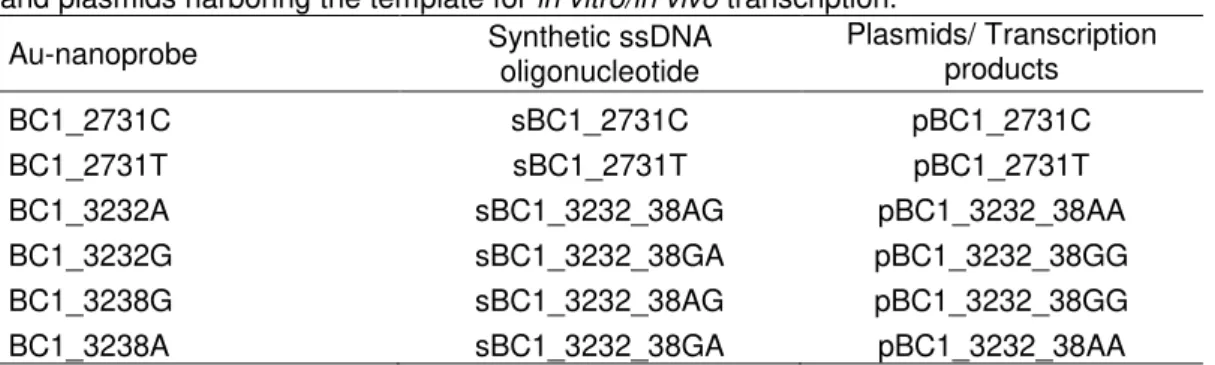
Table 3.1 - Au-nanoprobes and their fully complementary targets. Synthetic ssDNA targets and plasmids harboring the template for in vitro/in vivo transcription.
Au-nanoprobe Synthetic ssDNA
oligonucleotide
Plasmids/ Transcription products
BC1_2731C sBC1_2731C pBC1_2731C
BC1_2731T sBC1_2731T pBC1_2731T
BC1_3232A sBC1_3232_38AG pBC1_3232_38AA
BC1_3232G sBC1_3232_38GA pBC1_3232_38GG
BC1_3238G sBC1_3232_38AG pBC1_3232_38GG
BC1_3238A sBC1_3232_38GA pBC1_3232_38AA
Characterization of Au-nanoprobes
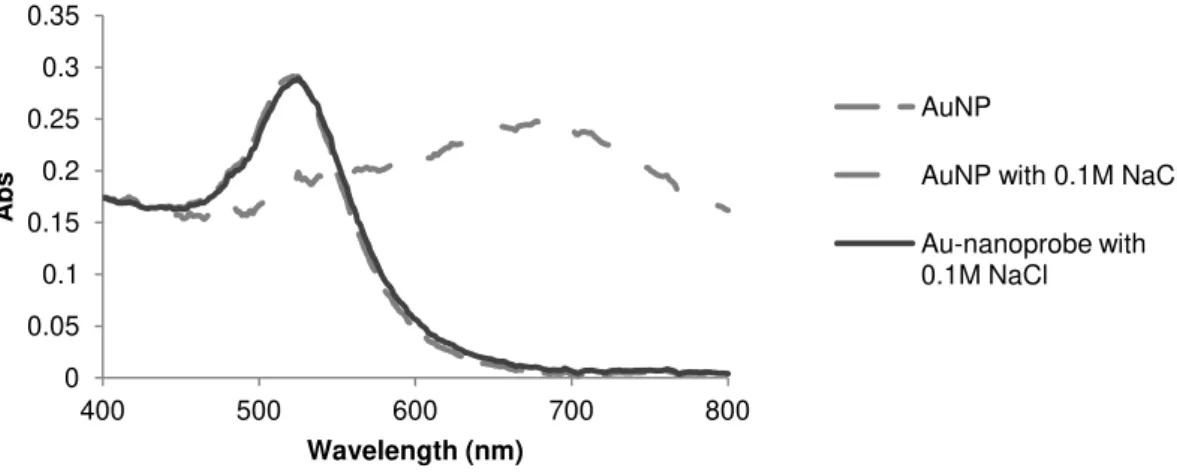
The characterization of Au-nanoprobes’ stability upon increasing ionic strength is essential for an efficient target detection by the non-cross-linking colorimetric assay, i.e. the determination of the minimum ionic strength necessary to induce aggregation or the Critical Coagulation Concentration (CCC).
To determine the CCC values of the synthesized Au-nanoprobes, a set of titration assays with the Au-nanoprobes and increasing concentrations of NaCl or MgCl2 were performed and the UV-visible absorption spectrum were registered in order to detect the colorimetric changes associated with AuNPs’ coagulation/aggregation.