Repositório ISCTE-IUL
Deposited in Repositório ISCTE-IUL: 2018-05-18
Deposited version: Post-print
Peer-review status of attached file: Peer-reviewed
Citation for published item:
Silva, A. T., Moro, S., Rita, P. & Cortez, P. (2018). Unveiling the features of successful eBay smartphone sellers. Journal of Retailing and Consumer Services . 43, 311-324
Further information on publisher's website: 10.1016/j.jretconser.2018.05.001
Publisher's copyright statement:
This is the peer reviewed version of the following article: Silva, A. T., Moro, S., Rita, P. & Cortez, P. (2018). Unveiling the features of successful eBay smartphone sellers. Journal of Retailing and Consumer Services . 43, 311-324, which has been published in final form at
https://dx.doi.org/10.1016/j.jretconser.2018.05.001. This article may be used for non-commercial purposes in accordance with the Publisher's Terms and Conditions for self-archiving.
Use policy
Creative Commons CC BY 4.0
The full-text may be used and/or reproduced, and given to third parties in any format or medium, without prior permission or charge, for personal research or study, educational, or not-for-profit purposes provided that:
• a full bibliographic reference is made to the original source • a link is made to the metadata record in the Repository • the full-text is not changed in any way
The full-text must not be sold in any format or medium without the formal permission of the copyright holders.
Serviços de Informação e Documentação, Instituto Universitário de Lisboa (ISCTE-IUL) Av. das Forças Armadas, Edifício II, 1649-026 Lisboa Portugal
Phone: +(351) 217 903 024 | e-mail: administrador.repositorio@iscte-iul.pt https://repositorio.iscte-iul.pt
1
Unveiling the features of successful eBay smartphone sellers
Abstract
The present study adopts a data mining approach based on support vector machines (SVM) for
modeling the number of sales of smartphone devices by eBay sellers. The data-based sensitivity
analysis was adopted for extracting meaningful knowledge translated into the relevance of each
input feature for the model. Such approach allowed unveiling that the number of items the seller
also has on auctions, the price and the variety of products the seller offers are the three features
that influence most the number of sales, in a total of almost 25%, surpassing the relevance of the
features related to customers’ feedback.
Keywords
2 1. Introduction
With the advent of Web 2.0 and online shopping, an immensity of data is collected from
myriad applications and devices. EBay is an excellent example of an online company boosting
its way through the Web 2.0 era, being currently one of the largest online sales platforms,
supplying online retailing services for any seller worldwide (Einav et al., 2014). Such a colossal
player entails a large set of different means for users to contribute with feedback on the services
provided and registered sellers. These feedback data plus other relevant data (e.g., data on the
items being sold, and users’ characteristics) is scattered throughout multiple sources, which
inevitably asks for some form of further treatment that allows classification, discovery of
patterns and trends or prediction of outcomes. Such treatment implies the usage of increasingly
complex and combined statistical and machine learning tools as the size of datasets builds up
(Amado et al., 2018). Nowadays, datasets may extend to several Exabytes, increasing the
challenging task of transforming such loads of information into actionable knowledge using
adequate methods (Canito et al., 2018).
Data mining is the process of discovering patterns of knowledge from raw data (Sharda et al.,
2018). Its roots lie on statistics and data analysis, and have been greatly enhanced through
machine learning techniques and methods. Data mining as an evolving process has been around
for some time, but only since the 1990s, when the concept was coined, until today has it been
gaining considerably more popularity and attention (Fayyad et al., 1996; Sharda et al., 2018).
This is happening due to the large amounts of data, in what is known as big data, that are
generated every second from several sources, such as sensors and devices (Pal et al., 2014) and
3
These themes are the stepping stones for this data mining study. Therefore, its goal is to
generate the type of information that is able to leverage decision support through actionable
knowledge. It might be of particular interest for online retail sellers, online marketplaces and
marketing practitioners, who may use the insights provided by the analysis of how online
features of sellers’ influence sales. In fact, large online e-commerce websites represent the future
of retailers (Clemes et al., 2014), and top players such as eBay, Amazon and Alibaba are among
the most technologically innovative organizations worldwide (Liu and Lu, 2015). Therefore,
research on improving customer service based on cutting edge technology can help cope with the
challenges of tomorrow.
Traditional data mining projects are time-consuming as all the data is often manually
extracted and with limited amount of resources, which usually leads to limitations in the scope of
analysis. In this case, the research is narrowed to the extraction of knowledge in the form of
features’ relevance from sellers of smartphones on eBay, one of the largest e-tailers worldwide (Kornberger et al., 2017). The aim of this study is to provide insights about what it takes to be a
successful eBay smartphones’ seller by unveiling through data mining which seller features
contribute the most to actual sales, i.e. which have the highest influence on the number of items
sold. Previous literature has approached the subject mostly from customer and potential
consumers’ perspectives yet rarely from the sellers’ point of view. As the number of registered
sellers on online platforms rises worldwide, it becomes crucial to understand what drives the
success of sellers within the different dimensions that can influence their results (Wu et al., 2015;
Kannan, 2017). Such knowledge can be valuable both from a seller’s perspective as well as for
managing online platforms (e.g., offering premium services to the most prospective sellers or
4
There is research focused on modeling the choice between auctions and posted prices
(Einav et al., 2018), on online businesses emerging in the form of eBay ventures (Gregg &
Parthasarathy, 2017), consumer trust in online purchases (Oghazi et al., 2018), e-satisfaction and
consumer spending (Nisar & Prabhakar, 2017), and eBay sellers’ reputation (Greenstein-Messica
& Rokach, 2018). Yet a stream of research that grasps onto the conspicuous and measurable
characteristics of online sellers combined with product attributes in order to determine their
impact on sales using data mining predictive techniques is still scarce in the literature. Therefore,
the immediate purpose of this paper is to fill in that research gap. In addition, the contributions
for the literature are the following:
• Extraction of online seller features from an online sales renowned platform, eBay; • Evaluation of the smartphones’ online market through the analysis of eBay sellers’
features and their impact on performance.
The next section dives deeply into the theoretical background, which supports the
relevance of the subject along with the data mining techniques in use, followed by a detailed
description of the chosen methodology and approach. Then, the results are discussed and
interpreted in order to extract adequate knowledge out of the data. Finally, the conclusions are
drawn in the last section.
2. Theory 2.1.Online sales
Web 2.0 is defined as a “set of applications and technologies that enable user-generated content, such as online social networks, blogs, video and photo sharing sites, and wikis” (Laudon
5
from the previous one by the drastic increase in information density, interactivity and level of
customization. This new phase can be traced back to 2007, when the changes became evident. It
is also relevant to draw attention to the associated shift from making online purchases to going
shopping online (Hemp, 2006, page 1) as the online environment and virtual communities
become vital elements in the consumer journey, in a phenomenon often named “social
commerce” (Huang and Benyoucef, 2013). Thus, recommendations from other consumers, instead of friend/family advice are also becoming an increasingly important decision factor
(Kotler and Keller, 2012, page 138). It is important to examine the e-tail environment since
“electronic markets enable volumes and speeds that human middlemen could not accomplish” (Venkatesan et al., 2006). However, there is still plenty of research focused exclusively on brick
and mortar retail context when compared with pure online players and bricks-and-clicks, which
have been growing expressively in the last years (Grewal et al., 2010).
Looking from the consumers’ perspective, Cheung et al. (2005) pointed out that the main determinants of online consumer behavior were related with consumer characteristics,
environmental influences, product/service characteristics, medium characteristics and merchants
and intermediates’ characteristics, which would have a transversal impact through the online customer journey.
In early research about pricing it was often argued that the advent of the Internet would
lead to heightened competition online, which would induce price reductions (Brynjolfsson et al.,
2006). Nevertheless, other features of online markets were found to have more impact in the
buying decision process such as variety and convenience. Hence, the trade-off between breadth
6
tools that speed up information sharing and networking has definitely been affirmative in
self-generation of content.
Moreover, recent studies have devoted efforts in finding influencing features on the
prices of online sales. Kocas and Akkan (2016) evaluated how online feedback and rating from
customers affected the prices of books from twenty-four categories sold through Amazon.com.
Their work has proved that customer ratings should be accounted for increasing profitability.
Cao et al. (2015) presented a study on dynamic pricing of online shopping by dividing customers
in patient and inpatient potential buyers, providing evidence that the optimal pricing policy
should limit dynamic pricing when facing customers with little patience. Sellers’ reputation has
proven to be an effective influencer of the pricing policy followed, with highly reputed sellers
having advantages in pricing, as shown by Xu and Ye (2015) through an analysis of TaoBao
sellers. However, the same study also emphasizes that literature on pricing related to reputation
is scarce. A previous article published by Ye et al. (2013) has reached a similar finding by
analyzing both TaoBao and eBay sellers. Both studies are conclusive in that sellers’ features do
affect pricing, influencing sales performance, with the latter adopting a regression model for
studying three sellers’ attributes: reputation score, number of positive reviews, and score for “item as described”. However, this study did not consider further features from sellers that are available on eBay, such as the neutral and negative reviews. Furthermore, both studies analyzed
online sellers in a pricing perspective, not accounting for the number of sales derived from
sellers’ features, a research gap that the present study attempts to fill.
Managing the variety of products sold, i.e., the assortment has always been an essential
element of business development (Ramdas, 2003). In today’s environment where high levels of demand together with increased want for a personalized offer have become frequent, finding the
7
right balance between variety and the level of customization is often a challenge. High variety
can be associated with increased variability and lead to errors in forecasting (Ramdas, 2003;
Fisher, 1997). The adoption of niche versus mass strategies is another important aspect related
with assortment management and it is inextricably linked with the level of variety and
specialization of the products sold. It was discovered that, from the demand side, huge variety of
inefficiently organized items can stagger consumers and hold back purchases due to forecasting
errors and difficulty for consumers to find the products they are looking for (Brynjolfsson et al.,
2006). If sellers choose marketing and assortment strategies that are not compatible in ensuring a
smooth supply chain (Fisher, 1997), it can have a negative impact on consumer behavior and
repurchase intention based on satisfaction (Yen et al., 2007) which will inevitably affect sales.
2.2. Smartphones
Technologies and telecommunications have become essential elements of everyday life
and business. The need for increasingly fast and optimized devices has guaranteed a steady
growth in the technological industry, although at due different regional paces (Kellerman, 2010).
Mobile devices have also become one of the primary sources for online shopping (Pearce and
Rice, 2013). In the UK, for example, mobile has already surpassed desktop by 44% (The
Guardian, 2014). Such relevance can prove to be an effective driver for increasing sales of
mobile devices (Bilgihan et al., 2016). Smartphones belong to this category since they are
essentially “mobile phones with more advanced computing capabilities and connectivity than regular mobile phones” (Statista, 2016). Although they have been available in consumer markets since the 1990s, only became truly popular and mainstream when, in 2007, the iPhone’s
8
introduction by Apple transformed the industry, leading also to the first Android based
smartphone being released to consumer markets in late 2008 (Lee et al., 2015).
Within the 19 most popular online shopping categories, IT and mobile is ranked 5th, achieving 40% in global online purchase rate, which reveals the potential and relevance of the
category for online shopping. Smartphones are mobile phones with operating systems similar to
PCs and they are, therefore, included in the mentioned category. Their number of sales has been
increasing sharply as in 2013 it already doubled compared to 2011. It is expected that by 2017
the market penetration of the devices will be of 65.8% in Europe and 62.2% in North America.
Thus, it is clear that smartphones are gaining more and more popularity and, as such, it is
foreseeable that their sales will increase and that gathering valuable market information will be a
source of added value in marketing planning. Furthermore, it is important to mention that over
335 Exabyte of data are generated and stored on a yearly basis through smartphones only
(Poelker, 2013). This immensity of data is transversal to all industries and can be extremely
valuable if used to retrieve important information (Pal, 2013).
It is estimated that by 2017 a third of the population worldwide will own a smartphone,
which will, according to forecasts, encompass 2.6 billion smartphones (Statista, 2016). In 2015,
solely, the global smartphone industry was responsible for the generation of approximately
240.55 billion Euros although with a decrease by roughly 1.49% comparatively to the previous
year.
Smartphones have become one of the most popular devices for purchasing products or
services, social media activity or conducting research (Bilgihan et al., 2016) with levels of
9
along with the fact that the price of smartphones has been steadily decreasing (Statista, 2016)
have fueled the growth in the industry
2.3. Data mining and support vector machines
According to Yu et al. (2012), online reviews and feedback have embedded in them the
unique opportunity of extracting knowledge for leveraging business intelligence. The role of data
mining becomes evident when wanting to derive information that generates actionable
knowledge and that can be easily accessed and handled by decision makers. It is clear that
mining is at the core of business intelligence (Han et al., 2012).
The potential of data mining extends to pretty much any scientific and business area.
From astronomy to marketing, fraud detection, manufacturing or telecommunications (Fayyad et
al., 1996; Hui and Jha, 2000), its usefulness transcends any field one might contemplate. Within
business applicability, increasing customer intelligence, improvement of operational efficiencies
and customer customization are only some of the broad possibilities for data mining (Pal et al.,
2014). Data mining has been used for modeling tourist hotel scores (Moro et al., 2017),
designing of products and information systems (Kusiak and Smith, 2007), predicting bank
telemarketing successful contacts (Moro et al., 2015a) or measuring social media performance
(Moro et al., 2016). Other examples include the application to e-learning domain (Hanna, 2004),
customer response to direct mailing (Coussement et al., 2015), credit risk assessment (Moro et
al., 2015b), or for discovering the helpfulness of online reviews (Lee and Choeh, 2014). These
are only a few among a vast array of studies in which data mining was used. In sum, data mining
and its techniques can be applied to any science and any industry as there is still a plethora of
10
since there is arguably a universal data mining method so far. Therefore, selecting the most
suitable one can be considered somewhat of an art (Fayyad et al., 1996).
In order to perform the inherent data mining tasks, numerous methods can be used. Such
procedures usually entail machine learning algorithms, which resort to computational methods
that allow learning information straight from the data without the need to have a pre-set equation
serving as a model (Mathworks, 2016). This enables improvement of performance as more and
more samples are added to the dataset, allowing the machine to learn. Decision trees, neural
networks and support vector machines (SVM) are just a few of them. In the expanse of this
project, only SVMs and sensitivity analysis will be explained in detail. Within these methods,
there are several functionalities to handle the patterns which are found throughout data mining
tasks. Those functionalities are fundamentally categorized into descriptive and predictive. The
first ones are associated with the description of properties of the data in a target data set while the
second ones use induction on the current data in order to make predictions (Han et al., 2012).
Vapnik and Cortes (1995) are the “architects” behind the support-vector network learning machine in pivotal stages of SVMs. They presented the idea of mapping nonlinear input vectors
into a high-dimension feature space where a linear decision surface would be built within a
deeply widening scenario in which training data could be separated with errors, and therefore
breaking ground to solving real problems, inspired by the initial discoveries of Fisher (1936) for
pattern recognition algorithms.
“Support Vector Learning Machines are finding application in pattern recognition, regression estimation, and operator inversion for ill-posed problems” (Schölkopf et al., 1997),
which was an early sign of their increasing popularity and applicability. They are often used for
11
higher dimension using a kernel function that computes dot products in the transformed space
(Friedman et al., 2001), from where it can find a hyper plane for data separation using essential
training tuples called support vectors (Han et al., 2012). They can also be used for regression
with the requirement of adding a loss function (Smola and Schölkopf, 1998).
A support vector machine is an algorithm which belongs to the same typology as other
neural network classifiers, e.g., an SVM with radial-basis function displays a matching hyper
plane to the neural network identified as radial basis function network (Han et al., 2012). The
completeness of SVMs’ algorithm enables the construction of models with enough complexity that, are, however, simple in a way which makes mathematical analysis possible. The algorithm
comprehends a significant amount of neural nets, radial basis function network and also
polynomial classifiers (Hearst et al., 1998).
One of the main benefits of SVMs is that they can attain good performance levels when
applied to real problems just as they can be analyzed with higher complexity and employing
theoretical concepts from computational learning theory (Hearst et al., 1998). The idea is often
supported as SVMs and are considered an attractive approach to data modeling. They combine
generalization control with a technique to address the curse of dimensionality (Gunn, 1998).
However, more recent research has questioned the statements since in the presence of powers
and products, by giving the same weights to terms in 2XjX′j form, a polynomial kernel of degree
2 in a 2-input feature space won’t be able to adapt to subspace concentrations and will difficultly
find structure by having many dimensions where to search (Friedman et al., 2001). Knowledge
would have to be assembled into the model to solve the problem of multidimensionality. On the
other hand, the same author backs the idea that, at the time, SVMs performed well when applied
12
building a linear boundary in a large transformed version of the feature space in order to produce
nonlinear boundaries (Friedman et al., 2001) and this simplifies analysis because it can be shown
to correspond to a linear method in a high-dimensional feature space nonlinearly related to input
space (Hearst et al., 1998). In other words, what occurs is that through the usage of a kernel, an
approximation function, and addition of a loss function, the hinge loss function, the desired
outcome is optimized. The jumbled data in the input space takes form into a separating hyper
plane, the feature space, which will be easier to analyze because the data becomes structured and,
therefore, further analysis is made possible until it develops into intelligible information.
2.4. Sensitivity analysis
When dealing with black box models, it is often a challenge to extract knowledge in a
way that is easy to understand. That fact inspired a new stream of research to tackle the inherent
problem. Consequently, methods such as extracting rules from networks and sensitivity analysis
(SA) have emerged. Sensitivity analysis enables the assessment of the importance of input
factors to a given model (Saltelli et al., 2000) and also their effects on the model’s responses
(Cortez and Embrechts, 2011). It is frequently employed in order to evaluate the coherence and
attractiveness of a kernel-based and ensemble black box models such as SVMs or neural
networks and, subsequently, facilitating their interpretation. This is a central element to any
model since it will contribute for increased understanding by different audiences and trust in data
mining. It can be disclosed using one among sensitivity analysis algorithms together with
appropriate visualization techniques. It is pointed out that extraction of rules is rather simplistic
13
and danger of generalization mainly resultant of discretization of the separating hyper planes
(Cortez and Embrechts, 2013).
One of the advantages of SA is its broad applicability to almost any supervised learning
model as the relationship goes straight to the bottom line of input-output relationship, i.e., the
way that any variation in a given input changes the respective output. There are several types of
methods, i.e., algorithms to choose from within SA. Among that group are included
one-dimensional sensitivity analysis (1D-SA), global sensitivity analysis (GSA) and data-based
sensitivity analysis (DSA). They diverge in their suitability to different goals. 1D-SA is very fast
but cannot measure complex interactions among the features, whereas GSA is perfect SA method
in terms of interaction measurement but it is computationally too costly. DSA is similar to
1D-SA but it uses training samples in detriment of a baseline vector. In effect, the main goal in the
case of DSA is to harvest the possible interactions between inputs but in a faster manner than
with GSA. If needed, DSA can even be speed up if a proportion of the training samples
(randomly selected) are used instead of the whole training set. Such feature makes DSA
computationally much more efficient than GSA, while having a better performance than 1D-SA
due to its capability of detecting input variable interactions.
2.5. Regression performance metrics
One of the crucial steps in model building is assessing its adequacy in predicting what it
is supposed to. Therefore, one can state that performance and adequacy in prediction models are
inevitably connected, i.e., if one model fails to predict its output then it is inadequate (Diebold
and Mariano, 2012). This brings out the importance of forecast accuracy since the derived
14
Although there are plenty of performance metrics, error metrics are quite often chosen.
Multivariate error distributions, which are produced by any forecasting method, enable this
process. These metrics were created to assess the discrepancies between predicted and actual
values. Additionally, they are relevant in model calibration and refining. As a consequence,
choosing the most appropriate metrics for forecasting accuracy is critical (Armstrong and
Collopy, 1992).
There are also performance evaluation techniques that contribute to model validity and
subsequently, its overall accuracy, such as cross-validation. Models are frequently evaluated
using this method and its estimates of a prediction error (Fayyad et al., 1996). According to
Refaeilzadeh et al. (2009), cross-validation can be applied to estimate performance, model
selection, and tuning learning model parameters. Moreover, it is also considered a reasonable
technique to deal with overfitting. With k-fold cross-validation, all the observations are randomly
split into k equal subsets, which are used as a test sample. The latter is used to assess model
reaction to new data, constituting a realistic predictive testing approach (Berry et al., 2004). The
remaining subsets are used as training data, which is used for model building. Essentially, each
of the subsets will operate as both training and testing data but only once as the latter. The
equally sized k testing subsets are gathered generating an estimate for the whole instances (i.e.,
cases) of the problem being addressed, which is the validation set.
As far as error metrics are concerned, mean absolute error (MAE) is one of the most
frequently used metrics for assessing forecast accuracy and it consists of the mean of the
absolute difference between the total of predicted values (Predi) for a given output variable and
its actual values (Truei) for all its n observations. Thus, it assesses the deviation in predictive
15 𝑀𝐴𝐸 = 1 𝑛∑|𝑇𝑟𝑢𝑒𝑖 − 𝑃𝑟𝑒𝑑𝑖| 𝑛 𝑖=1 (1)
Mean absolute percentage error (MAPE) is fundamentally the ratio of the MAE divided by the
total of true values. It is the relative variation to those values and it can only be applicable if
Truei > 0, otherwise the calculation is impossible.
𝑀𝐴𝑃𝐸 =1 𝑛∑ |𝑇𝑟𝑢𝑒𝑖 − 𝑃𝑟𝑒𝑑𝑖| 𝑇𝑟𝑢𝑒𝑖 𝑛 𝑖=1 (2)
Due to the mentioned restriction of MAPE, other metrics such as the relative absolute
error (RAE) came into the picture. The RAE is the difference between predicted and true total
values as a fraction of the difference between predicted and average total values. This metric
enables adjustment to the average values of the variable. The average value (Avgi) is imputed
into the single variations of each sample element which may contribute to increase accuracy for
models with low dispersion. In models with high dispersion, this metric might not be the most
suitable since pulling each set of values to its average instead of distributing the total of
differences throughout a given n, allowing the weights of the differences to be offset within the
model, widens enormously the gap in individual sets of values and ends up escalating the total
difference. However, it allows assessing predictive capacity when MAPE cannot, since the
average value imputation tackles the division by zero difficulty. The main advantage of RAE is
the ease of interpretations and communication (Armstrong et al., 1992).
𝑅𝐴𝐸 = ∑ |𝑇𝑟𝑢𝑒𝑖− 𝑃𝑟𝑒𝑑𝑖| 𝑛 𝑖=1 ∑𝑛 |𝐴𝑣𝑔𝑖 − 𝑃𝑟𝑒𝑑𝑖| 𝑖=1 (3)
Other metrics may be computed to address the issue raised with the RAE. One of such
16
of the MAE through the difference between the maximum (Rmax) and minimum (Rmin) values of
the output variable, as shown next:
𝑁𝑀𝐴𝐸 = 𝑀𝐴𝐸
𝑅𝑚𝑎𝑥− 𝑅𝑚𝑖𝑛 (4)
2.6.Online sellers’ theoretical framework
The Internet gave rise to a new form of business where individual users compete
side-by-side with corporate users as product sellers (Jeon et al., 2008). As the Internet moved forward
and gained maturity, so did research in developing theories supporting it (Kaplan and Haenlein,
2010). Particularly, the role of sellers has been widely studied, reflecting a shift after the Web 2.0
emergence, with individual users gaining considerable weight within e-marketplaces (Li et al.,
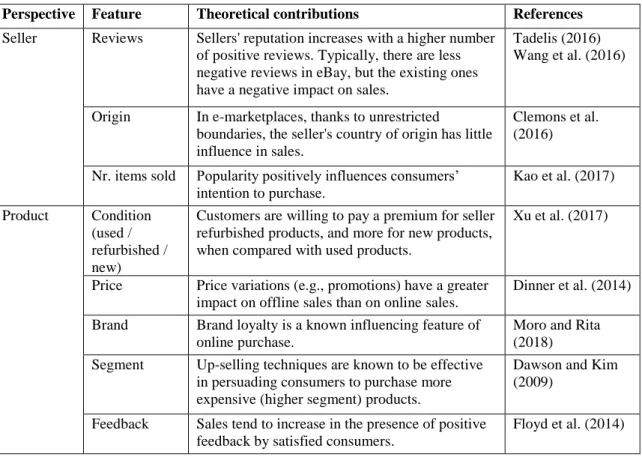
2015). Table 1 summarizes the main constructs of online sales success under two perspectives
(seller and product), supported by recently published literature to help in framing online seller’s
theoretical background. It highlights the relevance of seller’s reputation, particularly, in the face
of online consumer reviews, which leverage such reputation and, subsequently, positively affect
sales. Likewise, a positive product feedback will positively influence sales. The remaining
features have an older background support, which dates to before the advent of the Internet. Yet,
Table 1 shows that research has been prolific in recent years to update and adapt knowledge to
recent developments on online sales. Specifically, consumer empowerment shows evidence of a
distinct and more aware consumer behavior. The features highlighted in Table 1 have been
individually studied; however, research is lacking a holistic updated view that encompasses all of
them in a unique data-driven model of online sales. This is a gap the present research addresses
17
(Moro et al., 2014). Particularly, recent studies have shown the power of data mining to build a
model fed with features from different contexts and with a similar size to the collected dataset
(e.g., Moro et al., 2017).
Table 1 - Theoretical framework of online sales.
Perspective Feature Theoretical contributions References
Seller Reviews Sellers' reputation increases with a higher number of positive reviews. Typically, there are less negative reviews in eBay, but the existing ones have a negative impact on sales.
Tadelis (2016) Wang et al. (2016)
Origin In e-marketplaces, thanks to unrestricted
boundaries, the seller's country of origin has little influence in sales.
Clemons et al. (2016)
Nr. items sold Popularity positively influences consumers’ intention to purchase. Kao et al. (2017) Product Condition (used / refurbished / new)
Customers are willing to pay a premium for seller refurbished products, and more for new products, when compared with used products.
Xu et al. (2017)
Price Price variations (e.g., promotions) have a greater impact on offline sales than on online sales.
Dinner et al. (2014)
Brand Brand loyalty is a known influencing feature of online purchase.
Moro and Rita (2018) Segment Up-selling techniques are known to be effective
in persuading consumers to purchase more expensive (higher segment) products.
Dawson and Kim (2009)
Feedback Sales tend to increase in the presence of positive feedback by satisfied consumers.
Floyd et al. (2014)
3. Materials and methods 3.1. Approach preamble
When pursuing the employment of data mining techniques, one must go through previous
and subsequent technical stages in the knowledge discovery process from problem identification
and translation into the data mining world to assess results and possibly repeating the process
(Berry et al., 2004). Prediction is a directed data mining task that requires performing all the
18
modeling, validation and deployment into production or knowledge extraction for decision
support (Han et al., 2012).
A comprehensive dataset, including characteristics of sellers and their items, was
extracted manually to serve as the base set for the experiments. Sellers represent the problem
instances and the set of characteristics comprises both nominal, ordinal and scale features.
Moreover, data cleaning, data integration and data transformation, particularly some level of
computation to produce new features, were carried out in order to improve the accuracy and
efficiency of the mining algorithm (Han et al., 2012; page 83). Issues with missing values were
barely registered since problem instances which did not fulfill all the features were immediately
eliminated in the data cleaning phase; therefore, there was not a need to implement any method
to tackle that problem. Different techniques, tools and metrics are used within the various stages
of the process such as using SVM with RBF kernel for modeling, performing a k-fold
cross-validation, computation of performance metrics MAE, RAE and NMAE, and DSA for assessing
feature relevance.
For all the experiments conducted, the R statistical tool (https://cran.r-project.org/) was
adopted. R is an open source framework for the development of data analysis solution, with a
vast number of enthusiasts and contributors of packages in a wide number of fields of interest
(Ihaka and Gentleman, 1996). Moreover, the “rminer” package was adopted as it provides a
simple and coherent set of functions for performing data mining tasks such as modeling, model
19 3.2. Data preparation
The problem at hand is linked with the shortage of information about which elements
among seller and product characteristics have an impact on online sales of smartphones and how
they affect them in a measurable way. The gathered data ensures the reliability of the predictions
by means of extracting factual eBay features; yet, its internal validity is tested in the following
stages of the process using error metrics.
Subsequently, one needs to select the appropriate data for the experiments. In this stage,
data preparation was essential in compiling a coherent dataset characterized by features that
could be used for modeling the number of sales, i.e., the features must provide to a certain degree
a correlation with the outcome to predict. The dataset gathered for the experiments included 499
manually extracted reliable observations, which went through a transformation process prior to
modeling.
Initially, 23 different features were collected, plus the output variable, which was the
number of sales, “prodSales”. Those features are listed in Table 2 and identified with source
equals to “EBay” in the corresponding column, with Figures 1 to 4 showing the locations on the eBay webpages from where the features were extracted (the respective features’ names are
identified in the depictions). In the captions of each figure the URL link is also displayed to
obtain the webpage identified in each of the figures, for easier reproducibility. Since the R tool
was adopted for the experiments, the data types mentioned in Table 2 correspond to R data types
(more details on those can be obtained from
20 Table 2 - List of features.
Feature name Source Data type Description Status
NameSeller EBay Character Name of the seller on eBay Removed nrFollowers EBay Integer Total number of followers of the seller Approved posR EBay Integer Total number of positive reviews of
the seller
Approved
negR EBay Integer Total number of negative reviews of the seller
Approved
neuR EBay Integer Total number of neutral reviews of the seller
Approved
Country EBay Factor Country from which the product is sold Approved Continent Computed Factor Continent of the country Approved frItem EBay Integer Feedback rating for the items sold Approved frC EBay Integer Feedback rating for the communication Approved frST EBay Integer Feedback rating for the shipping time Approved frSC EBay Integer Feedback rating for the shipping
charges
Approved
diffProd EBay Integer Total products available by the seller Approved nrViews EBay Integer Total number of views of the seller Approved
dateCollection Computed Date/time Date in which data was collected Removed/Converted prodType EBay Factor Model of the product Removed/Converted Segment Computed Factor Assessment based on prodType, Brand
and other sources
Approved
Brand EBay Factor Brand of the product Approved
priceMin EBay Numeric Minimum price of the product (€) Removed/Converted priceMax EBay Numeric Maximum price of the product (€) Removed/Converted nrItems4Sale EBay Integer Number of items in “Buy it now”
section
Approved
nrItemsAuction EBay Integer Number of items in “Auction” section Approved nrResults4Phone EBay Integer Similar to “diffProd”, except it
considers only items under the category of “Cell Phones & Smartphones”
Approved
Condition EBay Factor Condition of the product (1=used, 2=refurbished, 3=new)
Approved
moreProdSales EBay Integer Additional sales Removed
memberSince EBay Date/time Date of membership Removed/Converted diffToToday Computed Integer Interval between dateCollection and
20thMarch 2016
Approved
priceAvg Computed Numeric Average of minimum and maximum price (€)
Approved
memberDays Computed Integer Interval between dateCollection and
memberSince
Approved
21 Figure 1 - Locations for the seller’s features extracted from eBay
22 Figure 2 - Locations for the seller’s products’ features extracted from eBay
23 Figure 3 - Locations for the product’s features extracted from eBay
(http://www.ebay.com/itm/<product>).
Figure 4 - Locations for the price’s features extracted from eBay
24
As part of the data preparation process, other additional features were calculated and
added to the dataset. These features are also displayed in Table 2, marked with the source
“computed”. The “dateCollection” registers the date when the data for that record’s seller was collected (between February 23 and March 15, 2016). The “continent” is another of the features
included and was based on the seller’s country and using the convention of seven prevailing
continents as defined by Lewis (1997): Africa, Antarctica, Asia, Europe, North America,
Oceania and South America. Despite the existence of several criteria, the former was chosen
because it depicted more precisely the distinctions between Europe and Asia, North America and
South America, which can be of value in understanding the effects of the geographical and
cultural nature associated with the seller. The “segment” is the result of a categorization based on
the smartphone brand and model, the model’s release date for covering the issue of older and
outdated models over the course of time and reviews from renowned sources such as CNET and
GSMArena (Table 3).
Table 3 - Categorization of smartphones’ segments.
segment Brand prodType Release date1 CNET2 review
1 Apple iPhone 4S October 2011 8.8 2 Apple iPhone 5 September 2012 8.7 ZTE BoostMax January 2014 6.7 BlackBerry Leap April 2015 6.6 Alcatel OneTouchPopC9 June 2014 N.A. 3 Apple iPhone 5S September 2013 8.5
Huawei AscendP6 June 2013 N.A. Huawei AscendP7 June 2014 6.7 ZTE AXONmini November 2015 N.A.
LG G4 June 2015 8
Microsoft Mobile Lumia535 December 2014 6.3 Microsoft Mobile Lumia640 March 2015 7.2 Microsoft Mobile Lumia640XL April 2015 N.A.
1 Data retrieved from: http://www.gsmarena.com/
25
Microsoft Mobile Lumia650 February 2016 6.8 Huawei Mate2 January 2014 7.3 Xiaomi Mi4c September 2015 8.7 Xiaomi Mi4i April 2015 N.A. HTC OneMini2 May 2014 7.3 Alcatel OneTouchIdol May 2013 6 Alcatel OneTouchIdol3 June 2015 7.6 Lenovo VibeShot June 2015 N.A. Lenovo VibeZ2Pro September 2014 N.A. Sony Mobile XperiaC5Ultra August 2015 N.A. 4 Apple iPhone 6 September 2014 9
ZTE AXONElite September 2015 N.A. HTC Desire820 November 2014 N.A. LG Gflex2 February 2015 8.3 Samsung Note4 October 2014 9 HTC OneM8 March 2014 8.7 Huawei P8lite May 2015 6.9 Samsung S6 April 2015 8.9 Sony Mobile XperiaM5 September 2015 N.A. Motorola XPlay August 2015 8.4 Motorola XStyle September 2015 7.8 5 Apple iPhone 6+ September 2014 9
Apple iPhone 6S September 2015 8.9 Apple iPhone 6S+ September 2015 9 Huawei AscendMate7 October 2014 7.7 Microsoft Mobile Lumia950XL November 2015 7.2 Huawei Mate8 November 2015 7.4 Huawei MateS October 2015 7 Xiaomi MiNote January 2015 8 Huawei Nexus6P August 2015 8.4 HTC OneA9 November 2015 6.9 HTC OneM9 March 2015 8 Huawei P8 April 2015 7.9 BlackBerry Passport September 2014 7.3 Samsung S6edge April 2015 9 Samsung S6edge+ August 2015 8.8 Samsung S7 March 2016 9 Samsung S7edge March 2016 9.1 LG V10 October 2015 8.2 Sony Mobile XperiaZ5Compact October 2015 8.7
26
Sony Mobile XperiaZ5Dual October 2015 7.4 Sony Mobile XperiaZ5Premium November 2015 7.4
Still at the same stage of data preparation, two different features that could not be directly
linked to the output variable because they were not quantifiable as an interval were transformed.
These are “memberSince” and “dateCollection”, which were converted into “memberDays” –
interval between “memberSince” and “dateCollection” – and “diffToToday” – interval between
March 20, 2016 (the date when modeling occurred) and dateCollection – respectively. Thus,
those two features together with “nameSellers”, which was an identification feature,
“moreProdSales”, which was not pertinent since the registered value was always the same (“N”) and “prodType”, which contained an unreasonable number of different categories, in a total of 56
from the 499 records, were removed.
Later on, the need for a new, more efficient, feature arose. It was “priceAvg” and it
replaced “minPrice” and “maxPrice” through the computation of the average of both. This
happened in order to avoid the creation of redundancies since, for most cases, the values
registered were the same. Only 46 out of the 499 cases displayed a difference between both
minimum and maximum prices. Column “status” from Table 2 reflects the actions taken for each
feature, with only the “approved” being included for the modeling stage. Thus, the 21 different features approved plus the outcome to model (“prodSales”) were considered fully functional for
proceeding to the next stage, the actual mining of the data.
3.3. Modeling and knowledge extraction
After gathering all the data with adequate methods, this stage is the pinnacle of a data
27
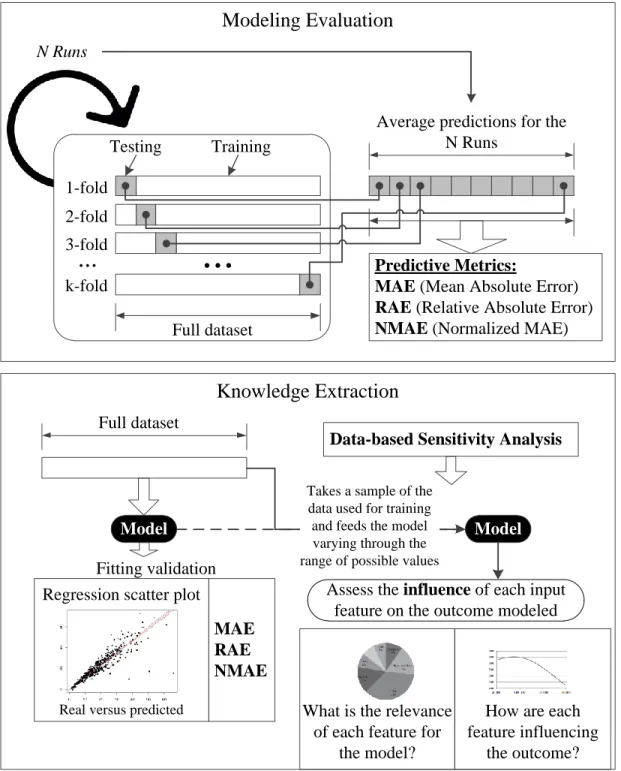
methods, which will subsequently allow extracting knowledge. Figure 5 shows in a picture the
approach followed for this stage. It comprises two main phases. First, the SVM’s capabilities of
correctly predicting the number of sales for each smartphone’s seller are evaluated through a
cross-validation scheme with 10-folds. For assuring even further the robustness of the model
built on the data, the 10-fold cross-validation procedure is run twenty times. To evaluate
prediction accuracy, three metrics were chosen: MAE, RAE, and NMAE. It should be noted that
MAPE was ruled out from this procedure since the dataset contains five records with zero sales,
meaning that MAPE cannot be computed for these cases. Furthermore, MAPE distorts the
percentage deviation for low values of “prodSales”, with this feature ranging from zero to 2,716. Since for each record there are twenty predicted values given the twenty runs of the procedure,
the final prediction value for measuring performance is the average of these twenty results.
After assuring that SVM obtains reasonable prediction results, the knowledge extraction
phase of the procedure follows. It uses the full dataset to take advantage of the maximum
information possible and builds a model based on SVM on top of that data. The validation of
fitting the whole dataset is achieved through the three metrics, MAE, RAE and NMAE. Also, to
obtain a visual picture of the deviations of the predictions from the real results, a regression
scatter plot is drawn.
Finally, the model built on this second phase is used for knowledge extraction through
the DSA. DSA takes a sample from the dataset used for training the model and then performs an
output sensitivity assessment based on varying the input features through their range of possible
values. As a result, it makes possible to assess the influence each feature has on the number of
28
from the 21 has on the model; and how each of the features affects the number of sales. Such
knowledge may provide valuable insights on understanding sellers’ performance.
1-fold 2-fold 3-fold k-fold
...
...
Testing Training Full dataset N Runs Predictive Metrics:MAE (Mean Absolute Error) RAE (Relative Absolute Error) NMAE (Normalized MAE)
Modeling Evaluation
Average predictions for the N Runs
Knowledge Extraction
Full dataset Model MAE RAE NMAERegression scatter plot Fitting validation
Real versus predicted
Data-based Sensitivity Analysis
Model
Takes a sample of the data used for training
and feeds the model varying through the range of possible values
Assess the influence of each input feature on the outcome modeled
What is the relevance of each feature for
the model?
How are each feature influencing
the outcome? Figure 5 - Scheme with the Modeling Evaluation approach followed.
29 4. Results and discussion
4.1. Modeling
Ascertaining the adequacy of the model involves computing and gauging the
performance metrics identified in the modeling evaluation phase from Figure 5. Accordingly,
MAE was 60.84 of absolute difference in sales, whereas RAE was 74.48% and NMAE 2.24%.
The substantial discrepancies between the values using different metrics bring out once again the
seriousness about choosing the most fitting measure to a given model. NMAE was clearly
successful in assessing model adequacy because it is adjusted to the reality of the model, i.e., the
range values of the output variable. For instance, as the number of sales increases, it is possible
that the difference between Rmax and Rmin increases and when using this metric that effect is
accounted for without necessarily impairing the results. RAE was not as successful since in
models with high dispersion or with a small concentrated cluster of exceptionally high or low
values (e.g., 2,716 and zero, for the case addressed), the average does not reflect their broader
spectrum. Basically, the more the numerator exceeds the denominator or the closer they are to
each other when the numerator is inferior to the denominator, the less the metric will favor
model adequacy. Evidently, in models with high dispersion this will lead to adverse results when
using RAE. The MAE result is not directly comparable with RAE or NMAE, since this accounts
for the absolute difference in the number of sales. However, as with RAE, such a dispersion of
values, i.e., large difference between the maximum and minimum possible values does not
reflect an accurate metric for evaluating performance as it happens with NMAE, where the
breadth of values of the output variable is integrated in the formula.
Also, it becomes clear that this particular model is not suitable for higher number of
30
observations with sales over a thousand. Nonetheless, the values obtained using an SVM
modeling technique provide evidences of an approximation of the predicted values to the real
number of sales, confirming the usefulness of the model for knowledge extraction.
4.2. Knowledge extraction
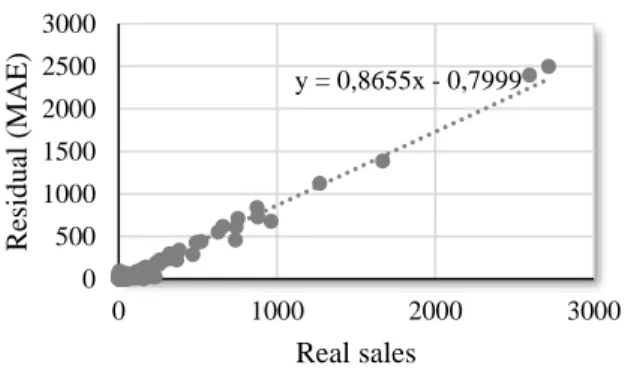
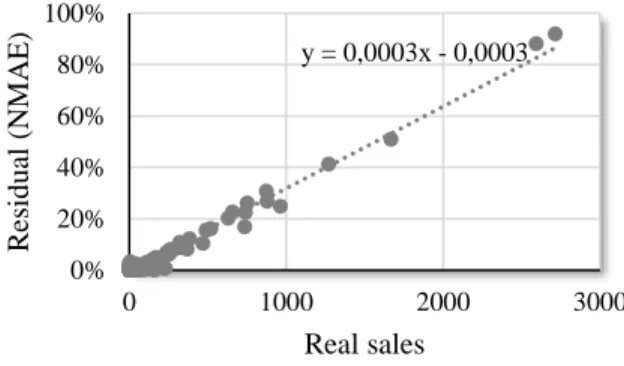
In order to show how the employment of different metrics allows fitting validation, the
charts below were drawn using MAE (Figure 6) and NMAE (Figure 7) as references for
residuals on y-axis at against real sales (Truei) on x-axis. Both graphics show a linear relation
between the corresponding metrics and the deviation to the real number of sales. The MAE was
of 49.98, an improved result when compared with model evaluation. This happens because
during model evaluation, the dataset was always divided in training and testing datasets, whereas
in knowledge extraction, the model was built upon using the whole records from the dataset.
Also aligned with this difference, RAE shows improvement at a value of 61.19% along with
NMAE at 1.84%. Table 3 summarizes the three metrics for the two phases of the approach
(Figure 5).
Figure 6 - Regression scatterplot with real sales (x) versus residual with MAE (y).
y = 0,8655x - 0,7999 0 500 1000 1500 2000 2500 3000 0 1000 2000 3000 R esid u al (MA E ) Real sales
31 Figure 7 - Regression scatterplot with real sales (x) versus residual with NMAE (y).
Table 4 - Results for the three performance metrics.
Modeling evaluation Knowledge extraction
MAE 60.84 49.98
RAE 74.48% 61.19%
NMAE 2.24% 1.84%
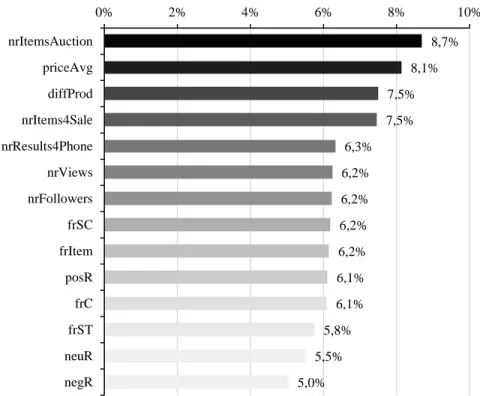
DSA allowed understanding to which extent the features that fed the SVM algorithm
explained the output variable. Figure 8 exhibits a visual picture of features’ relevance, while
Table 5 shows the percentage values for all the 21 features rounded to the hundredth.
Correspondingly, it was discovered that 14 out of the 21 features had a particular influence in the
output variable (above 5%), i.e., the number of sales of the smartphone. Their combined
contribution to the model is of approximately 91%. The difference between the decomposed
contributions of the 14 features was little. The least contributor, the “negR” had an influence of
5% whereas “nrItemsAuction” had an impact of 9%, the highest contribution.
y = 0,0003x - 0,0003 0% 20% 40% 60% 80% 100% 0 1000 2000 3000 R esid u al (NM A E ) Real sales
32 Figure 8 - Features' relevance for modeling sales (shows only values for features with relevance
above 5%, rounded to the tenth).
Table 5 - Features' relevance for modeling sales.
Feature Relevance nrItemsAuction 8.70% priceAvg 8.14% diffProd 7.50% nrItems4Sale 7.47% nrResults4Phone 6.33% nrViews 6.25% nrFollowers 6.23% frSC 6.19% frItem 6.16% posR 6.11% frC 6.09% frST 5.76% neuR 5.52% 8,7% 8,1% 7,5% 7,5% 6,3% 6,2% 6,2% 6,2% 6,2% 6,1% 6,1% 5,8% 5,5% 5,0% nrItemsAuction priceAvg diffProd nrItems4Sale nrResults4Phone nrViews nrFollowers frSC frItem posR frC frST neuR negR 0% 2% 4% 6% 8% 10%
33 negR 5.04% diffToToday 2.79% segment 1.34% country 1.32% condition 0.98% brand 0.82% continent 0.65% memberDays 0.64%
The most striking observation that both Figure 8 and Table 5 show is that the five most
relevant features, comprising around 38% of influence, are all related to the assortment of
products the seller offers and its management, i.e. showroom-related, including the average price
and the range of different products offered by the seller. Organic reach and engagement through
“nrViews” and “nrFollowers” respectively also play a role on the number of sales, even though with far less influence than the combined relevance of the assortment-related features. Such
result is aligned with the findings of Moro et al. (2016), which concluded that organic reach and
engagement have impact on brand building in social media. Interestingly, the next group of
consecutive features in terms of relevance is constituted by seven customer feedback related
features, with a combined weight of around 41% of relevance, in a total slightly above the
showroom-related related features. This result is a confirmation of previous studies in terms of
the influence that customer feedback has on sales (e.g., Kocas and Akkan, 2016). Nevertheless,
the top five features remain all product related, relegating individual feedback features for an
inferior level.
It was curious that specific product features such as brand and segment along with
particular seller features such as country and membership time, barely influenced product sales
when compared to the previous ones. The figures mirror the importance of a focused and
34
and ensures customer satisfaction that is visible through feedback and ratings to the detriment of
more specific seller and product features.
The number of items in auction can be traced back to behavior of bidders striving to get the best
deal. As a typical auction website, it is natural that users refine their eBay search looking for
items in this category even if they choose another selling format to buy the item. This is reflected
in the observed relevance of the input on sales as shown in Figure 9.
Figure 9 - Impact of number of items in auction on sales.
As expected, “priceAvg” described a fair share of the model as it was the second most
significant feature. This happens because price is unquestionably one of the most important
marketplace cues (Lichtenstein et al., 1993). Interestingly, it was found that in the particular case
of smartphones, product sales plummet until the price level of approximately 1,000 €, after
which they start rising (Figure 10). Although it happens many times that product positioning is
focused on high-end markets and frequently price is used as a proxy of product quality, as Varian
(2014) stated, it also happens often that there is not a direct relation between prices and sales, as
sometimes high prices are related to high sales; therefore, the same author argues that continuous
experiments with big data and data mining are in demand for obtaining an accurate model. The
0 10 20 30 40 50 60 0 100 200 300 400 p ro d Sales nrItemsAuction
35
data suggests that, regarding smartphones, customers are sensitive to the relationship between
quality and price as they are willing to spend more on a smartphone in return for higher quality.
Figure 10 - Impact of average price on sales.
The variety of products sold by a given seller is linked with visibility. The more products
are available for sale the more likely it is that views of the seller increase due to inherent
exposure. However, if the products fall into many different categories, its assortment might not
translate into sales of a particular smartphone. Thus, it makes sense that small groups of different
products have less impact on boosting sales than having a larger variety and volume of products
(Figure 11).
Figure 11 - Impact of assortment on product sales.
0 10 20 30 40 50 0 500 1000 1500 2000 2500 3000 p ro d Sales priceAvg 0 10 20 30 40 50 60 70 0 10000 20000 30000 40000 p ro d Sales diffProd
36
The number of items in the “buy it now” listing, “nrItems4Sale”, is also linked with visibility since it is tied with search filtering. Furthermore, if search is merely product-based,
results for items on “buy it now” or in auction can both be presented. Shopping with this type of filtering might, however, be related to preferences for convenience and timeliness since instead
of waiting for an auction to end or facing the possibility of losing to another bidder, one can
simply buy the product straight away while having access to the same type of information. It is
interesting to notice though that after 24,820 items, product sales stabilize at around 60 (Figure
12). However, it should be stressed that only two sellers offer more than that number of products,
leading to hypothesize that additional data with sellers offering large number of products would
be needed in order to confirm the curve drawn on Figure 12 after the threshold.
Figure 12 - Impact of number of items in “Buy it now” section on sales.
The influence of the number of results for smartphones shown in Figure 13 reflects the
effect of specialization of sellers and therefore their commitment to the category. It is natural that
people have more trust in specialized sellers of any category than in generalists, which might, in
some cases, sell few smartphones in a multitude of products. There are 219 of the sellers within
the dataset where the number of smartphones is more than half of the total number of items for
sale, while the remaining 280 have a lesser portion of share of smartphones in their stock.
0 10 20 30 40 50 60 0 10000 20000 30000 40000 p ro d Sales nrItems4Sale
37 Figure 13 - Impact of specialization on product sales.
The number of views is intrinsically connected with organic reach and it was intriguing
that after 186,160 views, product sales continuously dwindled until it reached a plateau (Figure
14). This may be caused by several different factors; for example, as Moro et al. (2016) pointed
out for the case of social media, an increase in the number of views may also provoke some
degree of erosion of the seller on eBay. Moreover, there is hardly a direct relation between
reachability and market penetration, as other features should be accountable, as observed for the
case of “nrResults4Phone”.
Figure 14 - Impact of number of views on product sales.
Number of followers is linked with reachability and engagement. It is an important
source of partial estimates regarding past clients although there might be other reasons for
0 10 20 30 40 50 60 70 0 5000 10000 15000 p ro d Sales nrResults4Phone 0 20 40 60 80 100 120 0 100000 200000 300000 400000 500000 600000 p ro d Sales nrViews
38
following a seller, which are not covered within the scope of this study. In this case, after 8,294
followers, product sales suffer a slight decay (Figure 15). This shows that after a certain number
of followers, there is not any significant increment to sales.
Figure 15 - Impact of number of followers on product sales.
Feedback ratings are often a quite accurate source of varied information about a seller
since only after a transaction occurs can the members involved leave a feedback consisting of a
short comment and ratings (in the case of the four features considered, only quantitative ratings
were included). In this particular case, feedback rating regarding shipping charges was found to
be the most significant out of all features within the typology, even though the difference
between the most relevant feature (“frSC”) and the least relevant, shipping time (“frST”), is just of 0.43% (Table 5). Such figure may be a result of the worldwide nature of eBay, with registered
sellers shipping from around the world, raising the sensitivity that customers have to the values
of shipping goods. Figure 16 shows that feedback for communication (“frC”) and for the items
sold (“frItem”) have a similar influence on sales, while both shipping features previously mentioned have also a similar influence between each other. The latter group reveals that
shipping feedback results in a more immediate impact on sales, even on a lower number of
ratings. 0 10 20 30 40 50 60 70 0 5000 10000 15000 20000 25000 30000 p ro d Sales nrFollowers
39 Figure 16 - Impact of feedback rating features on product sales.
The number of positive reviews is another source of valuable insights on successful
transactions and it is reasonable to argue that product sales are highly influenced by their value
since one can intuitively link a positive review with a positive future response (Hervas-Drane,
2015). It is common that as the number of transactions increases, positive reviews tend to be
offset by both neutral and negative reviews, as it was observed throughout the dataset. However,
if sellers manage to deliver consistently satisfying products along with the associated service,
then product sales are expected to grow (Figure 17).
Figure 17 - Impact of the number of positive reviews on product sales.
Within the reviews’ typology positive ones have a more gradual impact than neutral reviews and negative, which have higher impact on lower levels of product sales, as it becomes
0 10 20 30 40 50 60 70 0 100000 200000 300000 p ro d Sales feedback rating (fr) frC frSC frST frItem 0 10 20 30 40 50 60 70 0 50000 100000 150000 200000 250000 p ro d Sales posR
40
clearly visible in Figure 18. The results reinforce the idea that for smartphones, product features
play a more significant role than customer feedback and, subsequently, reviews that corroborate
the initial perception regarding the product contribute more for sales than neutral or negative
ones. On another note, it would be interesting to understand on further research the substantial
difference in volume of positive reviews and remaining types which yield more comparable
volumes.
Figure 18 - Impact of the number of negative and neutral reviews on product sales.
4.3.Research findings and managerial implications
Table 6 summarizes the main findings stemming from previous sections and draws
relevant managerial implications. The presented implications can serve as guidelines for sellers
eager to increase smartphone sales. Visibility is a known key factor of sales success, and in the
smartphone online market, this is no exception. Particularly relevant is the interesting relation
between the number of products on auctions and the number of sales on the “buy it now”
purchase model. This contribution has no precedents in the literature, but its value is reflected in
the large number of eBay sellers which opt to choose both business models (“buy it now” and
auctions). An also interesting and previous unforeseen behavior is the lower success of
mid-range models when compared to both low and high-end models. This seems to be a specifically
0 10 20 30 40 50 60 70 0 1000 2000 3000 p ro d Sales reviews negR neuR
41
smartphone sales behavior, justified by the polarized smartphone demand, with users looking for
the cheapest on one hand, or for the most technologically advanced product on the other hand.
Although the case is drawn specifically from an empirical research on smartphone sellers,
some of the findings suggest that potentially similar behavior may occur for other products,
given the wide dissemination of eBay. Yet, future research on other products is required before
any generalization.
Table 6 - Summary of findings.
# Research Findings Managerial Implications
1 The number of items on auction has a positive effect on the number of sales on the "buy it now" format.
Sellers willing to increase their "buy it now" sales can promote their products by also selling them on auctions.
2 Smartphones are products experiencing an effect where the low-end and high-end models are more success in terms of the number of sales, when compared to the middle range models.
Smartphone sellers are more success if they focus on a low or a high-end model.
3 A seller with a higher assortment is more likely to have a higher number of sales of a specific smartphone.
Visibility is linked with having a larger variety of products for sales, which translates into a higher number of sales. 4 Sellers specialized in smartphones tend to
have more success than sellers that have a broader offer of other products.
Specialization is key to increase seller's reputation of a specific type of product, increasing its sales.
5 It is important to have many followers as it increases sales; however, having more than 8,000 does not have a significant impact.
The number of followers is linked with reach and engagement. However, the target audience of real prospective buyers is restricted to a certain threshold, as more followers above that do not directly translate into more sales.
5. Conclusions
Online marketplaces are currently one of the most thriving forces in retailing, with a huge
42
worldwide visibility, making of it an adequate choice for sellers to promote their products.
Furthermore, eBay provides numerous means for customers and users to submit feedback on
products and sellers, information that helps to build sellers’ reputation. While eBay allows selling any kind of product, the present study is focused on the sales of smartphones, which are
sophisticated communication devices with computer capabilities. The smartphones’ market is considered one of the most relevant in the information technology field, which has been growing
with each new year since the first iPhone was launched by Apple in 2007.
Given the relevance of online sales and, in particular, of eBay and the smartphones’ market, the present study focused on unveiling the features that best characterize the success of
smartphones’ eBay sellers, measured by the number of sales. In order to succeed in such goal, the approach adopted included a data mining project using support vector machines for modeling
and the data-based sensitivity analysis for extracting knowledge in terms of the relevance of the
input features used for modeling the number of sales. The contributions and novelty of the
present study lie within two dimensions: on the management perspective, the focus on evaluating
the features that best identify a successful seller in terms of the number of sales, as opposed to
previous studies giving more emphasis on pricing; on the information science perspective,
through the compilation of a previously non studied dataset including features related with
distinct valences such as product (e.g., brand), reachability and engagement (e.g., number of
followers), customer feedback (e.g., number of positive reviews), and seller information (e.g., the
country of origin).
Modeling robustness was tested through a 10-fold cross-validation scheme, executed for
twenty times. Model performance was evaluated using three performance metrics: the mean