Factors associated with maintenance
of the use of internet,
EpiFloripa Idoso
longitudinal study
Rodrigo de Rosso KrugI,II, André Junqueira XavierIII, Eleonora d’OrsiI,III
I Universidade Federal de Santa Catarina. Programa de Pós-Graduação em Ciências Médicas. Florianópolis, SC, Brasil II Universidade de Cruz Alta. Programa de Pós-Graduação em Atenção Integral em Saúde. Cruz Alta, RS, Brasil III Universidade Federal de Santa Catarina. Programa de Pós-Graduação em Saúde Coletiva. Florianópolis, SC, Brasil
ABSTRACT
OBJECTIVE: To describe the use of the internet and to identify the sociodemographic and health factors associated with changes in the use of the internet over four years in older adults participating in the Brazilian EpiFloripa Idoso study.
METHODS: This is a longitudinal home-based, population-based study with 1,197 older adults who live in the urban area of Florianópolis, State of Santa Catarina, Brazil. We applied a face-to-face interview. We describe the use of internet according to frequency, place, devices, and motives of the use of the internet. To identify factors associated with changes in the use of the internet, we categorized the outcome as: non-use of the internet, stopped using the internet, started using the internet, and kept using the internet. The independent variables were sex, age, family income, education level, family arrangement, marital status, presence of caregiver, paid work, and cognitive impairment screening. We used multinomial logistic regression with risk ratio (RR) estimates and their respective confidence intervals (95%CI).
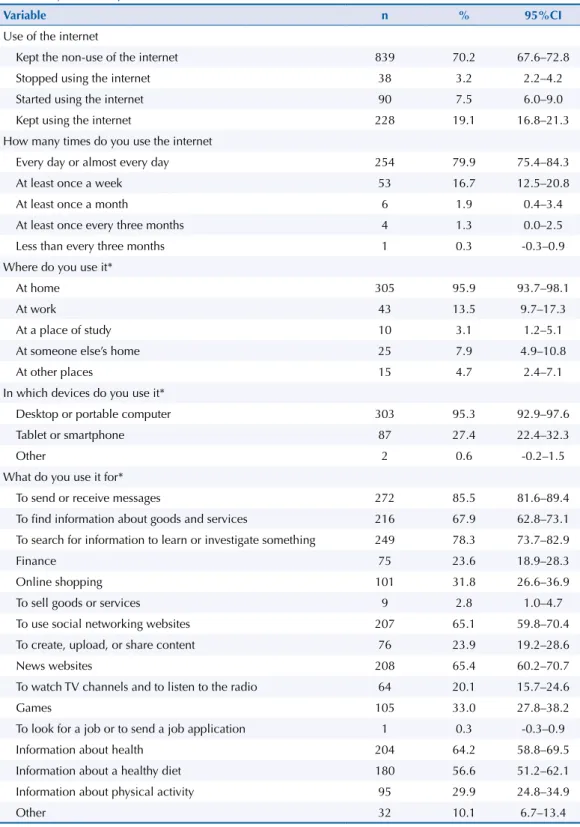
RESULTS: The prevalence of the use of internet increased from 22.9% in 2009–2010 to 26.6% in 2013–2014. Of the total number of older adults who participated in the study, 7.5% started using the internet, 3.2% stopped using it, 19.1% kept their use, and 70.2% kept their non-use in the analyzed period. Of the older adults who used the internet, most used it every day or almost every day of the week, in their own home, on desktop or portable computers, mainly to send and receive messages, to search for information to learn or investigate something, to find information about goods and services, and to use news, social networking, and health information websites. The factors associated with the use of internet over four years were: being male (RR = 2.19, 95%CI 1.48–3.26), higher monthly family income (RR = 3.53, 95%CI 1.35–9.23), higher education level (RR = 2.64, 95%CI 1.57–4.43), and no presence of caregiver (RR = 0.08, 95%CI 0.02–0.31).
CONCLUSIONS: Although the use of the internet is increasing among older adults, most of the population is still digitally excluded, especially women with lower income and education level. Strategies that promote the digital inclusion of older adults should be stimulated, aiming to universalize the use of the internet, and they should take into account socioeconomic and gender inequalities.
DESCRIPTORS: Aged. Computer Literacy. Computers, utilization. internet, utilization. Attitude to Computers. Digital Divide. Socioeconomic Factors.
Correspondence:
Rodrigo de Rosso Krug Centro de Ciências da Saúde Bloco A Sala 126 Campus Universitário Trindade
88040-410 Florianópolis, SC, Brasil E-mail: [email protected]
Received: May 2, 2017
Approved: Sep 22, 2017
How to cite: Krug RR, Xavier AJ, d’Orsi E. Factors associated with maintenance of the use of internet,
EpiFloripa Idoso longitudinal study. Rev Saude Publica. 2018;52:37.
Copyright: This is an open-access article distributed under the terms of the Creative Commons Attribution License, which permits unrestricted use, distribution, and reproduction in any medium, provided that the original author and source are credited.
INTRODUCTION
The internet is the largest global information system formed by a worldwide network of interconnected computers1. Since its creation, the internet has rapidly taken on world proportions and has been used by millions of persons, becoming central to postmodern civilization2. However, the internet has intensified the process called “digital exclusion”, that is, excluding those who do not use this technology. Generally, the most digitally excluded persons are those with the worst financial conditions, those with lower education level, and older adults3,4. With the increasing number of older adults around the world, the use of the internet by this group age must be increasingly considered5 so that they can enjoy all the benefits of this technological behavior. Older adults have been searching for computerization6; nevertheless, many still do not use the internet7. A research carried out in 2011 showed that 85% of the Brazilian older adults did not use the internet8, which decreased to 81% in 20143.
The use of the internet by older adults, in addition to providing daily benefits, can provide knowledge, social inclusion, leisure, employment9–11, greater communication with family and friends, strengthening of intergenerational relations3, health benefits11, reduced number of diseases, improved autonomy and quality of life12,13, reduced risk of impairment of the activities of daily living14, and reduced physical, mental, and socioeconomic limitations associated with aging11.
The presence of this technological behavior is one of the most effective ways to keep or improve the cognitive function12,13,15,16, which can improve creativity, knowledge acquisition, attention, execution of tasks, and other cognitive abilities17.
However, even with all the benefits that the use of the internet provides, there are still many inequalities in the access to this technology. A significant portion of the population is still digitally excluded for a variety of reasons, such as the cost of access, lack of places to access, lack of knowledge about the internet, among many other factors that worsen with increasing age3,7,18.
Thus, the knowledge about the profile of use of the internet by older adults4,6,19 and which factors may interfere in this use may help in the development of actions that stimulate the use of this tool by older adults, contributing to keeping or improving the cognitive performance, social participation, quality of life, and health of users.
Some studies6,7,19–21 have researched this subject, but none has done so with a representative sample of a city and longitudinally. Thus, the objective of this study was to describe the use of the internet and to identify the sociodemographic and health factors associated with changes in the use of the internet over a four-year period in older adults.
METHODS
Here, we report the results of the longitudinal home-based, population-based study named
EpiFloripa Idoso, with baseline in 2009-2010 and follow-up in 2013–2014.
This study was carried out with older adults (aged 60 years and over) living in the urban area of Florianópolis, State of Santa Catarina, Brazil. The sample of this study originated initially in the baseline of the research, from September 2009 to June 2010 (2009–2010 EpiFloripa Idoso).
– 2000 Census –, being 80 tracts drawn systematically, that is, eight tracts for each income decile; second stage: households). Given the availability of financial resources, it was estimated that 23 interviews should be carried out per census tract, allowing greater variability of the sample, thus amounting to 1,911 eligible individuals for the study. The final sample consisted of 1,705 older adults who were effectively interviewed (response rate of 89.1%).
In the follow-up of the study from November 2013 to November 2014 (2013–2014 EpiFloripa),
the sample was obtained from the identification of the deaths present in the database of the Mortality Information System of 2009, 2010, 2011, 2012, and 2013 of the Ministry of Health. Subsequently, letters were sent to the older adults who had full address and a telephone contact was carried out to update the recorded data. When communication was not possible, the team sought to update these data using the InfoSaúde System (Health System of Florianópolis), social
networks, phone book, and contact with neighbors, relatives, and friends. An individual under 60 years of age who was mistakenly interviewed at the baseline and an older adult erroneously recorded twice in the database were also excluded from the study.
The institutionalized older adults (nursing homes, hospitals, prisons) were excluded. The losses corresponded to older adults not located after four visits in different periods and refusals when expressed personally after home visit and attempted interview. In the follow-up, the older adults who changed cities or were hospitalized were also considered as losses. Thus, 1,197 older adults were interviewed (follow-up ratio of 70.2%).
A structured questionnaire with 276 questions was used in the baseline and a structured questionnaire with 655 questions was used in the follow-up. Validated instruments were preferably used, and all were tested in a pilot study (n = 76 older adults). Data consistency was checked weekly and quality control was performed with the application of a reduced questionnaire in approximately 10% of the interviewees, randomly selected, using the telephone. The reproducibility of the questions presented an agreement between satisfactory and good (kappa between 0.5 and 0.9). Data collection was performed with a face-to-face interview applied by previously trained interviewers with the assistance of a palm top (2009–2010) and netbook (2013–2014). The complete tools are available at www.epifloripa.ufsc.br and more information on the EpiFloripa Idoso study can be found in the study of Confortin et al.22 To describe the use of the internet, we used the variables of the questionnaire applied in 2013-2014 containing the following items: (i) Use of internet (no, yes); (ii) How often do you use the internet or email (every day or almost every day, at least once a week, at least once a month, at least once every three months, less than every three months); (iii) Where do you use it (at home, at work, at a place of study, at someone else’s home, other places); (iv) In which devices do you use it (desktop or portable computer, tablet or smartphone, others); and (v) For what purpose do you use it (to send and receive messages, to find information about goods and services, to search for information to learn or investigate something, for finance, online shopping, sales of goods or services, social networking websites, to upload or share content, for news websites, to watch TV channels and listen to the radio, for games, to look for work or send a job application, for information about health, information about healthy eating, information about physical activity, other)23.
In order to identify the sociodemographic and health factors associated with changes in the use of internet over the four-year period, the outcome variable was the use of the internet, which was longitudinally evaluated (kept the non-use of the internet, stopped using the internet, started using the internet, kept using the internet), and the independent variables were:
• Sociodemographic aspects: sex (female, male), age (in full years), per capita family income in minimum wages (MW) at the time of the interview (≤ 1 MW, 1.1–3 MW, 3.1–5 MW, 5.1–10 MW, > 10 MW), education level (0–4 years, 5–8 years, 9 years or more), family arrangement (lives with companion, lives alone), marital status (married, single, divorced, widowed), presence of caregiver (no, yes), and paid work at the time of the interview (no, yes);
from zero to 30 points24. Its classification is given by the education level; older adults are considered to have a likely cognitive impairment if they reach values lower than 19/20 points (older adults with no schooling) and values lower than 23/24 points (older adults with formal education)25. Trentini et al.26 explain that cognitive impairment has a strong relation with the worsening of the health of older adults.
The interviews were downloaded to the netbook in the csv format and subsequently exported to the statistical package Stata 11.0 (StataCorp. 2009. Stata Statistical Software: Release 11, College Station, TX: StataCorp LP), which eliminates the typing step, thus reducing the possible errors that occur during this step.
Table 1. Description of the profile of use of internet of the participants of the 2013–2014 EpiFloripa
Idoso study. Florianópolis, State of Santa Catarina, Brazil, 2014.
Variable n % 95%CI
Use of the internet
Kept the non-use of the internet 839 70.2 67.6–72.8
Stopped using the internet 38 3.2 2.2–4.2
Started using the internet 90 7.5 6.0–9.0
Kept using the internet 228 19.1 16.8–21.3
How many times do you use the internet
Every day or almost every day 254 79.9 75.4–84.3
At least once a week 53 16.7 12.5–20.8
At least once a month 6 1.9 0.4–3.4
At least once every three months 4 1.3 0.0–2.5
Less than every three months 1 0.3 -0.3–0.9
Where do you use it*
At home 305 95.9 93.7–98.1
At work 43 13.5 9.7–17.3
At a place of study 10 3.1 1.2–5.1
At someone else’s home 25 7.9 4.9–10.8
At other places 15 4.7 2.4–7.1
In which devices do you use it*
Desktop or portable computer 303 95.3 92.9–97.6
Tablet or smartphone 87 27.4 22.4–32.3
Other 2 0.6 -0.2–1.5
What do you use it for*
To send or receive messages 272 85.5 81.6–89.4
To find information about goods and services 216 67.9 62.8–73.1
To search for information to learn or investigate something 249 78.3 73.7–82.9
Finance 75 23.6 18.9–28.3
Online shopping 101 31.8 26.6–36.9
To sell goods or services 9 2.8 1.0–4.7
To use social networking websites 207 65.1 59.8–70.4
To create, upload, or share content 76 23.9 19.2–28.6
News websites 208 65.4 60.2–70.7
To watch TV channels and to listen to the radio 64 20.1 15.7–24.6
Games 105 33.0 27.8–38.2
To look for a job or to send a job application 1 0.3 -0.3–0.9
Information about health 204 64.2 58.8–69.5
Information about a healthy diet 180 56.6 51.2–62.1
Information about physical activity 95 29.9 24.8–34.9
Other 32 10.1 6.7–13.4
We considered the design effect and the sample weights in all the analyses related to this study. We evaluated the normality of the data using the Kolmogorov-Smirnov test. To describe the profile of use of the internet, we performed descriptive statistics using absolute and relative frequencies and their respective 95% confidence intervals (95%CI).
To identify the factors associated with keeping the use of internet after the four-year period in the older adults participating in the 2013–2014 EpiFloripa Idoso study, we used the
crude analysis and the analysis adjusted for multinomial logistic regression with risk ratio (RR) estimates and respective 95%CI. In the adjusted analysis, the variables that showed association with the outcome (p ≤ 0.05) were inserted into the final model.
The research project complied with ethical precepts, according to Resolution 466 of 2012, of the National Health Council, being approved by the Research Ethics Committee of the Universidade Federal de Santa Catarina (baseline under Protocol 352/2008 and Follow-up 596,126). All interviewees signed the informed consent.
RESULTS
The prevalence of use of the internet among older adults in the 2013–2014 EpiFloripa study was 26.6% (95%CI 24.1–29.1) (Table 1). Of them, 7.5% (95%CI 6.0–9.0) started using the internet in the four-year period, 3.2% (95%CI 2.2–4.2) stopped using the internet, and 19.1%
Table 2. Distribution of the percentage of sociodemographic and cognitive characteristics according to the variables of ‘kept the non-use of the internet’, ‘stopped using the internet’, ‘started using the internet’, and ‘kept the use of internet’ after the four-year period of the participants of the EpiFloripa Idoso study. Florianópolis, State of Santa Catarina, Brazil, 2014.
Variable
Kept the non-use of the internet
Stopped using the internet
Started using the internet
Kept the use of the internet % (95%CI) % (95%CI) % (95%CI) % (95%CI)
Sex
Female 72.5 (68.2–76.9) 2.7 (1.3–4.0) 8.4 (5.8–11.3) 16.4 (12.3–20.4)
Male 58.9 (50.6–67.3) 4.6 (2.2–7.1) 7.7 (4.5–10.9) 28.7 (21.5–35.9)
Family income (minimum wage)
≤ 1 90.4 (85.0–95.7) 1.4 (-0.02–3.1) 2.4 (-0.4–5.3) 6.2 (1.7–9.8)
From 1 to 3 84.9 (80.4–89.4) 3.4 (0.7–6.0) 5.5 (2.3–8.7) 6.2 (2.9–9.4) From 3 to 5 73.4 (63.3–83.5) 2.7 (0.6–4.9) 7.9 (3.8–12.1) 15.9 (6.9–24.8) From 5 to 10 63.2 (55.2–71.2) 2.7 (0.7–4.7) 10.4 (5.6–15.2) 23.6 (15.5–31.8) > 10 31.6 (25.6–37.6) 5.9 (1.0–10.7) 5.8 (17.0–9.8) 50.9 (41.6–60.2) Education level (years)
0–4 64.9 (60.2–69.7) 17.5 (12.9–22.8) 8.7 (5.6–11.8) 8.8 (5.7–11.9)
5–8 62.9 (54.9–70.9) 17.2 (11.9–22.5) 10.7 (6.0–15.3) 9.2 (4.8–13.5) 9 or more 45.2 (37.0–53.4) 15.8 (9.7–21.9) 13.7 (9.8–17.6) 25.2 (19.3–31.5) Family arrangement
With companion 68.3 (63.0–73.5) 3.2 (1.8–4.6) 8.0 (6.0–10.0) 20.5 (15.9–25.1)
Alone 64.8 (57.3–72.2) 4.0 (0.8–7.2) 8.8 (4.1–13.5) 22.4 (15.0–29.8)
Marital status
Married 63.6 (57.4–69.8) 4.2 (2.3–6.0) 74.9 (5.3–9.7) 24.7 (18.7–30.7) Single 63.2 (46.9–79.5) 1.8 (-0.8–4.5) 3.6 (0.0–7.2) 31.4 (15.1–47.6) Divorced 58.5 (46.6–70.4) 1.5 (-0.1–4.5) 9.9 (1.9–17.8) 30.0 (17.9–42.1)
Widow 77.7 (72.8–8.5) 2.7 (0.6–4.9) 9.8 (5.7–13.9) 9.8 (6.1–13.6)
Presence of caregiver
No 65.1 (60.1–70.2) 3.2 (1.8–4.5) 8.6 (6.6–10.7) 23.1 (18.2–28.0)
Yes 90.2 (82.7–97.7) 5.4 (-0.2–11.1) 3.8 (-2.2–9.8) 0.5 (-0.5–1.5)
Paid work
No 69.6 (64.9–74.2) 3.7 (1.9–5.3) 8.2 (6.2–10.2) 18.5 (14.0–23.0)
Yes 47.1 (32.2–62.1) 2.5 (-0.1–5.0) 10.8 (3.2–18.4) 39.5 (26.4–52.7)
Cognitive impairment
No 58.4 (53.0–63.8) 3.7 (1.9–5.5) 10.1 (7.7–12.5) 27.8 (22.6–32.9)
(95%CI 16.8–21.3) kept using it. However, we noticed a high prevalence of the non-use of the internet (70.2%, 95%CI 67.6–72.8). When comparing the prevalence in the two moments of the study (22.9% in 2009–2010 and 26.6% in 2013–2014), we verified that the older adults participating in the EpiFloripa Idoso study increased the use of the internet in the follow-up.
Most of the older adults who used the internet did it so every day or almost every day of the week, in their own home, on desktop or portable computers. These older adults had as their main goal the use of the internet to send and receive messages, to seek information to learn or investigate something, to find information about goods and services, and to use news, social networking, and health information websites (Table 1).
Table 2 shows the distribution of the percentage of the sociodemographic and cognitive characteristics of the older adults according to keeping the non-use of the internet, stopping using the internet, starting using the internet, and keeping using the internet after the four-year period. Most of the older adults that kept using the internet between baseline and follow-up had family income above 10 minimum wages, nine or more years of education,
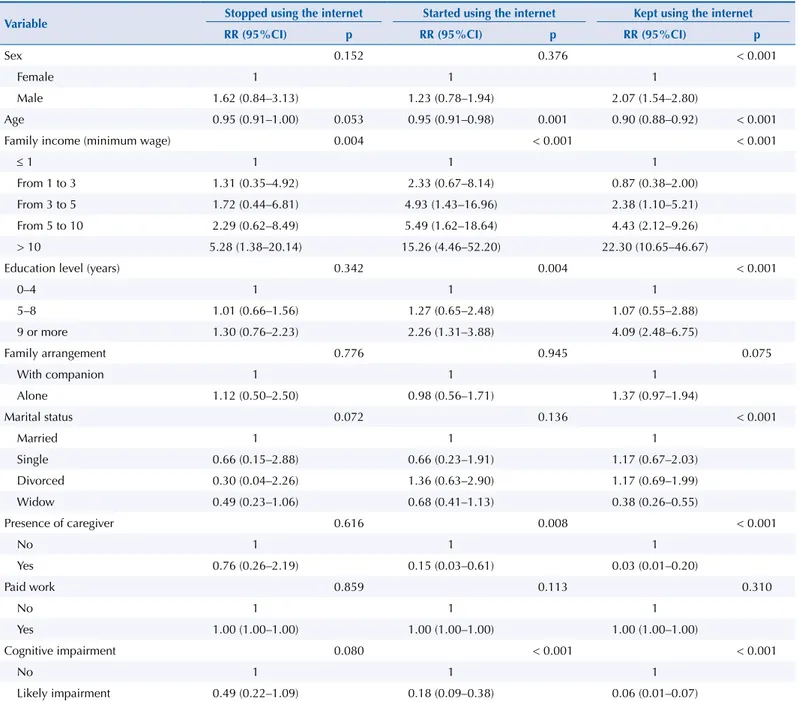
Table 3. Crude analysis of the factors associated with the variables of ‘stopped using the internet’, ‘started using the internet’, and ‘kept using the internet’ after the four-year period of the participants of the EpiFloripa Idoso study. Florianópolis, State of Santa Catarina, Brazil, 2014.
Variable Stopped using the internet Started using the internet Kept using the internet RR (95%CI) p RR (95%CI) p RR (95%CI) p
Sex 0.152 0.376 < 0.001
Female 1 1 1
Male 1.62 (0.84–3.13) 1.23 (0.78–1.94) 2.07 (1.54–2.80)
Age 0.95 (0.91–1.00) 0.053 0.95 (0.91–0.98) 0.001 0.90 (0.88–0.92) < 0.001
Family income (minimum wage) 0.004 < 0.001 < 0.001
≤ 1 1 1 1
From 1 to 3 1.31 (0.35–4.92) 2.33 (0.67–8.14) 0.87 (0.38–2.00)
From 3 to 5 1.72 (0.44–6.81) 4.93 (1.43–16.96) 2.38 (1.10–5.21)
From 5 to 10 2.29 (0.62–8.49) 5.49 (1.62–18.64) 4.43 (2.12–9.26)
> 10 5.28 (1.38–20.14) 15.26 (4.46–52.20) 22.30 (10.65–46.67)
Education level (years) 0.342 0.004 < 0.001
0–4 1 1 1
5–8 1.01 (0.66–1.56) 1.27 (0.65–2.48) 1.07 (0.55–2.88)
9 or more 1.30 (0.76–2.23) 2.26 (1.31–3.88) 4.09 (2.48–6.75)
Family arrangement 0.776 0.945 0.075
With companion 1 1 1
Alone 1.12 (0.50–2.50) 0.98 (0.56–1.71) 1.37 (0.97–1.94)
Marital status 0.072 0.136 < 0.001
Married 1 1 1
Single 0.66 (0.15–2.88) 0.66 (0.23–1.91) 1.17 (0.67–2.03)
Divorced 0.30 (0.04–2.26) 1.36 (0.63–2.90) 1.17 (0.69–1.99)
Widow 0.49 (0.23–1.06) 0.68 (0.41–1.13) 0.38 (0.26–0.55)
Presence of caregiver 0.616 0.008 < 0.001
No 1 1 1
Yes 0.76 (0.26–2.19) 0.15 (0.03–0.61) 0.03 (0.01–0.20)
Paid work 0.859 0.113 0.310
No 1 1 1
Yes 1.00 (1.00–1.00) 1.00 (1.00–1.00) 1.00 (1.00–1.00)
Cognitive impairment 0.080 < 0.001 < 0.001
No 1 1 1
Likely impairment 0.49 (0.22–1.09) 0.18 (0.09–0.38) 0.06 (0.01–0.07)
and lived alone. In addition, the prevalence of use was higher in males and among older adults who lived alone, had no caregiver, had paid work, and had no cognitive impairment.
In the crude analysis (Table 3), older adults who kept using the internet in the four-year period was associated with males, younger age, higher education level, not being a widower, no presence of a caregiver, and no cognitive impairment when compared to females, older age, being a widower, presence of a caregiver, and presence of cognitive impairment, respectively.
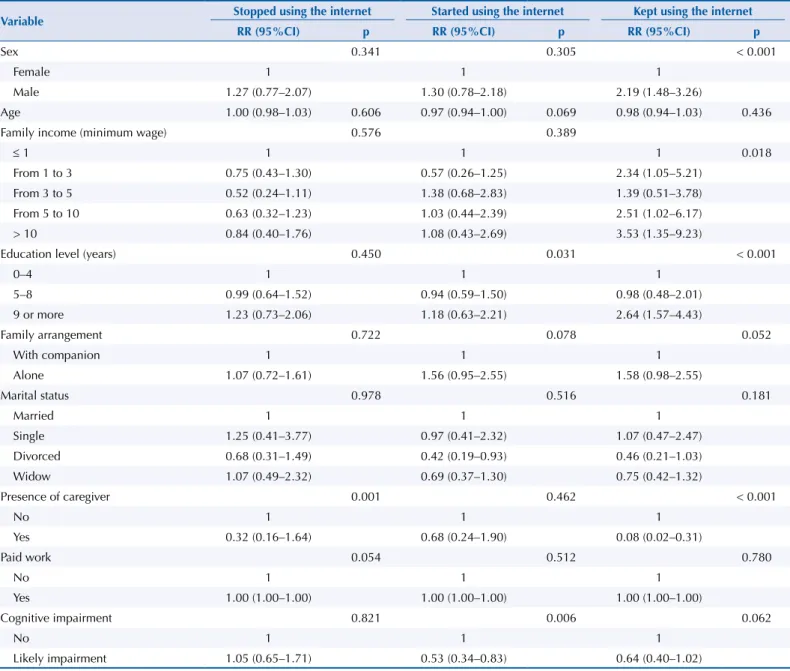
In the adjusted analysis (Table 4), the older adults who kept using the internet in the four-year period (2009–2010 to 2013–2014) were associated with sex – men were approximately twice as likely (RR = 2.19, 95%CI 1.48–3.26) to keep using the internet when compared to women; monthly family income and education level – the older adults who received more than 10 MW (RR = 3.53, 95%CI 1.35–9.23) and who had more than nine years of education (RR = 2.64, 95%CI 1.57–4.43) were more likely to keep using the internet (approximately two to three times, respectively) when compared to those with lower income and education level; and the absence of caregiver (RR = 0.08, 95%CI 0.02–0.31) – as older adults with caregivers had almost 90% less chance of having this technological behavior when compared to older adults without a caregiver.
Table 4. Adjusted analysis of the factors associated with the variables of ‘stopped using the internet’, ‘started using the internet’, and ‘kept using the internet’ after the four-year period of the participants of the EpiFloripa Idoso study. Florianópolis, State of Santa Catarina, Brazil, 2014.
Variable Stopped using the internet Started using the internet Kept using the internet RR (95%CI) p RR (95%CI) p RR (95%CI) p
Sex 0.341 0.305 < 0.001
Female 1 1 1
Male 1.27 (0.77–2.07) 1.30 (0.78–2.18) 2.19 (1.48–3.26)
Age 1.00 (0.98–1.03) 0.606 0.97 (0.94–1.00) 0.069 0.98 (0.94–1.03) 0.436
Family income (minimum wage) 0.576 0.389
≤ 1 1 1 1 0.018
From 1 to 3 0.75 (0.43–1.30) 0.57 (0.26–1.25) 2.34 (1.05–5.21)
From 3 to 5 0.52 (0.24–1.11) 1.38 (0.68–2.83) 1.39 (0.51–3.78)
From 5 to 10 0.63 (0.32–1.23) 1.03 (0.44–2.39) 2.51 (1.02–6.17)
> 10 0.84 (0.40–1.76) 1.08 (0.43–2.69) 3.53 (1.35–9.23)
Education level (years) 0.450 0.031 < 0.001
0–4 1 1 1
5–8 0.99 (0.64–1.52) 0.94 (0.59–1.50) 0.98 (0.48–2.01)
9 or more 1.23 (0.73–2.06) 1.18 (0.63–2.21) 2.64 (1.57–4.43)
Family arrangement 0.722 0.078 0.052
With companion 1 1 1
Alone 1.07 (0.72–1.61) 1.56 (0.95–2.55) 1.58 (0.98–2.55)
Marital status 0.978 0.516 0.181
Married 1 1 1
Single 1.25 (0.41–3.77) 0.97 (0.41–2.32) 1.07 (0.47–2.47)
Divorced 0.68 (0.31–1.49) 0.42 (0.19–0.93) 0.46 (0.21–1.03)
Widow 1.07 (0.49–2.32) 0.69 (0.37–1.30) 0.75 (0.42–1.32)
Presence of caregiver 0.001 0.462 < 0.001
No 1 1 1
Yes 0.32 (0.16–1.64) 0.68 (0.24–1.90) 0.08 (0.02–0.31)
Paid work 0.054 0.512 0.780
No 1 1 1
Yes 1.00 (1.00–1.00) 1.00 (1.00–1.00) 1.00 (1.00–1.00)
Cognitive impairment 0.821 0.006 0.062
No 1 1 1
Likely impairment 1.05 (0.65–1.71) 0.53 (0.34–0.83) 0.64 (0.40–1.02)
DISCUSSION
The prevalence of the use of the internet among older adults participating in the EpiFloripa Idoso study increased during the study period, going from 22.9% in the baseline to 26.6% in the follow-up. This increase in the use of the internet can be explained by the fact that older adults are now seeking to enter the virtual world6 and the current lower cost to access the internet7,20. In addition, the prevalence of the use of the internet of 26.6% can be considered expressive when compared with the Brazilian (19.0%)3 and Portuguese prevalence (20.9%)27.
Among the researched older adults who used the internet, most used this technology every day or almost every day of the week. The study of Dias19, performed with 30 Portuguese older adults (55 to 90 years old) from different municipalities has also shown that most of the older adults who use the internet often use it. Data from Cetic3 show that most of the older adults who use the internet have this behavior on a daily basis. Kachar20 reports that internet access by older adults is small, but those with such behavior use it as often as other age groups.
Another finding in our study is that the older adults studied used the internet in their own home on desktop or portable computers. Other studies3,6,19,27 have also found similar findings. The use of the internet at home is increasing because of the decreasing financial cost for the acquisition of this technology3,7,20 and the convenience of using it at home27.
Regarding the main goal for the use of the internet, most of the older adults reported using it to send and receive messages, to seek information to learn or investigate something, to find information about goods and services, to use news websites, to use social networking websites, and to search information about health. Verona et al.21, when researching 32 individuals (mean age = 68.8 years; SD = 6.9 years) from three institutions for older adults in the city of São Paulo, Brazil, have found similar data: of those who use the internet, 13.5% used to search for something, 10.2% for news, 6.8% for services in general, and 3.4% for communication with other persons.
The use of the internet to send and receive messages and to use social networks is very common for the older adults who frequently use this technology7,19. This may be because the internet is a very interesting and fast tool for communicating with family and friends who are distant19. It may also be because most older adults are socially excluded, making them seek the internet as a means to increase their participation in communication and socialization networks6,11,21. According to data from the research of Cetic3, the use of social networks and e-mail is frequent in older adults who use the internet (70% and 77%, respectively).
The search for information to learn or investigate something, to find goods and services, to research about health, and to read the news are also one of the main reasons that lead older adults to use the internet6,19. This can be explained by the convenience and ease that the internet can provide to vulnerable persons, given the difficulty that older adults may encounter to leave their homes in search for such information and services. In this sense, the internet provides access to different and useful information for these persons19,20. The use of the internet to search for information about health, besides being frequent in older adults, shows that this technological tool has an enormous potential to inform and facilitate the changes of behavior in relation to the health of this population4. In addition, the use of the internet by older adults can provide several health benefits, such as: social inclusion9–11, improved autonomy and quality of life12,13, and reduced risk of impairment of the activities of daily living14, the limitations from aging11, and the number of diseases.
In relation to the association of the use of the internet with the sociodemographic and health variables of the older adults participating in the 2013–2014 EpiFloripa Idoso study,
In addition, men are more dependent on the internet in all aspects, whether for work, for communication, or for leisure29.
Monthly family income and education level were also associated with keeping using the internet in the older adults in our study. Older adults who received more than 10 minimum wages (RR = 3.53, 95%CI 1.35–9.23) and had more than nine years of education level (RR = 2.64, 95%CI 1.57–4.43) were more likely to have this behavior when compared to their peers.
Monthly income is an important factor for access to education level and the internet7,18. Castells30 explains that older adults often cannot afford to own a computer or have access to the internet at home because they generally only receive their retirement pension. Education level is also directly related to the lower use of the internet by older adults, in which subjects with lower education levels may have more difficulty using and manipulating the computer and the internet19. In addition, the proportion of internet users increases among the population with higher education level3,18.
When low income, low education level, and increasing age are combined, the use of the internet is even more difficult, as these older adults need to be convinced that the digital world is possible, both in the financial and educational context. In this sense, public policies should be stimulated for the universalization of the access to the internet by older adults with low income and education level7. These proposals should aim to reduce the costs of the internet and the devices needed to use it (computers, tablets, smartphones, among others), and an alternative would be to unlink the internet from other services such as cable television and telephone lines. In addition, courses should also be considered to help older adults learn how to use and get to know the internet better4.
Lincoln et al.31 explain that low education level and low income are strong influencers of health problems such as low learning, loss of independence and functionality, and worsening of the quality of life.
The presence of a caregiver is also a factor associated with the use of internet in the older adults researched. The older adults without caregivers had greater chances of using the internet when compared to those who had a caregiver. This is probably because older adults who have caregivers are more likely to be dependent and incapacitated32, to have functional and cognitive problems, and, consequently, to have worse health21.
Moreover, Seima et al.33 explain that caregivers usually do not use some technologies such as smartphones, radios, televisions, computers, and the internet to dedicate themselves exclusively to the care of the older adult; with this, this caregiver ends up not influencing and not helping the older adult in the use of technologies. Given this, training courses for caregivers could explain the potential of using the internet and other technologies as possibilities for treatment and prevention of various problems arising from human aging.
The main limitations of the study were the recall bias, since the older adults may forget information, or even not know it, and the selection bias, given the non-evaluation of the older adults who were not located, the deaths, and the refusals. We suggest that qualitative research should be conducted to identify the causes that lead older adults to stop using the internet and what may influence these persons to start or keep this behavior. In addition, we suggest the development of cohort and population research studies that focus on other health variables that may influence the use of the internet by older adults. Among the positive aspects of this investigation, we highlight the design, the sample calculation, and the low proportion of selective segment loss (less than 10%).
it every day or almost every day of the week, in their own home, on desktop or portable computers, in order to send and receive messages, search for information to learn or investigate something, find information about goods and services, and use news, social networking, and health information websites. Regarding the main finding of the study, the older adults who were more likely to use the internet in the four-year period were male, had a higher monthly family income and higher education, and had no caregiver.
The data of this research can help governments, organizations, companies, private sector, and academic institutions to elaborate and monitor public policies of digital inclusion, besides aiding in the scientific knowledge on the subject, allowing the clearer understanding of the debate around the subject of digital inclusion of older adults. In addition, the use of the internet can promote the digital inclusion of older adults also helping in the use of important tools such as e-mail, news websites, banking tasks, among many others that can facilitate the daily life of older adults. Although the use of the internet is increasing among older adults, most of the population is still digitally excluded, especially women with lower income and education level. Strategies that promote the digital inclusion of older adults should be stimulated, aiming to universalize the use of the internet, and they should take into account socioeconomic and gender inequalities.
REFERENCES
1. Federal Networking Council. FNC resolution: definition of “internet”. Washington (DC); 2005 [cited 2016 Sep 19]. Available from: http://www.nitrd.gov/fnc/internet_res.html
2. Koo C, Wati Y, Lee CC, Oh HY. internet-addicted kids and South Korean Government efforts: boot-camp case.Cyberpsychol Behav Soc Netw. 2011;14(6):391-4.
https://doi.org/10.1089/cyber.2009.0331
3. Comitê Gestor da internet no Brasil. Pesquisa sobre o uso das tecnologias da informação e comunicação no Brasil – TIC Domicílios e TIC Empresas 2013. São Paulo: CGI.br; 2014 [cited 2016 Sep 19]. Available from: http://www.cetic.br/media/docs/publicacoes/2/TIC_DOM_ EMP_2013_livro_eletronico.pdf
4. Miranda LM, Farias SF. As contribuições da internet para o idoso: uma revisão de literatura. Interface (Botucatu). 2009;13(29):383-94. https://doi.org/10.1590/S1414-32832009000200011
5. Ferreira MAS, Alves VP. Representação social do idoso do Distrito Federal e sua inserção social no mundo contemporâneo a partir da internet. Rev Bras Geriatr Gerontol. 2011;14(4):699-712. https://doi.org/10.1590/S1809-98232011000400009
6. Frias MAE, Peres HHC, Paranhos WY, Leite MMJ, Prado C, Kurcgant P, et al. Utilização de ferramentas computacionais por idosos de um centro de referência e cidadania do idoso. Rev Esc Enferm USP. 2011;45 Nº Espec:1606-12.
https://doi.org/10.1590/S0080-62342011000700011
7. Sales MB, Amaral MA, Sene Junior IG, Sales AB. Tecnologias de informação e comunicação via Web: preferências de uso de um grupo de usuários idosos. Kairos. 2014 [cited 2016 Sep 19];17(3):59-77. Available from: https://revistas.pucsp.br/index.php/kairos/article/ view/21507/15756
8. Comitê Gestor da internet no Brasil. Pesquisa sobre o Uso das Tecnologias de Informação e Comunicação no Brasil: TIC Domicílios e TIC Empresas 2010. São Paulo: CGI.br; 2011 [cited 2016 Sep 19]. Available from: http://cetic.br/media/docs/publicacoes/2/tic-domicilios-e-empresas-2010.pdf
9. Galperin H, Viecens MF. Connected for development? Theory and evidence about the impact of internet technologies on poverty alleviation. Dev Policy Rev. 2017;35(3):315-36. https://doi.org/10.1111/dpr.12210
11. Paiva SB, Del-Masso MCS. Information technology as a technical resource for the memories: memories of UNATI-MARÍLIA in the virtual environment. J Info Sys Technol Man.
2013;10(2):377-88. https://doi.org/10.4301/S1807-17752013000200011
12. Ngandu T, Lehtisalo J, Solomon A, Levalahti E, Ahtiluoto S, Antikainen R, et al. Articles A 2 year multidomain intervention of diet, exercise, cognitive training, and vascular risk monitoring versus control to prevent cognitive decline in at-risk elderly people (FINGER): a randomised controlled trial. Lancet. 2015;385(9984):2255-63. https://doi.org/10.1016/S0140-6736(15)60461-5 13. Barnes DE, Santos-Modesit W, Poelke G, Kramer AF, Castro C, Middleton LE, et al. The Mental
Activity and Exercise (MAX) trial: a randomized controlled trial to enhance cognitive function in older adults. JAMA. 2013;173(9):797-804. https://doi.org/10.1001/jamainternmed.2013.189 14. Orsi E, Xavier AJ, Steptoe A, Oliveira C, Ramos LR, Orrel M, et al. Socioeconomic
and lifestyle factors related to instrumental activities of daily living dynamics: results from the English Longitudinal Study of Ageing. J Am Geriatr Soc. 2014;62(9):1630-9. https://doi.org/10.1111/jgs.12990
15. Nevalainen N, Riklund K, Andersson M, Axelsson J, Ögren M, Lövdén M, et al. COBRA: a prospective multimodal imaging study of dopamine, brain structure and function, and cognition.
Brain Res. 2015;1612:83-103. https://doi.org/10.1016/j.brainres.2014.09.010
16. Orsi E, Xavier AJ, Rafnsson SB, Steptoe A, Hogervorst E, Orrell M. Is use of the internet in midlife associated with lower dementia incidence? Results from the English Longitudinal Study of
Ageing. Aging Ment Health. 2017 Aug10:1-9. https//doi.org/10.1080/13607863.2017.1360840
17. Diamond A, Ling DS. Conclusions about interventions, programs, and approaches for improving executive functions that appear justified and those that, despite much hype, do not. Devl Cogn Neurosci. 2016;18:34-48. https://doi.org/10.1016/j.dcn.2015.11.005
18. Lolli MCGS, Martins AD, Santos SAR, Lolli LF. Uso das novas tecnologias da informação e comunicação entre idosos frequentadores da UNATI/UEM: perfil, motivações, interesses e dificuldades. Rev Teor Prat Educ. 2013 [cited 2016 Sep 19];1(1):9-15. Available from: https:// www.mastereditora.com.br/periodico/20131011_132146.pdf
19. Dias I. O uso das tecnologias digitais entre os seniores: motivações e interesses. Soc Probl Prat. 2012;(68):51-77. https://doi.org/10.7458/SPP201268693
20. Kachar V. Envelhecimento e perspectivas de inclusão digital.Kairos. 2010 [cited 2016 Sep 19];13(2):131-47. Available from: https://revistas.pucsp.br/index.php/kairos/article/ view/5371/3851
21. Verona SM, Cunha C, Pimenta GC, Buriti MA. Percepção do idoso em relação à internet. Temas Psicol. 2006 [cited 2016 Sep 19];14(2):189-97. Available from: http://pepsic.bvsalud.org/pdf/tp/ v14n2/v14n2a07.pdf
22. Confortin SC, Schneider IJC, Antes DL, Cembranel F, Ono LM, Marques LP, et al. Condições de vida e saúde de idosos: resultados do estudo de coorte EpiFloripa Idoso. Epidemiol Serv Saude. 2017;26(2):305-17. https://doi.org/10.5123/s1679-49742017000200008
23. Banks J, Nazroo J, Steptoe A. The dynamics of ageing evidence from the English Longitudinal Study of Ageing 2002-2012 (WAVE 6). London: The Institute for Fiscal Studies; 2014.
24. Bertolucci PHF, Brucki SMD, Campacci SR, Juliano Y. O Mini-Exame do Estado Mental em uma população geral: impacto da escolaridade. Arq Neuro Psiquiatr. 1994:52(1):1-7.
https://doi.org/10.1590/S0004-282X1994000100001
25. Almeida OP. Mini-Exame do Estado Mental e o diagnóstico de demência no Brasil. Arq Neuro Psiquiatr. 1998;56(3B):605-12. https://doi.org/10.1590/S0004-282X1998000400014
26. Trentini CM, Werlang BSG, Xavier FMF, Argimon IIL. A relação entre variáveis de saúde mental e cognição em idosos viúvos. Psicol Reflex Crit. 2009;22(2):236-43. https://doi.org/10.1590/S0102-79722009000200010
27. Instituto Nacional de Estatística. Estatísticas sociais. Lisboa: INE; 2010. 28. Simões MJ, Las Heras S, Augusto A. Género e tecnologias da informação e da
comunicação no espaço doméstico: não chega ter, é preciso saber, querer e poder usar.
Configuraçoes. 2011 [cited 2016 Sep 19];(8). Available from: http://journals.openedition.org/ configuracoes/831?lang=en
30. Castells M. A Galáxia internet: reflexões sobre internet, negócios e sociedade. Lisboa: Fundação Calouste Gulbenkian; 2004.
31. Lincoln P, Fenton K, Alessi C, Prince M, Brayne C, Wortmann M, et al. The Blackfriars Consensus on brain health and dementia. Lancet. 2014;383(9931):1805-6.
https://doi.org/10.1016/S0140-6736(14)60758-3
32. Uesugui HM, Fagundes DS, Pinho DLM. Perfil e grau de dependência de idosos e sobrecarga de seus cuidadores. Acta Paul Enferm. 2011;24(5):689-94. https://doi.org/10.1590/S0103-21002011000500015
33. Seima MD, Lenardt MH, Caldas CP. Relação no cuidado entre o cuidador familiar e o idoso com Alzheimer. Rev Bras Enferm. 2014;67(2):233-40. https://doi.org/10.5935/0034-7167.20140031
Funding: National Council for Scientific and Technological Development (CNPq – Process 569834/2008-2).
Authors’ Contribution: RRK has contributed with the planning and design of the study, the collection, analysis, and interpretation of the data, and the preparation and writing of the study. AJX has contributed with the planning and design of the study and the preparation, critical review, and final approval of the study. E d’Orsi has contributed with the planning and design of the study, the collection, analysis, and interpretation of the data, and the critical review and final approval of the study.