UNIVERSIDADE DA BEIRA INTERIOR
Engenharia
Airports Efficiency Evaluation Based on
MCDA and DEA Multidimensional Tools
João Pedro Fernandes Jardim
Dissertação para a obtenção do Grau de Mestre em
Engenharia Aeronáutica
(2
ºciclo de estudos)
Orientador: Prof. Doutor Jorge Miguel dos Reis Silva
v
Dedicatory
To my parents and brother, for their encouragement, faith, patience and affection, without which I could not have completed this course.
vii
Acknowledgments
Here I would leave my sincere thanks to all who showed support and help to make this Master's Thesis.
First to my family, especially my parents, grandparents, uncles and brother for their unmatched support, by the sacrifices we had to endure, and all understanding.
To Professor Jorge Miguel dos Reis Silva, who was my advisor in completing this dissertation, I thank all the sharing of knowledge, the competence and dedication, but mainly to the availability that led to this work.
Also, I thank Maria Baltazar, for all help and availability.
To all contacted entities and airport authorities, for their important support and information.
To FCT (Foundation for Science and Technology) - for the MSc grant under AIRDEV (Business Models for Airport Development and Management) Project in partnership with MIT-Portugal Program (Reference: MIT-Pt-TSAAs/0046/2008)
Finally, to my friends that with their support, accompanied me throughout this work, and showed all their friendship throughout all these last academic years.
ix
Abstract
Airport benchmarking depends on airport operational performance and efficiency indicators, which are important issues for business, operational management, regulatory agencies, airlines and passengers. There are several sets of single and complex indicators to evaluate airports efficiency as well as several techniques to benchmark such infrastructures.
The general aim of this work is the development of airport performance and efficiency predictive models using robust but flexible methodologies and incorporating simultaneously traditional indicators (number of movements and passengers, tons of cargo, number of runways and stands, area of terminals both of passenger and cargo) as well as new constraints as emerging situations and/or sudden natural phenomenon (ramp accidents and incidents, and volcano ashes and weather constraints, respectively).
Firstly this work shows the efficiency evaluation of either a set of airports or the same airport along several years and under several constraints based on two multidimensional tools, Multicriteria Decision Analysis (MCDA, particularly through Measuring Attractiveness by a Categorical Based Evaluation Technique - MACBETH) and Data Envelopment Analysis (DEA). Secondly this work compares the obtained results using both MACBETH and DEA evidencing pros and cons of each multidimensional tool and searching for the best conditions to apply one or the other within airport management decision processes.
xi
Resumo
O benchmarking de aeroportos depende de indicadores de desempenho e de eficiência operacionais que são ferramentas importantes para o negócio, a gestão operacional, as agências reguladoras, as empresas aéreas e os passageiros. Há vários conjuntos de indicadores simples e complexos para avaliar a eficiência dos aeroportos, bem como várias técnicas para efetuar o benchmark de tais infraestruturas.
O objetivo geral deste trabalho é o desenvolvimento de modelos preditivos de desempenho e eficiência aeroportuária, utilizando metodologias robustas mas flexíveis, e incorporando simultaneamente indicadores tradicionais (número de movimentos e de passageiros, toneladas de carga transportada, número de pistas e posições de estacionamento de aeronaves, área de terminais tanto de passageiros como de carga), bem como novas restrições como, por exemplo, situações emergentes e/ou fenómenos naturais súbitos (acidentes e incidentes de placa, e cinzas vulcânicas e restrições meteorológicas, respetivamente).
Em primeiro lugar este trabalho mostra a evolução da eficiência tanto de um conjunto de aeroportos como do mesmo aeroporto ao longo de vários anos e sob vários constrangimentos, com base em duas ferramentas multidimensionais, a Análise Multicritério de Apoio à Decisão (MCDA, particularmente através do MACBETH - Measuring Attractiveness by a Categorical
Based Evaluation Technique) e o DEA - Data Envelopment Analysis. Em segundo lugar este
trabalho compara os resultados obtidos usando ambas, MACBETH (MCDA) e DEA, colocando em evidência os prós e os contras de cada uma das ferramentas multidimensionais e procurando estabelecer as melhores condições para incorporar uma ou outra nos processos de decisão da gestão aeroportuária.
xiii
Table of Contents
Dedicatory ... v
Acknowledgments ... vii
Abstract ... ix
Resumo ... xi
Table of Contents ... xiii
List of Figures ... xvii
List of Tables ... xxv
List of Acronyms ... xxxi
Chapter 1 – Introduction ... 1
1.1.
Motivation... 1
1.2.
Object and Objectives ... 5
1.3.
Dissertation Structure ... 5
Chapter 2 – Benchmarking and Airport Efficiency Analysis ... 7
2.1. Introduction ... 7
2.2. Airport Benchmarking ... 7
2.3. Airport Performance and Efficiency Evaluation ... 9
2.3.1. Description and Interest ... 9
2.3.2. Methodologies to Evaluate Airport Performance and Efficiency . 10
2.3.3. Efficiency Indicators ... 12
2.3.3.1. Impact of Natural (Factors) Effects on Airports Operational
Efficiency ... 15
2.4. Conclusion ... 16
Chapter 3 – Multicriteria Decision Analysis (MCDA) and Data Envelopment
Analysis (DEA) ... 17
3.1. Introduction ... 17
3.2. Multicriteria Decision Analysis (MCDA) ... 17
3.2.1. Measuring Attractiveness by a Categorical Based Evaluation
Technique (MACBETH) ... 19
3.2.1.1 Weightening Criteria ... 23
3.3. Data Envelopment Analysis (DEA) ... 23
xiv
3.3.1.1. Software Description ... 30
3.3.1.2. Implemented Models ... 32
3.3.1.3 Comparing ISYDS with other DEA Software Packages ... 33
3.5. Conclusion ... 35
Chapter 4 – Case Studies ... 37
4.1. Introduction ... 37
4.2. Airport Ranking with DEA and MACBETH Tools ... 38
4.2.1. CASE I - Worldwide Airports Benchmarking Study ... 38
4.2.2. CASE II - European Union Airports Benchmarking Study ... 51
4.2.3. CASE III - Iberian Airports Benchmarking Study ... 62
4.2.4. CASE IV - Portuguese Airports Benchmarking Study ... 78
4.2.5. CASE V - Iberian Airports Self-Benchmarking Study ... 87
4.2.5.1. Lisbon Airport (LIS) ... 88
4.2.5.2. Porto Airport (OPO) ... 95
4.2.5.3. Faro Airport (FAO) ... 102
4.2.5.4. Madeira Airport (FNC) ... 109
4.2.5.5. Ponta Delgada Airport (PDL) ... 116
4.2.5.6. Madrid Airport (MAD) ... 123
4.2.5.7. Barcelona Airport (BCN) ... 130
4.2.5.8. Vigo Airport (VGO) ... 137
4.2.5.9. Gran Canaria Airport (LPA) ... 144
4.2.5.10. Palma de Mallorca Airport (PMI) ... 151
4.2.6. CASE VI - Madeira Airport (FNC) Self-Benchmarking Study with
Inclusion of Weather Constraints ... 158
4.3. Conclusion ... 162
Chapter 5 – Conclusions ... 165
5.1. Dissertation Synthesis ... 165
5.2. Concluding Remarks ... 166
5.3. Prospects for Future Work ... 166
References ... 169
xvii
List of Figures
Figure 1.1. – Passenger and Freight Load Factors on International Markets from 2007 to 2011 . 1
Figure 1.2. – The Three Main Worldwide Airline Alliances ... 2
Figure 1.3. – The Regional Distribution of Scheduled Passenger Trips Originating in Portugal .. 4
Figure 2.1. - Runway ... 13
Figure 2.2. – Aircraft Parking Stand ... 13
Figure 2.3. – Passenger Terminal ... 13
Figure 2.4. – Cargo Terminal ... 13
Figure 2.5. – Boarding Gates (Jetways) ... 14
Figure 2.6. – Check-in Desks ... 14
Figure 2.7. – Baggage Claim Belts ... 14
Figure 2.8. – Processed Passengers ... 14
Figure 2.9. – Aircraft Movements ... 14
Figure 2.10. – Processed Cargo ... 14
Figure 2.11. – Heavy Rain at Cancun Airport ... 15
Figure 2.12. – Volcanic Ash at San Carlos de Bariloche Airport, in Argentina, after Wind have carried the Ash from Chile's Puyehue Volcano in June 2011 ... 15
Figure 2.13. – Works on Snow Removal at La Guardia airport, New York City, during December 2010 Snowstorms ... 15
Figure 2.14. – Arrivals Board of London Heathrow Airport Terminal 5, in 16th April 2010, due to Iceland Volcano ... 16
Figure 2.15. – Affected Passengers at London Heathrow Airport, during December 2010 Snowstorms ... 16
Figure 3.1. – Benefits of MCDA ... 18
Figure 3.2. – Example of a MACBETH Decision Tree ... 20
Figure 3.3. – Example of a MACBETH Performance Table. ... 21
Figure 3.4. – Example of a MACBETH Attractiveness Table ... 21
Figure 3.5. – The Several DEA Applications that have been used in Airport Efficiency Studies. ... 24
Figure 3.6. – Efficient Frontier. ... 26
Figure 3.7. – Entry Data Format. ... 29
Figure 3.8. – ISYDS’s Open Window. ... 30
Figure 3.9. – ISYDS’s Editing Window. ... 30
Figure 3.10. – Weight Restrictions Window. ... 31
Figure 3.11. – ISYDS’s Frontier Results Window. ... 31
Figure 3.12. – ISYDS’s Efficiency Results Window. ... 32
Figure 4.1. – Developed Benchmarking and Self-Benchmarking Studies ... 37
Figure 4.2. – World Map with Indication of the Airports used in this Study ... 39
xviii
Figure 4.4. – Comparative Efficiency between DEA and DEA+ for Worldwide Airports ... 45
Figure 4.5. – Comparative Efficiency between MACBETH and MACBETH+ for Worldwide Airports ... 46
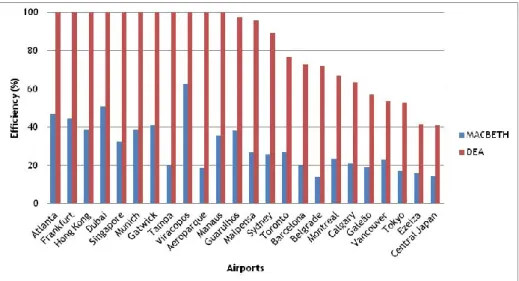
Figure 4.6. – Comparative Efficiency between MACBETH and DEA for Worldwide Airports ... 46
Figure 4.7. – Comparative Efficiency between MACBETH+ and DEA+ for Worldwide Airports 47 Figure 4.8. – Worldwide Airports Comparative Efficiency for All Cases ... 47
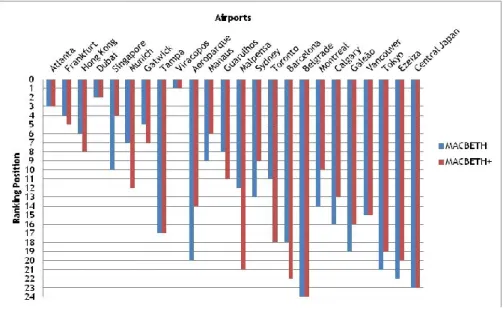
Figure 4.9. – Balance between MACBETH and MACBETH+ Rankings for Worldwide Airports ... 48
Figure 4.10. – Balance between DEA and DEA+ Rankings for Worldwide Airports ... 48
Figure 4.11. – Balance between MACBETH and DEA Rankings for Worldwide Airports ... 49
Figure 4.12. – Balance between MACBETH+ and DEA+ Rankings for Worldwide Airports ... 49
Figure 4.13. – Worldwide Airports Comparative Ranking for All Cases ... 50
Figure 4.14. – Europe Map with Indication of the Airports used in this Study. ... 51
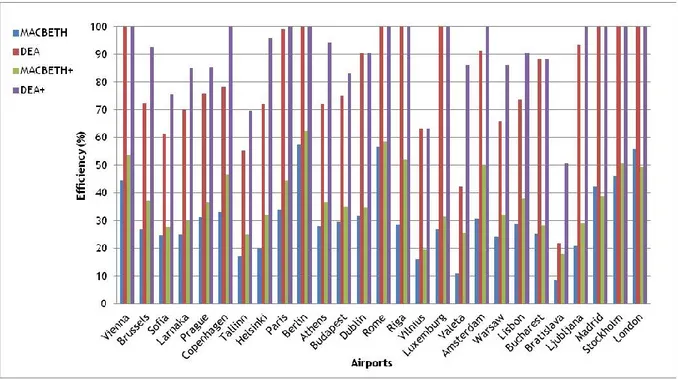
Figure 4.15. – Comparative Efficiency between DEA and DEA+ for European Airports ... 57
Figure 4.16. – Comparative Efficiency between MACBETH and MACBETH+ for European Airports ... 57
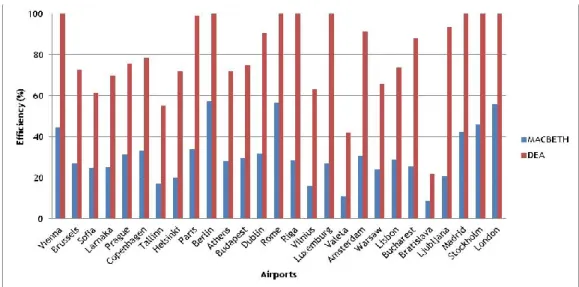
Figure 4.17. – Comparative Efficiency between MACBETH and DEA for European Airports .... 58
Figure 4.18. – Comparative Efficiency between MACBETH+ and DEA+ for European Airports . 58 Figure 4.19. – European Airports Comparative Efficiency for All Cases ... 59
Figure 4.20. – Balance between MACBETH and MACBETH+ Rankings for European Airports ... 59
Figure 4.21. – Balance between DEA and DEA+ Rankings for European Airports ... 60
Figure 4.22. – Balance between MACBETH and DEA Rankings for European Airports ... 60
Figure 4.23. – Balance between MACBETH+ and DEA+ Rankings for European Airports ... 61
Figure 4.24. – European Airports Comparative Ranking for All Cases ... 61
Figure 4.25. – Map with Indication of the Iberian Airports used in this Study. ... 62
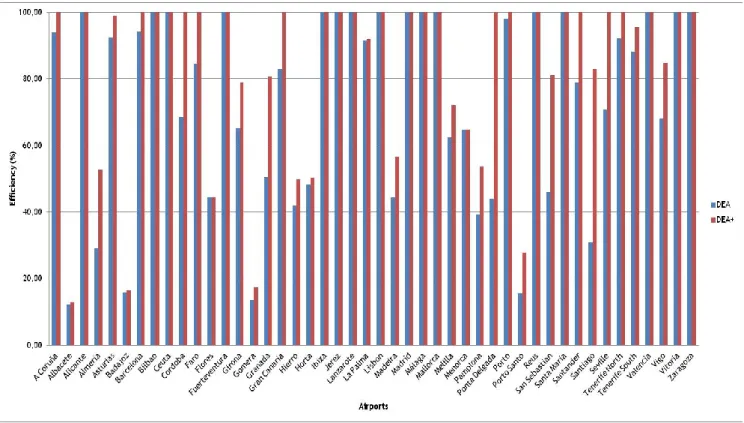
Figure 4.26. – Comparative Efficiency between DEA and DEA+ for Iberian Airports ... 68
Figure 4.27. – Comparative Efficiency between MACBETH and MACBETH+ for Iberian Airports ... 69
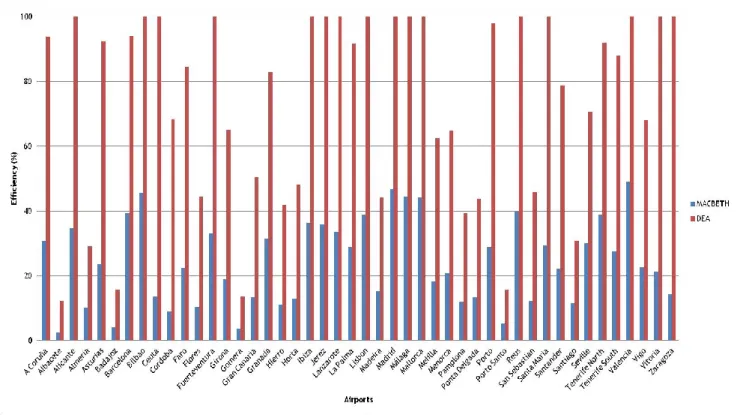
Figure 4.28. – Comparative Efficiency between MACBETH and DEA for Iberian Airports ... 70
Figure 4.29. – Comparative Efficiency between MACBETH+ and DEA+ for Iberian Airports .... 71
Figure 4.30. – Iberian Airports Comparative Efficiency for All Cases ... 72
Figure 4.31. – Balance between MACBETH and MACBETH+ Rankings for Iberian Airports ... 73
Figure 4.32. – Balance between DEA and DEA+ Rankings for Iberian Airports ... 74
Figure 4.33. – Balance between MACBETH and DEA Rankings for Iberian Airports ... 75
Figure 4.34. – Balance between MACBETH+ and DEA+ Rankings for Iberian Airports ... 76
Figure 4.35. – Iberian Airports Comparative Ranking for All Cases ... 77
Figure 4.36. – Map of the Portuguese Airports used in this Study. ... 78
Figure 4.37. – Comparative Efficiency between DEA and DEA+ for Portuguese Airports ... 81
Figure 4.38. – Comparative Efficiency between MACBETH and MACBETH+ for Portuguese Airports ... 82 Figure 4.39. – Comparative Efficiency between MACBETH and DEA for Portuguese Airports . 82
xix Figure 4.40. – Comparative Efficiency between MACBETH+ and DEA+ for Portuguese Airports
... 83
Figure 4.41. – Portuguese Airports Comparative Efficiency for All Cases ... 84
Figure 4.42. – Balance between MACBETH and MACBETH+ Rankings for Portuguese Airports . 84 Figure 4.43. – Balance between DEA and DEA+ Rankings for Portuguese Airports . ... 85
Figure 4.44. – Balance between MACBETH and DEA Rankings for Portuguese Airports ... 85
Figure 4.45. – Balance between MACBETH+ and DEA+ Rankings for Portuguese Airports ... 86
Figure 4.46. – Portuguese Airports Comparative Ranking for All Cases ... 86
Figure 4.47. – Map of the Iberian Airports used in this Study ... 87
Figure 4.48. – Lisbon Airport ... 88
Figure 4.49. – Comparative Efficiency between DEA and DEA+ for Lisbon Airport ... 90
Figure 4.50. – Comparative Efficiency between MACBETH and MACBETH+ for Lisbon Airport . 90 Figure 4.51. – Comparative Efficiency between MACBETH and DEA for Lisbon Airport ... 91
Figure 4.52. – Comparative Efficiency between MACBETH+ and DEA+ for Lisbon Airport ... 91
Figure 4.53. – Lisbon Airport Comparative Efficiency for All Cases ... 92
Figure 4.54. – Balance between MACBETH and MACBETH+ Rankings for Lisbon Airport ... 92
Figure 4.55. – Balance between DEA and DEA+ Rankings for Lisbon Airport ... 93
Figure 4.56. – Balance between MACBETH and DEA Rankings for Lisbon Airport ... 93
Figure 4.57. – Balance between MACBETH+ and DEA+ Rankings for Lisbon Airport ... 94
Figure 4.58. – Lisbon Airport Comparative Ranking for All Cases ... 94
Figure 4.59. – Porto Airport ... 95
Figure 4.60. – Comparative Efficiency between DEA and DEA+ for Porto Airport ... 97
Figure 4.61. – Comparative Efficiency between MACBETH and MACBETH+ for Porto Airport .. 97
Figure 4.62. – Comparative Efficiency between MACBETH and DEA for Porto Airport ... 98
Figure 4.63. – Comparative Efficiency between MACBETH+ and DEA+ for Porto Airport ... 98
Figure 4.64. – Porto Airport Comparative Efficiency for All Cases ... 99
Figure 4.65. – Balance between MACBETH and MACBETH+ Rankings for Porto Airport ... 99
Figure 4.66. – Balance between DEA and DEA+ Rankings for Porto Airport . ... 100
Figure 4.67. – Balance between MACBETH and DEA Rankings for Porto Airport ... 100
Figure 4.68. – Balance between MACBETH+ and DEA+ Rankings for Porto Airport ... 101
Figure 4.69. – Porto Airport Comparative Ranking for All Cases ... 101
Figure 4.70. – Faro Airport ... 102
Figure 4.71. – Comparative Efficiency between DEA and DEA+ for Faro Airport ... 104
Figure 4.72. – Comparative Efficiency between MACBETH and MACBETH+ for Faro Airport .. 104
Figure 4.73. – Comparative Efficiency between MACBETH and DEA for Faro Airport ... 105
Figure 4.74. – Comparative Efficiency between MACBETH+ and DEA+ for Faro Airport ... 105
Figure 4.75. – Faro Airport Comparative Efficiency for All Cases ... 106
Figure 4.76. – Balance between MACBETH and MACBETH+ Rankings for Faro Airport ... 106
Figure 4.77. – Balance between DEA and DEA+ Rankings for Faro Airport . ... 107
xx
Figure 4.79. – Balance between MACBETH+ and DEA+ Rankings for Faro Airport ... 108
Figure 4.80. – Faro Airport Comparative Ranking for All Cases ... 108
Figure 4.81. – Madeira Airport ... 109
Figure 4.82. – Comparative Efficiency between DEA and DEA+ for Madeira Airport ... 111
Figure 4.83. – Comparative Efficiency between MACBETH and MACBETH+ for Madeira Airport ... 111
Figure 4.84. – Comparative Efficiency between MACBETH and DEA for Madeira Airport ... 112
Figure 4.85. – Comparative Efficiency between MACBETH+ and DEA+ for Madeira Airport ... 112
Figure 4.86. – Madeira Airport Comparative Efficiency for All Cases ... 113
Figure 4.87. – Balance between MACBETH and MACBETH+ Rankings for Madeira Airport ... 113
Figure 4.88. – Balance between DEA and DEA+ Rankings for Madeira Airport . ... 114
Figure 4.89. – Balance between MACBETH and DEA Rankings for Madeira Airport ... 114
Figure 4.90. – Balance between MACBETH+ and DEA+ Rankings for Madeira Airport ... 115
Figure 4.91. – Madeira Airport Comparative Ranking for All Cases ... 115
Figure 4.92. – Ponta Delgada Airport ... 116
Figure 4.93. – Comparative Efficiency between DEA and DEA+ for Ponta Delgada Airport ... 118
Figure 4.94. – Comparative Efficiency between MACBETH and MACBETH+ for Ponta Delgada Airport ... 118
Figure 4.95. – Comparative Efficiency between MACBETH and DEA for Ponta Delgada Airport ... 119
Figure 4.96. – Comparative Efficiency between MACBETH+ and DEA+ for Ponta Delgada Airport ... 119
Figure 4.97. – Ponta Delgada Airport Comparative Efficiency for All Cases ... 120
Figure 4.98. – Balance between MACBETH and MACBETH+ Rankings for Ponta Delgada Airport ... 120
Figure 4.99. – Balance between DEA and DEA+ Rankings for Ponta Delgada Airport . ... 121
Figure 4.100. – Balance between MACBETH and DEA Rankings for Ponta Delgada Airport .... 121
Figure 4.101. – Balance between MACBETH+ and DEA+ Rankings for Ponta Delgada Airport . 122 Figure 4.102. – Ponta Delgada Airport Comparative Ranking for All Cases ... 122
Figure 4.103. – Madrid Airport ... 123
Figure 4.104. – Comparative Efficiency between DEA and DEA+ for Madrid Airport ... 125
Figure 4.105. – Comparative Efficiency between MACBETH and MACBETH+ for Madrid Airport ... 125
Figure 4.106. – Comparative Efficiency between MACBETH and DEA for Madrid Airport ... 126
Figure 4.107. – Comparative Efficiency between MACBETH+ and DEA+ for Madrid Airport ... 126
Figure 4.108. – Madrid Airport Comparative Efficiency for All Cases ... 127
Figure 4.109. – Balance between MACBETH and MACBETH+ Rankings for Madrid Airport ... 127
Figure 4.110. – Balance between DEA and DEA+ Rankings for Madrid Airport . ... 128
Figure 4.111. – Balance between MACBETH and DEA Rankings for Madrid Airport ... 128
xxi
Figure 4.113. – Madrid Airport Comparative Ranking for All Cases ... 129
Figure 4.114. – Barcelona Airport ... 130
Figure 4.115. – Comparative Efficiency between DEA and DEA+ for Barcelona Airport ... 132
Figure 4.116. – Comparative Efficiency between MACBETH and MACBETH+ for Barcelona Airport ... 132
Figure 4.117. – Comparative Efficiency between MACBETH and DEA for Barcelona Airport .. 133
Figure 4.118. – Comparative Efficiency between MACBETH+ and DEA+ for Barcelona Airport ... 133
Figure 4.119. – Barcelona Airport Comparative Efficiency for All Cases ... 134
Figure 4.120. – Balance between MACBETH and MACBETH+ Rankings for Barcelona Airport . 134 Figure 4.121. – Balance between DEA and DEA+ Rankings for Barcelona Airport ... 135
Figure 4.122. – Balance between MACBETH and DEA Rankings for Barcelona Airport ... 135
Figure 4.123. – Balance between MACBETH+ and DEA+ Rankings for Barcelona Airport ... 136
Figure 4.124. – Barcelona Airport Comparative Ranking for All Cases ... 136
Figure 4.125. – Vigo Airport ... 137
Figure 4.126. – Comparative Efficiency between DEA and DEA+ for Vigo Airport ... 139
Figure 4.127. – Comparative Efficiency between MACBETH and MACBETH+ for Vigo Airport . 139 Figure 4.128. – Comparative Efficiency between MACBETH and DEA for Vigo Airport ... 140
Figure 4.129. – Comparative Efficiency between MACBETH+ and DEA+ for Vigo Airport ... 140
Figure 4.130. – Vigo Airport Comparative Efficiency for All Cases ... 141
Figure 4.131. – Balance between MACBETH and MACBETH+ Rankings for Vigo Airport ... 141
Figure 4.132. – Balance between DEA and DEA+ Rankings for Vigo Airport ... 142
Figure 4.133. – Balance between MACBETH and DEA Rankings for Vigo Airport ... 142
Figure 4.134. – Balance between MACBETH+ and DEA+ Rankings for Vigo Airport ... 143
Figure 4.135. – Vigo Airport Comparative Ranking for All Cases ... 143
Figure 4.136. – Gran Canaria Airport ... 144
Figure 4.137. – Comparative Efficiency between DEA and DEA+ for Gran Canaria Airport ... 146
Figure 4.138. – Comparative Efficiency between MACBETH and MACBETH+ for Gran Canaria Airport ... 146
Figure 4.139. – Comparative Efficiency between MACBETH and DEA for Gran Canaria Airport ... 147
Figure 4.140. – Comparative Efficiency between MACBETH+ and DEA+ for Gran Canaria Airport ... 147
Figure 4.141. – Gran Canaria Airport Comparative Efficiency for All Cases ... 148
Figure 4.142. – Balance between MACBETH and MACBETH+ Rankings for Gran Canaria Airport ... 148
Figure 4.143. – Balance between DEA and DEA+ Rankings for Gran Canaria Airport ... 149
Figure 4.144. – Balance between MACBETH and DEA Rankings for Gran Canaria Airport ... 149
Figure 4.145. – Balance between MACBETH+ and DEA+ Rankings for Gran Canaria Airport .. 150
xxii
Figure 4.147. – Palma de Mallorca Airport ... 151 Figure 4.148. – Comparative Efficiency between DEA and DEA+ for Palma de Mallorca Airport ... 153 Figure 4.149. – Comparative Efficiency between MACBETH and MACBETH+ for Palma de Mallorca Airport ... 153 Figure 4.150. – Comparative Efficiency between MACBETH and DEA for Palma de Mallorca Airport ... 154 Figure 4.151. – Comparative Efficiency between MACBETH+ and DEA+ for Palma de Mallorca Airport ... 154 Figure 4.152. – Palma de Mallorca Airport Comparative Efficiency for All Cases ... 155 Figure 4.153. – Balance between MACBETH and MACBETH+ Rankings for Palma de Mallorca Airport ... 155 Figure 4.154. – Balance between DEA and DEA+ Rankings for Palma de Mallorca Airport .... 156 Figure 4.155. – Balance between MACBETH and DEA Rankings for Palma de Mallorca Airport ... 156 Figure 4.156. – Balance between MACBETH+ and DEA+ Rankings for Palma de Mallorca Airport ... 157 Figure 4.157. – Palma de Mallorca Airport Comparative Ranking for All Cases ... 157 Figure 4.158. – Madeira (FNC) DEA Case Comparative Efficiency ... 160 Figure 4.159. – Madeira (FNC) MACBETH Case Comparative Efficiency ... 160 Figure 4.160. – Comparative Efficiency for all Madeira Case Studies ... 160 Figure 4.161. – FNC Ranking Balance for DEA Case Studies ... 161 Figure 4.162. – FNC Ranking Balance for MACBETH Case Studies ... 161 Figure 4.163. – Balance between Madeira MACBETH and DEA Rankings ... 161
xxv
List of Tables
Table 1 – Airport Performance Evaluation based on Different Methods . ... 11 Table 2 – Single and Complex Indicators . ... 13 Table 3 – Some DEA Software Packages. ... 33 Table 4 – Worldwide Airport Data . ... 40 Table 5 – Analysis in Each One of the Case Studies . ... 41 Table 6 – Complex Indicators for a Set of Worldwide Airports . ... 42 Table 7 – Complex Indicators Weights for MACBETH study cases. ... 42 Table 8 – Worldwide Airports Scores for MACBETH Study Case. ... 43 Table 9 – Worldwide Airports Scores for MACBETH+ Study Case... 44 Table 10 – Efficiency Ranking for Worldwide Airports in the Four Cases. ... 45 Table 11 – European Airport Data . ... 52 Table 12 – Complex Indicators for European Airports . ... 53 Table 13 – European Airports Scores for MACBETH Study Case. ... 54 Table 14 – European Airport Scores for MACBETH+ Study Case. ... 55 Table 15 – Efficiency Ranking for European Airports in the Four Cases. ... 56 Table 16 – Iberian Airport Data . ... 63 Table 17 – Complex Indicators for Iberian Airports . ... 64 Table 18 – Iberian Airports Scores for MACBETH Study Case. ... 65 Table 19 – Iberian Airport Scores for MACBETH+ Study Case. ... 66 Table 20 – Efficiency Ranking for Iberian Airports in the Four Cases. ... 67 Table 21 – Portuguese Airports Data . ... 79 Table 22 – Complex Indicators for Portuguese Airports . ... 79 Table 23 – Portuguese Airports Scores for MACBETH Study Case. ... 80 Table 24 – Portuguese Airport Scores for MACBETH+ Study Case. ... 80 Table 25 – Efficiency Ranking for Portuguese Airports in the Four Cases. ... 81 Table 26 – Lisbon Airport Data . ... 88 Table 27– Complex Indicators for Lisbon Airport ... 89 Table 28 – Lisbon Airport Scores for MACBETH Study Case. ... 89 Table 29 – Lisbon Airport Scores for MACBETH+ Study Case... 89 Table 30 – Efficiency Ranking for Lisbon Airport in the Four Cases. ... 90 Table 31 – Porto Airport Data . ... 95 Table 32 – Complex Indicators for Porto Airport ... 96 Table 33 – Porto Airport Scores for MACBETH Study Case. ... 96 Table 34 – Porto Airport Scores for MACBETH+ Study Case. ... 96 Table 35 – Efficiency Ranking for Porto Airport in the Four Cases. ... 97 Table 36 – Faro Airport Data . ... 102 Table 37 – Complex Indicators for Faro Airport ... 103 Table 38 – Faro Airport Scores for MACBETH Study Case. ... 103
xxvi
Table 39 – Faro Airport Scores for MACBETH+ Study Case. ... 103 Table 40 – Efficiency Ranking for Faro Airport in the Four Cases. ... 104 Table 41 – Madeira Airport Data . ... 109 Table 42 – Complex Indicators for Madeira Airport ... 110 Table 43 – Madeira Airport Scores for MACBETH Study Case. ... 110 Table 44 – Madeira Airport Scores for MACBETH+ Study Case. ... 110 Table 45 – Efficiency Ranking for Madeira Airport in the Four Cases. ... 111 Table 46 – Ponta Delgada Airport Data . ... 116 Table 47 – Complex Indicators for Ponta Delgada Airport ... 117 Table 48 – Ponta Delgada Airport Scores for MACBETH Study Case. ... 117 Table 49 – Ponta Delgada Airport Scores for MACBETH+ Study Case. ... 117 Table 50 – Efficiency Ranking for Ponta Delgada Airport in the Four Cases. ... 118 Table 51 – Madrid Airport Data . ... 123 Table 52 – Complex Indicators for Madrid Airport ... 124 Table 53 – Madrid Airport Scores for MACBETH Study Case. ... 124 Table 54 – Madrid Airport Scores for MACBETH+ Study Case. ... 124 Table 55 – Efficiency Ranking for Madrid Airports in the Four Cases. ... 125 Table 56 – Barcelona Airport Data . ... 130 Table 57 – Complex Indicators for Barcelona Airport ... 131 Table 58 – Barcelona Airport Scores for MACBETH Study Case. ... 131 Table 59 – Barcelona Airport Scores for MACBETH+ Study Case. ... 131 Table 60 – Efficiency Ranking for Barcelona Airports in the Four Cases. ... 132 Table 61 – Vigo Airport Data . ... 137 Table 62 – Complex Indicator for Vigo Airport ... 138 Table 63 – Vigo Airport Scores for MACBETH Study Case. ... 138 Table 64 – Vigo Airport Scores for MACBETH+ Study Case. ... 138 Table 65 – Efficiency Ranking for Vigo Airports in the Four Cases. ... 139 Table 66 – Gran Canaria Airport Data . ... 144 Table 67 – Complex Indicators for Gran Canaria Airport ... 145 Table 68 – Gran Canaria Airport Scores for MACBETH Study Case... 145 Table 69 – Gran Canaria Airport Scores for MACBETH+ Study Case. ... 145 Table 70 – Efficiency Ranking for Gran Canaria Airport in the Four Cases. ... 146 Table 71 – Palma de Mallorca Airport Data . ... 151 Table 72 – Complex Indicators for Palma de Mallorca Airport ... 152 Table 73 – Palma de Mallorca Airport Scores for MACBETH Study Case. ... 152 Table 74 – Palma de Mallorca Airport Scores for MACBETH+ Study Case. ... 152 Table 75 – Efficiency Ranking for Palma de Mallorca Airport in the Four Cases. ... 153 Table 76 – Madeira Airport Data 2007-2011. ... 158 Table 77 – Complex Indicators for Madeira Airport (FNC). ... 159 Table 78 – Complex Indicators Weight for MACBETH++ Case Study. ... 159
xxvii Table 79 – Madeira Airport Scores for MACBETH++ Study Case ... 159 Table 80 – Madeira Airport Positions in the Efficiency Rankings for the Six Cases ... 160
xxxi
List of Acronyms
AFTK - Available Freight Tonne Kilometers: the measure of a flight’s freight carrying capacity. Calculated by multiplying the number of tonnes of freight on an aircraft by the distance travelled in kilometers. Used to measure an airline’s capacity to transport freight
AHP – Analytic Hierarchy Process Apron – Airport Ramp
ASK - Available Seat Kilometers: the measure of a flight’s passenger carrying capacity. Calculated by multiplying the number of seats on an aircraft by the distance travelled in kilometers. Used to measure an airline’s capacity to transport passengers
ATM – Air Traffic Management BCC – Banker, Charnes and Cooper CCR – Charnes, Cooper and Rhodes CRS – Constant Return to Scale DEA – Data Envelopment Analysis
DEAP – Data Envelopment Analysis (Computer) Program DMU – Decision Making Unit
ELECTRE – Elimination and Choice Expressing Reality EMS – Efficiency Measurement System
EU – European Union FDH - Free Disposal Hull
xxxii
IDEAL – Interactive Data Envelopment Analysis Laboratory ISYDS – Integrated Decision Support System
km – kilometers
LPP – Linear Programming Problem m2 – square meters
MACBETH - Measuring Attractiveness by a Categorical Based Evaluation Technique MARS - Multiple Aircraft Ramp System
MAUT – Multi-Attribute Utility Theory MCDA – Multicriteria Decision Analysis MCDM – Multi Criteria Decision Making mi – miles
PC – Principle Components
PCA - Principal Component Analysis
PROMETHÉE – Ranking Organization Method for Enrichment of Evaluations SBM - Slacks-Based Measure
SFA - Stochastic Frontier Analysis
SMOP – Surface Measure of Overall Performance TFP - Total Factor Productivity
TODIM – Tomada de Decisão Interativa Multicritério (Interactive Multicriteria Decision Making)
Ton – tone
xxxiii
IATA code AIRPORT
ABC Albacete
ACE Lanzarote
AEP Buenos Aires - Aeroparque AGP Malaga – Costa del Sol
ALC Alicante
AMS Amesterdam - Schipol ARN Stockholm - Arlanda ATH Athens – Eleftherios Venizelos
ATL Atlanta
BCN Barcelona – El Prat BEG Belgrade – Nikola Tesla
BIO Bilbao
BJZ Badajoz
BRU Brussels - National
BTS Bratislava
BUD Budapest
CDG Paris Charles de Gaulle CPH Copenhagen Kastrup
DUB Dublin
DXB Dubai
EAS San Sebastian EZE Buenos Aires - Ezeiza
FAO Faro
FCO Roma - Fiumicino
FLW Flores
FNC Madeira
FRA Frankfurt - Main FUE Fuerteventura
GIG Rio de Janeiro - Galeão
GMZ La Gomera
GRO Girona
GRU São Paulo - Guarulhos
GRX Granada
HEL Helsinki - Vantaa
HKG Hong Kong
HOR Horta
IBZ Ibiza
JCU Ceuta Heliport
LCA Larnaka LCG A Coruña LEI Almeria LGW Gatwick LHR London Heathrow LIS Lisbon LJU Ljubljana
LPA Gran Canaria
LUX Luxemburg
IATA code AIRPORT
MAD Madrid - Barajas
MAH Menorca
MAO Manaus
MLA Malta - Valeta Luqa
MLN Melilla
MUC Munich
MXP Milan - Malpensa NGO Central Japan NRT Tóquio - Narita
ODB Cordoba
OPO Porto
OTP Bucarest - Henri Coanda
OVD Asturias
PDL Ponta Delgada PMI Palma de Mallorca
PNA Pamplona
PRG Prague Ruzyne
PXO Porto Santo
REU Reus
RIX Riga
SCQ Santiago de Compostela
SDR Santander
SIN Singapore - Changi
SMA Santa Maria
SOF Sofia
SPC La Palma
SVQ Seville
SYD Sydney - Kingsford Smith TFN Tenerife Norte - Los Rodeos TFS Tenerife Sul - Reina Sofia
TLL Tallinn TPA Tampa TXL Berlin - Tegel VCP Campinas - Viracopos VDE El Hierro VGO Vigo
VIE Vienna Schwechat
VIT Vitoria
VLC Valencia
VNO Vilnius
WAW Warsaw Chopin XRY Jerez de la Frontera YUL Montreal - Trudeau
YVR Vancouver
YYC Calgary
YYZ Toronto - Pearson
1
Chapter 1 – Introduction
1.1. Motivation
Nowadays the airport business is in rapidly change since have been a consistent growth segment in the travel and transportation industry, over the last several decades. The annual growth of global aviation industry has sustained rates of five to six percent (Graham, 2003). More than 5 billion passengers passed through the world’s airports in 2010 (Airports Council International, 2010). However, due to economic downturn, demand for air transport slowed in recent years (Fodness and Murray, 2005). The jet fuel prices and credit crisis have also a negative impact on consumers and consequently in number of air travelers. However, new business models adopted by airlines allowed some growth return in the last years, as the case of low-cost carriers, being a major proportion of the business volume generated by the airports.
Figure 1.1 presents the Passenger load and Freight load factors on International markets from 2007 to 2011.
Figure 1.1: Passenger and Freight Load Factors on International Markets from 2007 to 2011 (Centre for Aviation, 2011)
It’s possible to see the economic impact on aviation, of the several crisis parameters described before, in which 2009 was the worst year. The Passenger Load Factor decreased below 74% of ASK, while Freight load factor had a decrease to 72% of AFTK. After this decrease in 2008/2009, the same values presented a high increase, but with a tendency to stabilize, now mainly due to the actual economic slowdown in the euro zone and the U.S.A, mainly world business centers, despite Asian market growth.
2
Over the last few years, challenges that faced airlines and the aviation industry, has forced to rethink how they do business on both at financial and at operational level. In order to face up to these challenges and as a result, most airlines have been remarkably successful at turning around ailing companies, in many cases completely reinventing themselves. Airlines are now in a much stronger position then 2000, due to unprecedented demand for air travel, although high fuel prices are affecting profitability (The Institute of Transport Management, 2012). One of the current situations, in order to minimize negative impacts from markets on airlines, is the creation of alliances or airline groups, allowing a greater flow of air transport network, as well as it extension.
Figure 1.2 presents the three main worldwide airline alliances (Rederer, 2010).
Figure 1.2: The Three Main Worldwide Airline Alliances (Adapted from Rederer, 2010) Therefore, we are in a different economic era, where aviation, international markets and time-based competition predominate. This new era reveals the introduction of large, high speed jet airplanes, advanced telecommunication technologies, and three aspects of immense significance, namely (Marques and Galves, 2009):
The business transactions globalization;
The shift to just-in-time manufacturing and inventory control methods; and, as a result of the first two;
The growing requirement of industries of all types to ship products quickly by air to distant costumers.
World air cargo traffic had / will have a significant growth between 2000 to 2020, with international air express growing three times faster. Much of the freight will continue to be shipped in the passenger planes, with some Boeing 747’s carrying as much as 35 tons of cargo
3 together with passenger loads and the new Airbus A380-900 much more. As a result of those aspects mentioned above, the role and development of major airports are changing dramatically. To fully leverage airport’s new role as multimodal commercial centers, and attracting businesses, planners and developers have been an important and challenging position, since airports are no longer just airports. These platforms have become not only nodes of a new intermodal transport system for both people and goods, but also new cities, in a big worldwide competition (Marques and Galves, 2009).
Another important aspect, as presented by (Oum et al., 2003) is the liberalization of the airline industry worldwide. It has increased the demand for more efficient and faster processing of aircraft, passengers, cargo and baggage. Airlines have freedom of choose where they will base their domestic hubs and which airports they will use to route their connecting traffic, as the continental markets in Europe, North America and Asia become even more competitive. The most efficient airports are chosen by air carriers to allocate and expand operations, so as to improve quality of services and reduce their costs. Airport managers are being confronted with new challenges every day, in an era of growing commercial pressures. Thus, it is important for airports to provide the services in the most efficient manner. To do this, airports need to know the best practices over airport operations several dimensions within the industry practices.
In the Portuguese case, the aviation sector comprises the airlines and airports together with air navigation and other essential ground services that make up the air transport infrastructure. The sector is divided in two distinct types of activity (Oxford Economics, 2011):
Airlines: transporting passengers and cargo;
Ground-based infrastructure: includes the airport facilities, the services provided for passengers on-site at airports (baggage handling, ticketing and retail) and catering services, together with essential provided services, such as air navigation and air regulation.
The most important airports in Portugal – Lisbon (LIS), Faro (FAO), Porto (OPO), Madeira (FNC), Porto Santo (PXO), Ponta Delgada (PDL), Santa Maria (SMA), Horta (HOR) and Flores (FLW) - carried in 2011 over than 30 million passengers, more than 280,000 aircraft movements and nearly 144,000 tonnes of air freight too, from and within Portugal (ANA/ANAM, 2011).
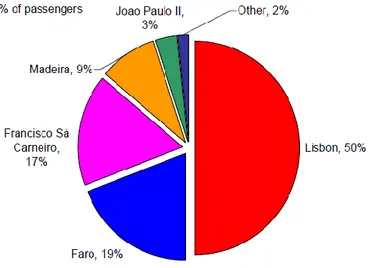
Figure 1.3 presents the Regional distribution of scheduled passenger trips originated in Portugal.
4
Figure 1.3: The Regional Distribution of Scheduled Passenger Trips Originated in Portugal (Oxford Economics, 2011)
As showed, Lisbon is Portugal’s main hub airport. In summary, Lisbon airport situation is described in five main points (INAC, 2010):
1. The number of passengers increased 2.5 times in twenty years, an average annual growth rate of 5%;
2. The traffic volume increase is not reflected in new routes, but dispersed among a larger number of existing ones operated by scheduled flights;
3. The traffic volume increase is not reflected in new carriers, maintaining highly concentrated for both types of traffic;
4. Fourteen of the fifteen main routes operated in 2009 had as origin or destination an European city, and decreased the relevance of domestic routes in total traffic; 5. The non-scheduled traffic tends to be less representative and consists in a greater
number of punctual operations of small dimension.
Thus, Portuguese airports are inside an increasing worldwide competition, so there is still space for improvement in efficiency and organization of such airports and airspace management. It is in the field of efficiency and organization of airports that this dissertation is based on applying the method of benchmarking to compare not only Portuguese airports but worldwide ones, and identifying the best practices to evaluate which are the most efficient.
With the increase of market competition, an evolution of management theories and approaches was needed. In this globally competitive environment, the airport sector recognizes the value of Benchmarking as a performance and efficiency analysis tool for each airport; thus it became a powerful tool for supporting and identifying these new approaches, in order to increase the efficiency and continuously monitoring the success of adopted strategies (ACI, 2006).
5
1.2. Object and Objectives
The main object of this work is the development of airport performance and efficiency predictive models using robust but flexible methodologies and incorporating simultaneously traditional indicators (number of movements and passengers, tons of cargo, number of runways and stands, area of terminals both of passenger and cargo) as well as new constraints as emerging situations and/or sudden natural phenomenon (ramp accidents and incidents, and volcano ashes and weather constraints, respectively).
Therefore this work has two specific objectives: the first one to show the efficiency evaluation of either a set of airports or the same airport along several years and under several constraints based on two multidimensional tools, Multicriteria Decision Analysis (MCDA, particularly through Measuring Attractiveness by a Categorical Based Evaluation Technique - MACBETH) and Data Envelopment Analysis (DEA); the second one to compare the obtained results using both MACBETH and DEA evidencing pros and cons of each multidimensional tool and searching for the best conditions to apply one or the other within airport management decision processes.
The airports that will be analyzed in the benchmarking study are (in this sequence) sets of Worldwide, European, Iberian (Portugal and Spain) and Portuguese ones. Also a self-benchmarking analysis will be conducted for some Iberian airports. Also we will incorporate in the self-benchmarking model for one airport in particular some emerging situations and/or sudden natural phenomenon.
Firstly we will take in account some previous MCDA/Macbeth and DEA case studies over which we will apply both methodologies. Secondly we will add to each airport new efficiency indicators and we will evaluate all of them in different scenarios and based on both Macbeth and DEA. Thirdly a comparison will be done between Macbeth and DEA methodologies, practices and results.
1.3. Dissertation Structure
This dissertation is divided into five chapters.The first chapter is the work Introduction, and presents the motivation, the main object and the specific objectives, and the dissertation structure.
6
In chapter two a state of the art review concerning airports benchmarking and airports performance and efficiency evaluation is done, including an overview about the related methodologies. Also is described not only the most common efficiency indicators but also some new ones that may be introduce into the traditional models and related to emerging situations (ramp accidents and incidents) and sudden natural phenomenon (volcano ashes and weather constraints).
The third chapter is an analysis of MCDA and DEA multidimensional tools and its importance for our study. We begin with a state of the art review about MCDA and DEA in general, to justify Macbeth and ISYDS option in particular, respectively. Also operational details and well as strengths and limitations of both MCDA/Macbeth and DEA/ISYDS are explained to support our choices.
The chapter 4 describes six case studies: cases I to IV are related to benchmarking studies about (in this sequence) sets of Worldwide, European, Iberian and Portuguese airports; case V is related to a self-benchmarking study involving some Iberian airports; and case VI is related to a self-benchmarking study about Madeira Airport (FNC) which includes in the evaluation process some emerging situations/sudden natural phenomenon constraints.
The fifth chapter is the work conclusions, and presents the dissertation synthesis, a few concluding remarks, and some insights and challenges for future research.
7
Chapter 2 – Benchmarking and Airport Efficiency
Analysis
2.1. Introduction
This chapter describes the state of the art review concerning airports benchmarking and airports performance and efficiency evaluation, including an overview about the related methodologies. Also is described not only the most common efficiency indicators (simple and complex) but also some new ones that may be introduce into the traditional models and related to emerging situations (ramp accidents and incidents) and sudden natural phenomenon (volcano ashes and weather constraints).
2.2. Airport Benchmarking
The last years revealed a growing interest in measuring the economic and operational performance of airports with benchmarking studies, within and externally the airport sector. Airport managers have increasingly facing requests from government agencies which have sought airport benchmarking as an aid to form or adjust regulations and to create legislation (Morrison, 2009).
ACI (2006) describes benchmarking as an economic standard by which business performance is measured, comparing productivity and efficiency, evaluating specific processes, policies and strategies to assess overall organizational performance. The reasons for the increasing interest in airport benchmarking are:
In the last 15 years, airport industry benchmarking has come into acceptance, particularly as many airports moved from direct public sector control to autonomous authorities;
Driving the need for performance indicators, as aviation industry liberalization, commercialization and globalization have increased airport business, in its complexity and competitiveness;
Practices to maximize airport service and efficiency have been adopted by many airports in an aggressive business philosophy;
To improve efficiency, airport operators are using continuous performance benchmarking internally and against other airports to gain insight into their operations.
8
Several airports no longer see their role as merely providers of infrastructure; they view themselves more and more as an industry which requires a wide range of business, competencies and skills, together with the adoption of effective management and business techniques, including benchmarking. Therefore, airports are now in a much more competitive environment, under great pressure to find out about the performance of their competitors through benchmarking. This situation is due to the increased airline competition, brought by liberalization in the USA and Europe, and a growing number of other airline markets, an increasingly competitive airline industry which is operating in a much more costly environment, particularly after the September 11th 2001 and other recent events, and is keener than ever before to identify any airport, which is being inefficiently managed or which is providing a poor quality of service (Graham, 2005).
For ACI (2006), airport benchmarking is a part of an airport’s strategic planning process. It is described as a statistical and accounting process that is used to monitor and compare airport economic, operational and service performance. The airport’s strategic objectives are assessed, in order to measure the performance of its functions, and the best practices for possible incorporation into the organization’s procedures are identified, to increase efficiency, quality and customer satisfaction. It’s a process in which:
Management and organizational changes are first, and measurement and technology are second;
Provides a diagnostic tool to check whether all systems are working properly and in alignment;
Self-benchmarking is an excellent management tool to monitor improvements in performance;
External benchmarking is an effective way to identify faulty practices, analyzing if they can be eliminated, as well as best practices and if they can be incorporated into an organization;
Can be a tool to link strategic goals, employee involvement and productivity, looking to create a continuous performance improvement process.
There are two general types of benchmarking: partial, assessing and comparing individual processes/functions/services; and, holistic, creating a systematic approach for defining and assessing a critical set of processes/functions/services that, when together, indicate the relative performance of the organization as a whole. Within these, there are two predominant forms of benchmarking: internal, self-benchmarking within an organization which compares internal performance of processes/functions/services over time (time-series); and external, which compares performance across organizations with peers or other industries (cross-sectional) at single point in time and through time (ACI, 2006).
9 For Ostblom and Karloff (1993) the process of benchmarking of an organization consists in five stages, namely:
Decision phase, where the indicators that will be submitted to the benchmarking process are chosen;
Identification phase, which identify the organizations with which they will make the comparative analysis;
Data collection phase;
Analysis phase, under which the rankings are produced;
Action, which applies best practices in order to increase performance and efficiency of the selected organizations.
In this work, a complementary work of Braz (2011), we will follow the first four steps: identifying indicators and organizations for comparison, collecting information and producing the rankings. The fifth stage is a responsibility of each organization involved to achieve and implement the appropriate means to move up inside the rankings.
2.3. Airport Performance and Efficiency Evaluation
2.3.1. Description and Interest
The process of introducing private participation in the management and operation of airports, and the liberalization of competition among airlines, lead to a competition between airports, for connecting traffic (to become hub airports) and to increase their efficiency. This is the reason for the growing interest in measuring the efficiency and performance of airports during the last years (Perelman and Serebrisky, 2010).
International airports are complex and dynamic organizations, providing a challenge in establishing an appropriate performance measure system. There are many interacting parts that make complex the development of performance measure systems (airlines, passengers, handling agents, etc); it is a critical management activity. Airport managers and governments measure airport performance for several reasons: from a financial and an operational perspective, to evaluate investment strategies, to monitor airport activity from a safety perspective and to monitor environmental impact. This management requires information in order to identify areas that are performing well and those where appropriate corrective action needs to take place. The different stakeholders will have several performance information requirements, since the airport costumers in general that will be interested in assessing its performance, to airlines as the key costumers of the airports, acting as an intermediary between the airport and passengers or freight shippers. The optimization of
10
operational performance is becoming increasingly important to the protagonists along the air transport infrastructure. They can be airports or air navigation service providers - desiring to improve their performance in order with strategic business objectives, whilst their customers wish to be assured that services are being delivered in an efficient and effective manner to meet their requirements (Humphreys and Francis, 2002).
Also in order to set realistic performance improvement objectives, it is important that economic regulators have a good understanding of the entire airport. The main components of operational performance in airports and air traffic management (ATM) are efficiency, punctuality, operational resilience and environmental impact, being fully connected with the entire passenger experience (Fairbanks, 2009).
Therefore, the use of Benchmarking can give us useful insights, in measuring airport performance and efficiency.
2.3.2. Methodologies to Evaluate Airport Performance and
Efficiency
There are two main research types on airport performance: the productivity evaluation approach and the efficiency evaluation approach; the difference lies in a concept of maximum attainable outputs. Whereas productivity considers actual outputs, efficiency does not take the maximum potential output which can be produced with the available inputs, and offer relies on comparing with other firm. The underlying meanings of these two terms are not identical, despite of being often used as synonyms; changes in productivity are due to changes in efficiency, among other factors (Lai et al.,2010).
Previous studies often adopted quantitative methods, relying on numerical and secondary data, in order to evaluate efficiency and productivity. For example, Hooper and Hensher (1997)1 used Total Factor Productivity (TFP) method in order to examine the performance of
six Australian airports over a 4-year period. Adler and Berechman (2001)1 analysed airport
quality and performance from the airline’s point of view using DEA. Martin and Roman (2006)1
compared the relative performance of Spanish airports, comparing Surface Measure of Overall Performance (SMOP) and DEA. Oum et al. (2008)1 applied Stochastic Frontier Analysis (SFA) to
a panel data of world’s major airports, studying the effects of ownership forms on airport’s cost efficiency. Another important methodology used in many cases is MCDA. Evaluation
methods which have been employed in the airport industry, to evaluate efficiency and productivity can be divided into four major types. Table 1 shows these different types of benchmarking techniques that have been applied by previous studies.
11 Table 1: Airport Performance Evaluation based on Different Methods (Lai et al., 2010)
Methodology Weakness
Partial Measure
This method uses partial ratio data to carry out performance comparison of
target sample in single dimension such as on
financial and cost performance of an airport.
This method only focuses on certain fields of airport performance. The evaluation
result of this method would not be able to provide a
more comprehensive evaluation of an airport’s
performance.
Multi-Criteria Analysis (MCDA)
One of the widely adopted methods. Traditionally, employing this method can
be divided into two main steps: first step is to acquire relative weights, and second step is to rank the options.
This method first selects evaluation indicators through
expert survey or interview, and then chooses optimal
solution bases on those selected indicators.
Because the selection of indicators is based on expert’s experience and their own judgment, the result may be affected by
subjective factors.
Frontier Analysis: Parametric approach
Stochastic Frontier Analysis (SFA)
SFA, sometimes referred to as econometric frontier approach, is one of the main
parametric approaches used by researchers to evaluate
efficiency.
Although the parametric approaches take into account the effect error, which is not considered in non-parametric approach, the parametric
methods still faces challenges on separating
random error from efficiency.
Frontier analysis: Non-parametric approach
Data Envelopment Analysis (DEA) is a non-parametric approach, which requires no
assumptions about the functional form and calculates a maximal performance measure for each airport relative to all
other airports.
The key drawback of the technique is that it does not allow for random error in the
data, assuming away measurement error and luck as factors affecting outcome,
which implies that the measured inefficiency is
likely to be overstated. Total Factor Productivity
(TFP). In economies, TFP is a variable which accounts for
effects in total output not caused by inputs. TFP allows for measuring cost efficiency and effectiveness and for distinguishing productivity
differences in airport performance. This technique
can also be used for investigating the impact of
variations of input and output price on an airport’s
performance.
TFP requires an aggregation of all outputs into a weighted
output index and all inputs into a weighted input index using pre-defined weights
12
A careful analysis had been taken of these different methods to evaluate performance/efficiency of an airport, its features, advantages and disadvantages. We choose to develop our work with a Multicriteria Decision Aid (MCDA) analysis, since it is a complement of a previous study done by Braz (2011) in which it was used, and also the DEA analysis for reasons specified in the next chapter.
2.3.3. Efficiency Indicators
There are many different circumstances related with airport operations, i.e. aviation activities, commercial activities, location constraints, etc., and individual airports need to find different performance indicators in order to be most relevant and useful. For example, larger airports are likely to focus on different indicators than smaller ones; airports with large developable land areas will focus on different indicators than high constrained airports in large urban areas; and privatized airports on different financial performance indicators, than non-profit government-owned airports. Regarding which indicators are most important and each airport characteristics, managers will have a key position to decide which indicators are most important, and how many the airport should track; over time, this set of indicators to an individual airport will change as new issues arise (ACI, 2012).
Thus, when there are a limited amount of correlated indicators to take into account, Benchmarking is a viable tool, being also important to establish previously and carefully the goal of the ranking to be produced. For example, if the goal is concerning the passengers and their satisfaction the number of runways may be out of focus; but if the goal is concerning the airport management, the number of passengers will be one of the key elements. So it is crucial to choose the proper indicators for each stakeholder (Braz et al, 2011).
The almost entirely work done till nowadays on the efficiency and performance of airports is described by Liebert and Niemeier (2010). Each one of the 59 reported works use different sets of indicators. The most cited are: number of boarding gates, areas of passenger terminals and cargo, number of runways, and operating costs. The less used are: runway length, terminal area, number of check-in counters, and the number of parking spaces for motor vehicles. Among the most frequently used output indicators are: number of passenger and cargo processing, number of aircraft movements. And the less used are: aeronautical and non-aeronautical revenues, and delays.
There are several works on airport benchmarking, each one using different performance indicators; some of them use single indicators, while others consider complex ones. We used both two different approaches in this work, since for MCDA we used complex indicators (composed by an output/input structure) and for DEA we used single ones. This was necessary
13 taking into account the analysis structure of each program, as explained in the related tool description section. So the indicators can be divided in two major groups, single and complex, as those we used with DEA and MACBETH tools respectively. The indicators included in our analysis, namely inputs and outputs, are shown in Table 2 and in figures 2.1 to 2.10.
Table 2: Single and Complex Indicators
Si ng le i ndic ator s D EA Inputs Number of Runways Aircraft Parking Stands Passenger Terminal Area
Cargo Terminal Area Number of Boarding Gates Number of Check-In Desks Number of Baggage Carousels
Natural (Factors) Effects
Outputs Processed Passengers Aircraft Movements Processed Cargo (Ton.)
Comp le x i ndic ato rs MA CBE TH
PAX/PAX TA Processed Passengers / Passenger Terminal Area
CARGO/CARGO TA Processed Cargo (ton.) / Cargo Terminal Area
MOVS/STANDS Aircraft Movements / Number of Aircraft Parking Stands
MOVS/RWS Aircraft Movements / Number of Runways
PAX/GATES Number of Processed Passengers / Number of Boarding Gates
PAX/CHK-IN Number of Processed Passengers / Number of Check-In Desks
MOVS/GATES Number of Movements / Number of Boarding Gates
MOVS/BELTS Number of Movements / Number of Baggage Claim Belts (arrivals)
OP TIME/TOTAL T Operational Time / (24 h 365 days) Natural (Factors) Effects:
Figure 2.4: Cargo Terminal (2.bp.blogspot.com, 2012) Figure 2.1: Runway (ANAM, 2012) Figure 2.2: Aircraft Parking Stand
(ANA, 2012)
Figure 2.3: Passenger Terminal (ANAM, 2012)
14
Figure 2.7: Baggage Claim Belts (ANAM, 2012)
Figure 2.8: Processed Passengers (dnoticias.pt, 2012)
Passengers, includes the number of passengers who arrives and departs into/from the airport; Aircraft Movements, includes the number of aircraft landing/take-off on/from the airport; and Cargo, includes the number of cargo tons that arrives and departs on/from the airport being domestic or international, freight or mail flights. For the boarding gates, both jetway and remote access gates (by bus) was taken into account; and with aircraft parking stands for the airports providing multiple parking positions (depending on aircraft wingspan or length Multiple Aircraft Ramp System (MARS) system utilizes apron space more efficiently through the configuration, e.g. large and Jumbo sized stands to enable two smaller aircraft to park instead of one larger aircraft), the minimum number was referred when available.
Figure 2.5: Boarding Gates (Jetways)
(AENA, 2012) Figure 2.6: Check-in Desks (ANAM, 2012)
Figure 2.10: Processed Cargo (Infraton.blogdevoo.com, 2012) Figure 2.9: Aircraft Movements
15
2.3.3.1. Impact of Natural (Factors) Effects on Airports Operational
Efficiency
It is well known that aviation presents a high sensitivity to weather, with major impacts on safety, efficiency and capacity of aviation operations. Consequently, the capacity of airports is highly reduced by the need to increase the separation between aircraft, for additional holdings, or by the closure of one or even all runways, affecting its operational performance. Such weather phenomenon, and from a point of view of airport operations, includes thunderstorms, turbulence and gusts, heavy snowfall and runway icing, low visibility by fog, and most recently, volcanic ashes on airspace, due to volcanic eruptions (figures 2.11 to 2.13).
As a result, the operational capacity of a region’s entire airspace is reduced through delays, diversions and cancellations of flights – all of which have severe effects for travelers. An example is presented in figure 2.14 (but see also figure 2.15), which presents the arrivals board of London Heathrow airport terminal 5, in 16th April 2010, when Eyjafjallajökull
erupted on Iceland; all flights were canceled or highly delayed (Jardim et al., 2012). Figure 2.12: Volcanic Ash at San Carlos
de Bariloche Airport, in Argentina, after Wind have carried the Ash from Chile's
Puyehue Volcano in June 2011 (Redrif.com, 2012)
Figure 2.13: Works on Snow Removal at La Guardia airport, New York City, during
December 2010 Snowstorms (CSmonitor.com, 2012) Figure 2.11: Heavy Rain at Cancun Airport
16
An airport has an amount of basic characteristics, which all are considered to well combine with specific weather hazards, such as local weather phenomenon and climacteric conditions, topography of the region, orientation of the runways, etc. Due to climate change, these phenomenon will be more common and with highly impacts, therefore, an individual self-benchmarking study has to be done for each airport in order to investigate its susceptibility to adverse weather, since conclusions found for one airport do not automatically hold for others (Sasse and Hauf, 2003).
2.4. Conclusion
An economic benchmark is a standard by which business performance is measured. It is used in any kind of activity, to compare productivity and efficiency, evaluate specific processes, policies and strategies and to assess overall organizational performance. Complex and dynamic organizations such as international airports provide a challenge in establishing an appropriate performance measure system, in order to improve their roles in an increasingly competitive aeronautical activity.
Really airports are nowadays complex infrastructures located in the middle of a chain of agents and to promote the performance of the airport also is necessary to promote that chain as a whole. To achieve such a goal is necessary to understand the added value of the airport in particular, so the choice of the indicators (simple or complex) to construct the rankings to benchmark the airports must be very accurate. There are several sets of indicators as well as several techniques for benchmarking, but the airport stakeholders needs simultaneously robust and flexible tools, mainly because air transportation acts in a very interactive and iterative world where changes are very quick.
Figure 2.14: Arrivals Board of London Heathrow Airport Terminal 5, in 16th April 2010, due to Iceland Volcano
(wikipedia.org, 2012)
Figure 2.15: Affected Passengers at London Heathrow Airport, during December 2010
Snowstorms