ESCOLA BRASILEIRA DE ADMINISTRAÇÃO PÚBLICA E DE EMPRESAS MESTRADO EM ADMINISTRAÇÃO
MARKET MECHANISMS OR MANAGERIAL INTERNAL POWER:
GETTING TO THE ROOTS OF EXECUTIVE COMPENSATION
Dissertação apresentada à Escola Brasileira de Administração Pública e de Empresas para obtenção do título de Mestre
MARCELO DO DESTERRO SOUZA DE QUEIROZ
Rio de Janeiro - 2018FUNDAÇÃO GETÚLIO VARGAS ESCOLA BRASILEIRA DE ADMINISTRAÇÃO PÚBLICA E DE EMPRESAS
MARCELO DO DESTERRO SOUZA DE QUEIROZ
MARKET MECHANISMS OR MANAGERIAL INTERNAL POWER: GETTING TO THE ROOTS OF EXECUTIVE COMPENSATION
Ficha catalográfica elaborada pela Biblioteca Mario Henrique Simonsen/FGV
Queiroz, Marcelo do Desterro Souza de
Market mechanisms or managerial internal power : getting to the roots of executive compensation / Marcelo do Desterro Souza de Queiroz. – 2018. 30 f.
Dissertação (mestrado) - Escola Brasileira de Administração Pública e de Empresas, Centro de Formação Acadêmica e Pesquisa.
Orientador: Ronaldo Couto Parente. Inclui bibliografia.
1. Administração financeira. 2. Executivos - Salários, etc. I. Parente, Ronaldo Couto. II. Escola Brasileira de Administração Pública e de Empresas. Centro de Formação Acadêmica e Pesquisa. III. Título. CDD – 658.15
4#YfGV
MARCELO DO DESTERRO SOUZA DE QUEIROZ
"MARKET MECHANISMS OR MANAGERIAL INTERNAL POWER: GETIING TO THE ROOTS OF EXECUTIVE COMPENSATION".
Dissertação apresentado(a) ao Curso de Mestrado em Administração do(a) Escola
Brasileira de Administração Pública e de Empresas para obtenção do g·au de Mestre( a)
em Administração.
Data da defesa: 22/10/2018
ASSINATURA DOS MEMBROS DA BANCA EXAMINADORA
Market mechanisms or managerial internal power: getting to the roots of executive compensation
Abstract
Even though several studies have examined the executive compensation structure and its determinants, there is still disagreement in the field. While some authors view pay arrangements as the result of market mechanisms that reward executives for their abilities, others assume that executives have enough power to influence their own compensation, thus capturing rents and overcoming shareholders’ interests. The present study empirically investigates this matter, shedding new light on the root of executive compensation and identifying which stream best finds statistical support. This study analyzes the impact of the Brazilian recession on executive compensation and, following optimal contracting theory, theorizes a reduction in the total amount appropriated by top managers. By examining executive compensation in Brazilian listed companies from 2010 to 2016, the study finds that executives are powerful enough to manipulate their compensation packages according to their own interests. At the same time, this study refutes optimal contracting theory by showing that executive compensation does not follow market oscillations. This research elucidates the path for future research in the field, indicating the prominence of Managerial Power Theory on the establishment of executives’ compensation packages.
Key-words: executive compensation; optimal contracting theory; managerial power theory
Resumo
Ainda que diversos estudos tenham se dedicado a examinar a estrutura de remuneração dos executivos e seus determinantes, ainda persiste uma notável divergência na área. Enquanto alguns autores entendem o pacote de remuneração como resultado de mecanismos de mercado que recompensam os executivos por suas habilidades, outros assumem que os executivos têm poder suficiente para influenciar sua própria remuneração, assim capturando lucros em detrimento dos interesses dos acionistas. Nesse contexto, o presente trabalho investiga empiricamente essa questão, lançando nova luz sobre as origens da remuneração executiva, ao mesmo tempo em que identifica qual das correntes encontra maior suporte estatístico. Dessa forma, é analisado o impacto da recessão brasileira na remuneração executiva e, baseado na optimal contracting theory, desenvolvida a teorização da redução no valor total apropriado pela alta cúpula gerencial. Ao examinar a remuneração de executivos de empresas brasileiras listadas entre 2010 e 2016, o estudo mostra que os executivos têm poder o suficiente para manipular seus pacotes de remuneração de acordo com seus próprios interesses. Paralelamente, são apresentadas evidências contrárias à optimal contracting theory, mostrando que a remuneração dos gestores não acompanha as oscilações do mercado. Assim sendo, esta pesquisa elucida o caminho para futuras pesquisas na área, indicando a proeminência da Managerial Power Theory no estabelecimento de pacotes de remuneração executiva.
1 Introduction ... 7
1.1 Brazilian context ... 9
2 Research background and hypothesis ... 10
3 Methodology ... 13
3.1 Data and context: why Brazil? ... 13
3.2 Explaining variables ... 14
3.3 Model estimation ... 15
4 Results ... 16
5 Discussion and conclusion ... 21
1 Introduction
From the seminal work of Berle and Means (1932) to the latest studies on the topic, executive compensation has the attention of the business press, academics, and practitioners. Much of this attention is due to the abnormal increase in executive pay throughout the last decades, addressing not only economic, but also behavioral and situational, issues (Greckhamer, 2016; Chng, 2012). According to Murphy and Zábojník (2004), the ratio of CEO to worker compensation increased from about 25:1 in 1970 to nearly 90:1 in 2000, when examining Forbes 800 companies. In 2008, considering Forbes 500 companies, Jacquart and Armstrong (2013) found that CEOs made 185 times their employees’ salaries. In a similar analysis, Hoskisson (2009) states that CEOs made 344 times an average worker’s compensation in 2007, compared to an amount of 71 times in 1989.
Such increases make executive compensation comparable to that of professional athletes and pop stars. While some authors perceive it as a natural market movement and advise against any kind of regulation or government influence (Willard, 2010), others point to an economic distortion and call for major changes (Shin, 2014). In any case, there has been tremendous public debate on why top executives are paid so much (Finkelstein and Hambrick, 1989).
Understanding executive compensation and its determinants is important. The general public is interested, and knowledge can lead to improved governance mechanisms and enhanced firm fiscal responsibility (Chizema et al., 2015). Soaring executive compensation means a reduction in firm resources for investment or return to shareholders, ultimately increasing the cost of equity. From a societal perspective, this high remuneration induces the emergence of new economic elites, especially if this abnormal remuneration is not associated with higher productivity and higher company value.
Although several studies have investigated executive compensation structures and determinants (Beatty and Zajac, 1990; Zajac and Westphal, 1994; Balkin and Gomez-Mejia, 1990; Finkelstein and Hambrick, 1989; Gomez-Mejia et al., 1987), there remains a lack of consensus, which has generated an ample, but disjointed, literature. More specifically, while some authors conceive pay arrangements as a result of market mechanisms that reward executives for their abilities (Murphy and Zábojník, 2004), a contrary stream assumes that executives have enough power to influence their own compensation, thus capturing profits and overcoming shareholders’ interests (Goergen and Renneboog, 2011; Van Essen et al., 2015).
According to Bebchuck and Fried’s (2003) managerial power theory (MPT), top executives effectively participate in the compensating-setting process. In this line of thinking, they are able to benefit themselves through the establishment of favorable compensation policies, which will not only boost their returns, but also reduce their risks. At the same time, once an executive is managing the company on a daily basis, he/she has information that is not available to shareholders and that can be used to design convenient remuneration packages. Consequently, in this perspective, remuneration is a result of executive influence and power over the board and the company as whole (Bertrand and Mullainathan, 2001; Yermack, 2006).
Alternatively, economic theory, which is the main influence on executive pay research (Finkelstein et al., 2009), proposes the optimal contracting approach. This theory considers
executives and companies as market agents seeking to maximize their utility, following rational premises. Though it is not widely supported (Ezzamel and Watson, 1998), the rational decision-making perspective assumes both parties operate at market arm’s length. In this sense, compensation is a result of the balance between antagonistic forces: executives looking for higher payments and the lowest risk and companies looking for skillful professionals at a lower cost (Murphy and Zábojník, 2004; Conyon, 1997). Extending this view, executives receive high compensation because their management skills are rare; also, the two parties involved in the contract negotiation are assumed to behave rationally and unbiased. Consequently, compensation committees are expected to design effective contract incentives, therefore aligning managers’ and shareholders’ interests.
Despite the fact that a wide range of research follows one of these two approaches, it is not clear which one of them is more significant in explaining the growth in remuneration (Malmendier and Tate, 2009). There have been many executive compensation studies, but none have empirically investigated the validity of these streams. The present study aims to fill this gap and shed new light on the consistency of both streams. This study examines the effect the Brazilian market retraction had on executive compensation and CEO power. Precisely, the research analyzes the 2014 Brazilian recession’s influence on the total compensation appropriated to executives in Brazil.
According to optimal contracting theory, which views executive compensation as the result of market mechanisms, the total amount allocated to top managers is expected to decline during economic recessions, since companies present worse financial reports, have less capital to invest, and require fewer managers to run their operations. This argument gets stronger when we remember that a significant part of executive compensation comes from variables parameters, such as stock options and bonuses (Pennings, 1993; Pfeffer and Jeffrey, 1998; Nichols and Subramaniam, 2001). Alternatively, managerial power theory does not expect any reduction in executive compensation during these times, as it acknowledges executive power and executives’ influence on their own payment structures.
The current study investigates which of these streams finds empirical support in a recession context. Considering the economic retraction as a factor responsible not only for reducing the demand for highly skilled executives, but also for negatively influencing companies’ performance, this study analyzes the extent to which executive compensation was affected by the economic crisis. We apply paired t-test analyses and a fixed effects panel regression throughout the observed years.
This study differs from previous research on executive compensation, as our analysis allows the comparison of both competing theories, reveals their main disagreement, and indicates which theory is best aligned with empirical findings. Therefore, it presents a broad explanation of executive compensation determinants and attends to the interest of the business press, practitioners, and, particularly, academia. In this sense, it elucidates the path for further research in the field, as it demonstrates the prominence of each perspective on top management payment dynamics. Finally, it shows the validity of applying paired t-tests and longitudinal regressions in executive compensation research.
We next present a brief contextualization of Brazilian scenario, focusing on capital market issues, followed by an overview of the executive compensation literature, exposing the established theories and the more prominent trends, which will naturally introduce the hypotheses of the study. We then present our data and analytical methods, after which we present our results. Finally, we interpret our findings, discussing their implications and limitations and proposing further research tracks.
1.1 Brazilian context
In order to enhance the rigor of the study and to make the findings more relevant for practitioners, it is relevant to emphasize the corporate governance context in Brazil (Teagarden et al., 2018). Particularly, the shift from Euro-American perspectives to the emerging markets requires business, culture, and contextual environments’ regards, since the traditional developed context is not the same (Von Glinow and Teagarden, 2009). In this sense, to keep its applicability and substance, the present research makes an effort to seize and to expose the differences presented by Brazilian environment when compared to hub countries.
In this movement, it is worth saying that Brazilian stock exchange, B3 – former BM&FBOVESPA – presents 444 companies by the time of the research, establishing itself as the biggest one in Latin America. At the same time, even facing a hard crisis period from 2014 to 2016, which is going to be deeper explained, Brazil rises as the second largest economy in the Americas and 8th in the world, manifesting its comparative pertinence for research purposes. Nevertheless, as a peripheral country, Brazil exhibits some peculiarities concerning its companies corporate governance and control mechanisms.
In this sense, the realm of executive compensation in Brazil is marked by the concentrated ownership structure of the firms, as several emerging economies. As elucidated by La Porta et al. (2000), the concentration of ownership can be taken as a consequence of fragile legal protection for minority shareholders, so that the model of companies with pulverized ownership is present only in common law countries. In the same line, Wright et al. (2005) understand that emergent economies, such as Brazil, are set around concentrated ownership firms, in opposition to developed economies where most of the listed companies have dispersed ownership. Given that, the corporate governance structures in those economies may usually resemble those of developed economies in form but not in substance.
Following this line of thinking, controlling shareholders may expropriate minority shareholders in many ways, especially in countries with poor institutional protection, as in most emerging economies. Among several expropriation practices, it is worth to mention the appointment of managers directly linked to the controller's power group, and their trust. So, the role of the controller shareholder is often mixed with the role of the manager, resulting in a situation where they set the level of executive compensation, often with losses to other shareholders (Su et al. 2010). At the same time, the executive can provide conveniences for the controlling shareholder, what means even less power and influence to the minority shareholders.
Such configuration delineates an exacerbated executive power, especially of the CEO, which is a distinctive feature of peripheral capital markets. As it is going to be further investigated, the manager’s role mixes up with the controller shareholder, resulting not only in a
detriment of minor shareholders interests, but also in a peculiar concentration of power in hands of the top executives (Young et al. 2008, Su et al. 2010).
2 Research background and hypothesis
The executive labor market perspective views CEO compensation as a matter of supply and demand, strongly relying on economic conditions and responding to the marketplace for CEO talent (Finkelstein and Hambrick, 1989). Following this line of thinking, the labor market tends to establish minimum pay standards that vary according to companies’ features, such as industry and size (Ciscel and Carroll, 1980; Fama, 1980). Therefore, despite eventual inefficiencies within the managerial labor market that may slightly distort CEO pay (sometimes even arousing the feeling of irrational practices), in general, it works as a competitive market (Kaplan, 2008; Murphy and Zábojník, 2004).
Echoing this view, market forces are of first-order importance in determining trends in executive compensation. In trying to maximize their performance, companies seek executives with well-developed managerial skills. In practical terms, companies demand executives who have skills in economics, management science, accounting, finance, and other related disciplines. Finding executives with abilities in all these areas is difficult (Murphy and Zábojník, 2004). Since these competences are rare, it tends to elevate top executive pay to values above the rank-and-file average.
However, political processes influence executive compensation, and this fact remains at the heart of agency theory (Finkelstein and Hambrick, 1989; Jensen and Meckling, 1976). In this view, the distinction of ownership and control—typical of public companies—has created an asymmetry of information between managers and shareholders, which leads to corporate governance issues, as outlined by Berle and Means (1932). Observing the formation of large companies in the United States, the authors identified the advent of the public company, featuring the pulverization of ownership and the separation between controllers and owners. Berle and Means (1932) found that once the public company gathers the wealth of several people under one central control, it takes away the self-employed owner from the daily management, transferring general decisions to professional managers.
Following this line of thinking, Jensen and Meckling (1976) view the establishment of a public company as a way to separate who controls and who owns the company. In this movement, the shareholders delegate the management of the company to professional executives, who they view as being more qualified. Hiring these executives comes at a financial cost, of course. These costs include the compensation executives receive for their work running the company and, in theory, representing shareholder interests. Salaries, profit sharing, bonuses, and other forms of remuneration are included in this category. In most companies, these benefits are associated with performance parameters. Going further, there are also indirect costs, which derive from the possibility that managers may not adequately represent investors’ interests. That is, as investors partially alienate themselves from the management of their equity, they risk not having their interests represented in the way they expect.
investors’ interests. By satisfying their own interests first, managerial opportunism emerges (Fiani, 2002). Facing this misalignment, several compensation packages emerge, not only to stimulate the action in favor of the shareholder, but also to keep and retain capable executives (Locke, 2008; Walsh, 2008; Conyon, 2006).
As a result, CEOs are highly paid for performance, and boards do monitor them, so monitoring and bonding are complements rather than substitutes (Hoskisson et al., 2009). Following this logic, higher compensation is a consequence of increased monitoring intensity (Hoskisson et al., 2009). Alternatively, monitoring and bonding can be viewed as substitutes to the extent that higher control tends to reduce opportunistic behavior; they are applied concurrently in governance mechanism packages (Rediker and Seth, 1995).
In view of this inconsistency and the uncertainties surrounding the main influences on executive compensation, there has been a significant increase in executive remuneration in recent years (Gabaix and Landier, 2008). Some authors point to alarming aspects of this growth (Walsh, 2008), implying imperfection of the executive market; others show that executive compensation has grown as much as compensation to other groups of qualified professionals, such as private equity and venture capital investors (Kaplan and Rauh, 2008).
In line with these contradictory currents, there is a dichotomy between optimal contracting theory and managerial power theory. More specifically, while optimal contracting theory (also known as economic theory) views executive compensation as a natural and well-balanced result of competing forces in a well-adjusted market and a matter of supply and demand, MPT views executive compensation as a result of intense political influence, executive rent-seeking, and shady remuneration packages.
According to MPT, boards rarely optimize executive contracting, due to specific structural and social-psychological mechanisms. As a result, decisions about executive compensation are strongly influenced by such mechanisms, which allows top managers to establish compensation arrangements aligned to their own interests (Bebchuk and Fried, 2004). Consequently, MPT states that instead of solving agency problems, those processes endorse them, culminating in more distorted compensation structures. Echoing this view, determinants of executive compensation rely on internal processes at the company; thus, they are not merely a result of market forces.
In the context of the Brazilian economic recession of 2014, during which companies presented worse financial results, planned smaller investments, developed fewer projects, adopted conservative attitudes, reduced their investments (Oreiro, 2017), and, consequently, offered fewer positions for executives, we expect a retraction for executive positions. In this scenario, optimal contracting theory would predict lower executive compensation, while MPT would expect maintenance—or even an increase in payments. Given that, the present study conceives the Brazilian economic recession of 2014 as an exogenous shock to the trend of executive compensation over the years, confronting both theories. This research seeks to understand which one of these flows presents greater explanatory power on executive compensation. This leads to the following hypotheses:
Hypothesis 2 (H2): The economic retraction is negatively associated to executive compensation. In an analogous investigation, this study expands the same framework from the executive compensation to the CEO compensation puzzle; it examines which one of the mentioned streams provides empirical support. Although a more restricted market, CEO compensation is a component of executive compensation. It is also commonplace in corporate governance studies and presents extensive literature, and it has similar challenges and puzzles when compared to executive compensation as a whole (Barkema and Gomez-Mejia, 1998; Devers et al., 2007; Van Essen et al., 2015). Based on the same premises as the executive compensation query, the third and fourth hypotheses originate:
Hypothesis 3 (H3): CEO compensation averages are the same when comparing periods before and after the crisis.
Hypothesis 4 (H4): The economic retraction is negatively associated to CEO compensation. We assume that the recession influences only the market, not any political factor related to MPT. Following this logic, since the economic retraction is an exogenous factor to the companies, we suppose they do not influence CEO power within the firm. Therefore, according to the contracting theory, a reduction in both CEO and executive compensation is expected. However, if any reduction or even a maintenance of compensation is perceived, it would endorse the MPT notion in which executives use their power to manipulate their compensation packages and benefit themselves. In other words, given that the crisis reduces the need for professionals, decreases investment, and leads firms to adopt conservative attitudes overall, according to optimal contracting theory, companies expenses in general, including executive compensation, would also decline, reaching a lower optimum point.
From another perspective, one can say that market contraction directly affects executive power, as their bargaining power as professionals is reduced in a recession context. More specifically, since a retraction in the market reduces the demand for executives, they lose power, which affects their compensation negatively (Van Essen, 2015). In turn, during economic booms, executives may enjoy a higher demand for their labor, which appreciates their compensation. In this sense, MPT and market-based explanations become complementary rather than excluding, both influencing executive compensation through a mediation relationship.
As mentioned previously, CEO compensation is a component of executive compensation. While the first is about the head office manager (referring to a single individual), the second encompasses the entire board of directors. Since the current literature does not present any construct regarding executive power, the proposed logic is transposed to CEO power and CEO compensation for the purpose of investigation. Based on this view, the fifth and the sixth hypotheses emerge:
Hypothesis 5 (H5): CEO power positively influences CEO compensation.
Hypothesis 6 (H6): The economic retraction influences CEO compensation, in a relation mediated by CEO power.
We propose that power has a mediatory effect on the relation between market forces and executive compensation, as shown in the following model:
In this framework, market forces correspond to the economic retraction variable, influencing both CEO power and CEO compensation through a mediation effect. At the same time, as established in the literature, the model also raises the association between CEO power and CEO compensation.
On the one hand, optimal contracting theory expects a negative association between economic retraction and both CEO compensation and CEO power. In the presence of economic retraction, CEO compensation and CEO power should decline, once general economic indicators are in a negative trend. On the other hand, MPT expects a maintenance of, or even a positive association between, economic retraction and both CEO compensation and CEO power, since socio-psychological mechanisms play a major role in defining CEO compensation and external influences—such as economic crisis—have a secondary impact.
3 Methodology
3.1 Data and context: why Brazil?
Brazil, the biggest Latin America economy, experienced its deepest and longest recession since World War II from the second quarter of 2014 to the third quarter of 2016 (Safatle et al., 2016). Throughout this period, the economic activity dropped 8.33%, after 11 consecutive quarters of recession, which directly affected companies’ investment level. From 2010 to 2014, non-financial listed companies in Brazil saw its ROE dramatically collapsed from 16.50% to 4.30%, while the Brazilian federal funds rate oscillate between 8.20% and 11.70% (Oreiro, 2017).
In this scenario, Brazil presents itself as a significant emergent economy that suffered a critical economic retraction, allowing us to investigate the consequences of this phenomenon on the executive compensation realm. More specifically, Brazilian data is relevant on the global economy, at the same time it enables an examination of executive compensation in face of market downturn and investment reduction. Given that, it sets up the properly environment for the empirical analysis of the previously exposed theories.
Going further, Brazilian data on executive compensation and financial reports are easily available. In this matter, Brazilian Securities and Exchange Commission (CVM) Instruction No. 480 of 2009 required public companies to disclose the composition of management compensation by an annual document called the Reference Form (FR). Two subsections of the 2017, 2016, 2015, 2014, and 2013 editions (with 2016, 2015, 2014, 2013, 2012, 2011, and 2010 data, respectively) of this document were used in this study. Subsection 13.2, with information on the types of remuneration (fixed remuneration, variable compensation, post-employment benefits, termination and stock-based) by body (board of advisors, fiscal council and statutory directors board) and subsection 13.11, which informs the minimum, the average and the maximum remuneration of the members of these bodies. For the present study purposes, only statutory directors board and its maximum remuneration will be addressed.
The sample begins in 2010, the first year that Brazilian Securities and Exchange Commission (CVM) required all Brazilian listed firms to disclose their executive compensation information. After deleting firms with missing or inconsistent data, most of them supported by a preliminary injunction that allowed secrecy over executive data, the final sample consists of 373 unique firms, covering 2611 firm-years, which accounts around 84% of total firms listed on Brazilian stock exchanges – B3 (former BM&FBovespa). This data set allows to capture the evolution of Brazilian executive compensation under economic prosperity and economic retraction. The abundant information content from the larger observation increase the freedom and estimation efficiency in the regressions, revealing the effect of CEO power and crisis in the dynamic of executive compensation.
3.2 Explaining variables
At first, it is worth establish the notion of compensation addressed in this study, particularly total executive compensation and total CEO compensation. While the first refers to the amount of payments appropriated to the body of managers composing the statutory board of directors, comprising salaries, bonuses, stock options, and benefits, the second refers to the amount of payments appropriated exclusively to the head of them, also known as CEO.
In practical terms, the addressed variables are the total executive compensation by company, the total CEO compensation by company, the total executive compensation by company accounting inflation, the total CEO compensation by company accounting inflation, the napierian logarithm of the total executive compensation by company accounting inflation, the napierian logarithm of the total CEO compensation by company accounting inflation, and the CEO power by company, shortening by the DEtot, DEmax, DEtot_Inf, DEmax_Inf, Ln_DEtot, Ln_DEmax, and CEOpwr, respectively. Since the study aims to evaluate compensation variation after economic retraction, it makes more sense to analyze the total amount assigned to the executives, rather than the average compensation, since some executive’s posts may have been extinguished throughout crisis, therefore maintaining the same average compensation for those who remained. In other words, the dependent variable total executive compensation by company and the total executive compensation by company accounting inflation precisely encompass the focus of analysis in this study, to the extent it matches the total amount of resources appropriated to the executive payroll.
assumed that the highest executive compensation corresponds to the CEO compensation in each company. Once he is the head of the executive office, leading the company as a whole, it is expected for him to present the highest payment among his colleagues, which is expressed in the maximum compensation.
Concerning CEO power, as developed by Bebchuk and Fried (2003), MPT infers that compensation arrangements are not established through market negotiations, thus resulting from an unbalanced negotiation between a powerful CEO and a weak board of directors. Following this line of thinking, CEO power can be accounted based on the compensation detachment from the CEO to the rest of the board. Given that, CEO power is measured through a variable that reflects pay inequality among top managers, which is operationalized as the CEO’s total compensation as a fraction of the total compensation for the firm’s top managers (Bebchuk et al., 2011). Such CEO Pay Slice (CPS), as regarded by the authors, is supposed to reflect the relative importance of the CEO and its capacity to extract rents, also representing tournament incentives or CEO power (Correa and Lel, 2013). As exposed, Table 1 summarizes and explain each variable addressed throughout the paper.
Table 1 – Variable explanation 3.3 Model estimation
Hypotheses were tested by means of different regressions and Paired t Test models wherein we begin by modeling the logarithm of executive and CEO compensation. Concerning regression analysis, since both variables present an asymmetric distribution and a magnitude order incompatible to CEO power variable, the log application flats the sample, not damaging statistical properties. Such logarithm method mitigates heteroscedasticity resulting from extreme skewness, simultaneously facilitating the comparison of results towards previous studies (Firth et al., 2007; Murphy, 1999).
The Paired Samples t Test is useful to compare means for groups of outcomes that are achieved by making repeated measurements on the same group of observations whose results are assessed at two times, before versus after an intervention, or under two different treatment conditions (Warner, 2008).
Analyzing the data through a Paired Samples t Test allows identifying the part of the remuneration that is associated with individual differences among companies. As a result, it is possible to remove the variance due to individual differences among companies from the error term that is used to set up the t ratio. In practical terms, such procedure allows to segregate
Variables Explanation
DEtot total executive compensation by company/year
DEmax maximum individual compensation by company/year - also taken as CEO compensation DEtot_Inf the total executive compensation by company accounting inflation
DEmax_Inf the total CEO compensation by company accounting inflation
Ln_DEtot the napierian logarithm of the total executive compensation by company accounting inflation Ln_DEmax the napierian logarithm of the total CEO compensation by company accounting inflation CEOpwr DEtot/Dermax - also taken as a CEO power index by company/year
specific features of each company, evaluating exclusively the variance across groups.
Once the values changed through time, the variances of the groups are not exactly identical, which represents a threat to one of the t Test main assumptions. In face of this, a more sophisticated version of Paired t Test was implemented: the Welch’s t-test. At the same time it keeps the t Test essence, it is more suitable for the case of unequal variances, which makes the research more accurate (Welch, 1947).
For the purpose of the study, the fixed effect regression model keeps the model parameters at constant quantities throughout time. Contrasting to random effect models, in which parameters are taken as random variables, fixed effect models represent the subject-specific means. In practical terms, it means considering general features of the company stable throughout the analyzed period, avoiding any bias attached to generic features, such as size, assets, governance quality, and so on. Although one can argue that firm’s aspects have change, regarding the scope of this research, it is germane to keep them neutralized in order to isolate the crisis effect. Going further, broadly speaking, the variables corresponding to firm’s aspects did not change significantly throughout the period.
All the compensation values were adjusted considering the inflation in the period, given that from 2010 to 2016 it was accounted an inflation of 58.26%, based on IPCA (Aggregate Consumer Prices Index), which is a substantial change. Given that, values were balanced to 2016 patterns, i.e. not accounting 2016 inflation. As it shows table 2, inflation varied throughout the given years.
Table 2 - Inflation throughout period
4 Results
At first, considering the mentioned data, we present the average in each period for an introductory discussion. For analysis purpose, the data was divided in two groups, ranging from 2010-2013, a prosperous period, in which economy increases from 1.92% to 7.53%, and from 2014-2016, a retraction period, as previously mentioned. Table 2 exposes the results.
Year Inflation % Accumulated %
2016 6.29 58.26 2015 10.67 48.89 2014 6.41 34.54 2013 5.91 26.43 2012 5.84 19.38 2011 6.50 12.79 2010 5.91 5.91
DEtot DEmax DEtot_Inf DEmax_Inf Ln_DEtot Ln_DEmax CEOpower
2010-2013 R$ 6,752,840.19 R$ 669,027.74 R$ 8,228,798.17 R$ 801,997.57 15.77 14.06 11.91% 2014-2016 R$ 10,527,998.14 R$ 1,661,643.82 R$ 8,725,975.28 R$ 1,538,920.66 15.66 14.15 20.39%
As shown in the table 2, it is visible the substantial effect of the inflation throughout the period. Considering the data not accounting its influence over the values, it is visible the compensation increase from the range 2010-2013 to the range 2014-2016. Total executive compensation by company and total CEO compensation by company significantly rise throughout the recession period, growing around 55.90% and 148.36%, respectively. At the same time, also in a preliminary analysis, CEO power by company present a significant increase, from an average of 11.91% to 20.40%.
On the other hand, regarding inflation effects, which is going to be the main parameter of this article, it is visible a maintenance in the values comparing both periods. In other words, accounting the inflation effects, according to descriptive analysis, total executive compensation does not present any meaningful difference from the range 2010-2013 to the range 2014-2016. In the case of the total CEO compensation, although there is a compelling change from R$ 801,997.57 to R$ 1,538,920.66, when considered the logarithm values, such difference drops to 14.06 to 14.15, making it explicit the influence of outliers in the DEmax_Inf analysis.
Even though useful, the descriptive analyses are a preface for our deepest analysis, just giving an introductory illustration of data behavior throughout the period. Given that, in the hypothesis investigation, further statistical tools were applied, as it is discussed next.
In this sense, it is worth pointing out the panel structure of the used data. Since the panel data require the replication of the same units over time, it allows us to control for persistent unobserved characteristics of firms (Wooldridge, 2010), enabling us to control the potential biased problem caused by unobservable individual and time effects. Simultaneously, it demands more sophisticated statistical methods when compared to cross section data. In this study, as introduced before, it will be performed a Paired Samples t Test in order to assess whether mean scores on the quantitative outcome variables present different values according to their group. Such analyses are going to indicate the degree of difference between mean compensations and CEO power before and after the recession. For this purpose, the two groups data, classified from 2010 to 2013, and 2014 to 2016, were maintained.
As mentioned before, for the purpose of this study, from now on, all the data regarded in this paper account the inflation effect. Given that, variables tested are the total executive compensation by company accounting inflation, the total CEO compensation by company accounting inflation, the napierian logarithm of the total executive compensation by company accounting inflation, the napierian logarithm of the total CEO compensation by company accounting inflation, and the CEO power by company.
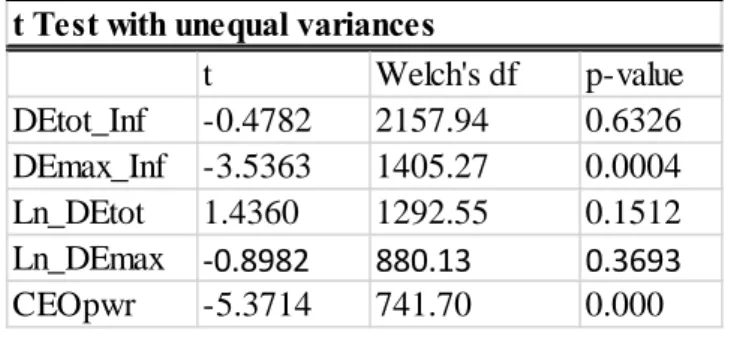
Table 4 - t Test
As it is visible on Table 4, the total executive compensation by company accounting inflation – DEtot_Inf - from period 2010-2013 to 2014-2016 seems to present no variation, confirming hypothesis 1 at 63.26% level of significance. Facing this result, is possible to affirm the total executive compensation before crisis and during crisis are consistently the same, which is endorsed by the napierian logarithm of the total executive compensation by company accounting inflation – LnDEtot - presenting a p-value of 15.12%.
On the other hand, the difference between the total CEO compensation by company accounting inflation – DEmax_Inf - from period 2010-2014 to period 2015-2017 does not seem to confirm the hypothesis 3 at a 5% confidence level. The Paired t Test indicated a p-value of 0.00%, which in a preliminary analyze allows to affirm that CEO compensation is statistically different in both periods. Conversely, the napierian logarithm of the total CEO compensation – LnDEmax - confirms the hypothesis 3, indicating the burden of outliers in this variable analysis. In face of this discrepancy, the CEO compensation either remained the same throughout the crisis, either increased, refuting optimal contracting theory theory prescriptions in both situations. In other words, concerning any comparative investigation of MPT and economic theory, although different results, both are against economic theory prescriptions, since the CEO compensation does not drop throughout economic retractions periods, as it is going to be further explored in the conclusion section.
Moving to more advanced statistical analysis, the fixed effects regression is performed in order to test hypothesis 2, 4, 5, and 6, according to previous explanations. The results are exposed in the table 4.
t Welch's df p-value DEtot_Inf -0.4782 2157.94 0.6326 DEmax_Inf -3.5363 1405.27 0.0004 Ln_DEtot 1.4360 1292.55 0.1512 Ln_DEmax ‐0.8982 880.13 0.3693 CEOpwr -5.3714 741.70 0.000
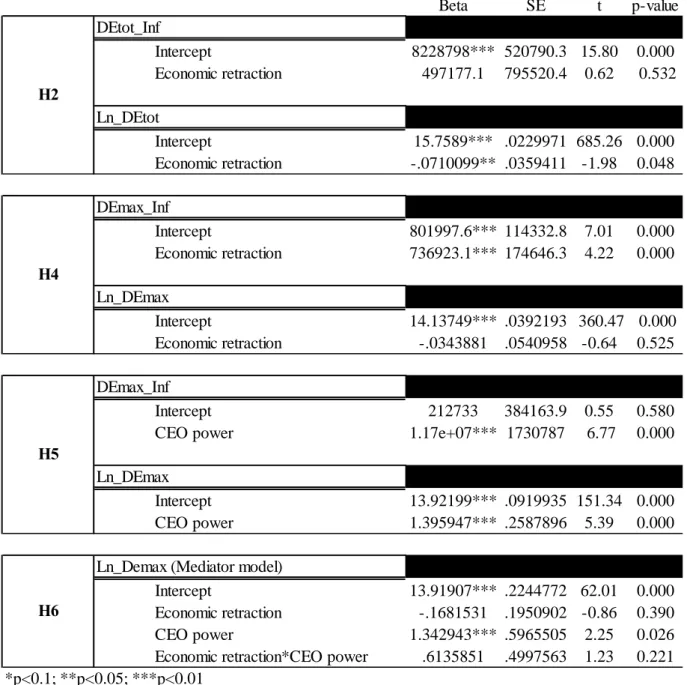
Table 5 - Regressions
The regression corresponding to hypothesis 2 evaluates the association between economic retraction and executive compensation, proposing that the economic recession is negatively associated to executive compensation. Such hypothesis is the more controversial among all, since values for the total executive compensation by company accounting inflation and the napierian logarithm of the total executive compensation by company accounting inflation, respectively - DEtot_Inf and Ln_DEmax - present different significances. As exposed in the table, the coefficient for the variable economic retraction towards the total executive compensation by company accounting inflation is not significant, therefore not confirming the proposed hypothesis, and signalizing there is not any relation between economic retraction and
Beta SE t p-value DEtot_Inf Intercept 8228798*** 520790.3 15.80 0.000 Economic retraction 497177.1 795520.4 0.62 0.532 Ln_DEtot Intercept 15.7589*** .0229971 685.26 0.000 Economic retraction -.0710099** .0359411 -1.98 0.048 DEmax_Inf Intercept 801997.6*** 114332.8 7.01 0.000 Economic retraction 736923.1*** 174646.3 4.22 0.000 Ln_DEmax Intercept 14.13749*** .0392193 360.47 0.000 Economic retraction -.0343881 .0540958 -0.64 0.525 DEmax_Inf Intercept 212733 384163.9 0.55 0.580
CEO power 1.17e+07*** 1730787 6.77 0.000
Ln_DEmax
Intercept 13.92199*** .0919935 151.34 0.000
CEO power 1.395947*** .2587896 5.39 0.000
Ln_Demax (Mediator model)
Intercept 13.91907*** .2244772 62.01 0.000
Economic retraction -.1681531 .1950902 -0.86 0.390
CEO power 1.342943*** .5965505 2.25 0.026
Economic retraction*CEO power .6135851 .4997563 1.23 0.221 *p<0.1; **p<0.05; ***p<0.01
H2
H4
H5
executive compensation. Otherwise, the coefficient for the variable economic retraction towards the napierian logarithm of the total executive compensation by company accounting inflation is significant and negative, therefore confirming the proposed hypothesis at a 5% significance level, and signalizing there is a negative relation between economic retraction and executive compensation.
At first, such distinction expresses the relevance of outliers in this sample, once the logarithm values reduce their influence on the analysis. In sequence, it is worth pointing out the extremely low size of the coefficient. A -0.07 coefficient indicates that in the economic retraction context the napierian logarithm of the total executive compensation by company accounting inflation decreases around 0.07, which is a meaningless change. In other words, although a statistically significant result, this coefficient is not relevant for any practical concern, thus configuring a marginal change. In face of it, the general interpretation for hypothesis 2 is that economic retraction is not consistently associated to executive compensation, which is also in line to t Test results.
A similar occurrence happens concerning hypothesis 4, which proposes the negative relation between economic retraction and CEO compensation. In this case, the relation between economic retraction and the total CEO compensation by company accounting inflation presents a significant and meaningful coefficient, indicating that throughout the crisis CEO compensation increased around R$ 736,923.10. Otherwise, the relation between economic retraction and the napierian logarithm of the total CEO compensation by company accounting inflation is not significant at all, presenting a p-value of 52.50%.
Such result, again, is aligned to previous t Test analysis and shows the burden of the outliers in sample. Precisely, it indicates that the different results are caused mostly by the increase of higher compensations, which are neutralized in the logarithmic analysis. By any means, since both analyses contradict hypothesis 4, in this case the general interpretation is that economic retraction is not negatively associated to CEO compensation.
In a broader analysis, one can even say that economic retraction is positively associated to CEO compensation, since total CEO compensation by company accounting inflation presents a significant and meaningful coefficient. Such scenario is deeply analyzed in the conclusion section, in which both findings are compared in light of MPT and economic theory. By the moment, it is relevant to keep in mind that both corroborate the MPT notion, signalizing that CEO compensation either increases either does not change throughout economic retraction periods.
Moving to the hypothesis 5, which proposes a positive association between CEO power and CEO compensation, in contrast to previous analysis, there is a compatibility between absolute and logarithm values. Given that, and considering the magnitude order of CEO power values, which ranges from 0 to 1, the napierian logarithm of the total CEO compensation by company accounting inflation is going to be used as focus variable.
As shown in the table, there is a significant and meaningful relationship between them. The positive coefficient points that the higher the CEO power, the higher the CEO compensation,
means that CEO power construct demonstrate a statistically consistent relation to the CEO compensation, raising evidences for the MPT notion that powerful executives are able to influence their remuneration, which will be deeply discussed further.
At last, hypothesis 6 proposes that economic retraction influences CEO compensation, in a relation mediated by CEO power. Precisely, such hypothesis investigates the mediation of CEO power between market forces and CEO compensation. As table shows, the analysis does not confirm mediation at a 5% significance level, thus contradicting the hypothesis and indicating economic retraction interaction with CEO power is not associated to CEO compensation. At the same time, taken aside, economic retraction also does not show a positive coefficient over CEO compensation, partly corroborating previous analysis, and indicating that economic retractions is not associated to CEO compensation in proposed the model compensation.
In contrast, CEO power is positive related to CEO compensation in the model at a 5% significance level, which is in line with previous regressions. Even so, the model as a whole is not statistically significant, therefore not only refuting hypothesis 6, but also evidencing the prevalence of CEO power over economical context in determining CEO compensation. By way of explanation, it suggests the predominance of CEO influence over contextual circumstances in the establishment of their own compensation packages, as it is deepen explained in the next section.
5 Discussion and conclusion
Our statistical analysis contradicts economic theory intuition, consistently showing that executive and CEO compensation remains steady throughout the Brazilian economic retraction period. It remains the same despite companies’ poor financial results and reduced investments (Oreiro, 2017), therefore suggesting the pervasiveness of protected compensation arrangements that are not susceptible to external oscillations.
From a broader perspective, this finding becomes even more relevant, as a good portion of the variable compensation executives receive is related directly to companies’ financial achievements (Pennings, 1993). A significant part of executive compensation—not only in Brazil, but also in other economies—comes from variable compensation, which is supposed to shift some of the shareholder risk to managers. Given the negative results companies experienced throughout the recession, the fact that executives’ compensation remained at the same level provides empirical evidence against optimal contracting theory. It also goes against agency theory, as shareholders’ interests, which are directly associated to company performance, are not associated to managers’ interests, which are directly associated to compensation (Steinberg, 2003).
At the same time, such results endorse MPT, suggesting that executives are able to shield their compensation packages. More specifically, in line with Bebchuck and Fried’s (2003) theory, their stable earnings, even during recession periods, strongly support the notion that executives have extensive power to establish favorable compensation policies, grabbing profits and overcoming shareholders’ interests. Instead of an efficient market mechanism, executive power plays a key role in shaping compensation in a favorable direction.
Developing this line of thought, executive compensation practices do not follow market oscillations, but present counter movements throughout economic retraction periods. While companies reduce investments, fire employees, and realize a decline in market value, executive compensation remains static. This contradicts economic theory, which predicts market optimal adjustments. In this sense, this study’s findings challenge the current prevailing conception, complicating the executive compensation question.
In sum, the results endorse MPT, raising clues against economic theory. To the extent that executive earnings are higher during recession periods, one can argue that executive compensation is not subject to market mechanisms, which leads to an imbalance between executive benefits and the national economy. In other words, the economic theory conception that compensation packages follow the optimal contracting approach is defied by the empirical recognition of compensation conservation, keeping in mind the whole divestment context experienced in the Brazilian economy during this period.
Concurrently, CEO power increases consistently throughout economic retraction periods, corroborating the MPT notion that CEO power is associated to CEO compensation. Expanding this view, increased compensation can be justified based on social-psychological structures in which boards hardly optimize executive contracting, resulting in arrangements favorable to CEO and executive interests, as advocated by MPT.
By extrapolating the relation between CEO power and CEO compensation, it is possible to explain the relation between CEO power and economic retraction through the same mechanisms. Based on optimal contracting premises, we would expect CEO power to decline throughout crisis periods, or at least to maintain the same level, since there should be a greater supply of qualified executives on the market during these periods. Given the rise of CEO power even through economic retraction periods, the notion that top executives enjoy social-psychological instruments—such as availability heuristics, affect heuristics, and even closeness/companionship relations—is clear, making explicit board infectiveness in pursuing an optimal contract.
Again, it is worth pointing out that the Brazilian context has some unique features— features that are not found in developed economies—that challenge our results. Considering that institutions have strong power in shaping mechanisms of governance and influencing and structuring collective action (Young, 2008), Brazil’s poor institutional context makes monitoring more difficult and costly, which affects the design of compensation packages (North, 1991; Williamson, 1975; Wright et al., 2005). In this sense, a weak institutional environment emerges, setting up as a main distinction when compared to American and European contexts. In the face of weak institutions, which represent a lack of restraint toward top management actions, executives have a free path to draw favorable compensation packages, therefore increasing their profits and reducing their risks, to the expenses of the shareholder.
Nevertheless, it is not only executive power that is responsible for economic theory maladjustment in explaining executive compensation. There are additional elements, such as the large global peer influence permeating executive compensation standards, for instance, that influence these arrangements (Chen et al., 2010). According to the authors, compensation
investment dissemination, therefore creating an intense isomorphic pressure on executive pay levels. Although a distinct explanation, the authors also emphasize the optimal contracting model inconsistency, since market forces are not able to adjust salaries in accordance with companies’ performance and shareholders’ interests.
Finally, this paper not only challenges optimal contracting theory, but also sheds new light on the executive compensation debate by providing consistent empirical findings. While it examines executive compensation trends throughout crises, it also proposes a model to unveil executive compensation determinants. Such a model exposes the relevance of CEO power, which can be extrapolated to executive power as a whole, in establishing top management compensation. To the extent that the model finds a lack of association between CEO compensation and the national economic context, it challenges traditional economic theory, thus contributing to the executive compensation literature and defining a fruitful path for further research in the field.
6 References
Balkin, D. B., & Gomez‐Mejia, L. R. (1990). Matching compensation and organizational strategies. Strategic Management Journal, 11(2), 153-169.
Barkema, H. G., & Gomez-Mejia, L. R. (1998). Managerial compensation and firm performance: a general research framework. Academy of Management Journal, 41(2), 135-145.
Beatty, R. P., & Zajac, E. J. (1990, August). Top management incentives, monitoring, and risk-bearing: a study of executive compensation, ownership, and board structure in initial public offerings. In Academy of Management Proceedings (Vol. 1990, No. 1, pp. 7-11). Briarcliff Manor, NY 10510: Academy of Management.
Bebchuk, L. A., Cremers, K. M., & Peyer, U. C. (2011). The CEO pay slice. Journal of Financial Economics, 102(1), 199-221.
Bebchuk, L. A., & Fried, J. M. (2003). Executive compensation as an agency problem. Journal of Economic Perspectives, 17(3), 71-92.
Bebchuk, L., & Fried, J. (2005). Pay without performance: The unfulfilled promise of executive compensation. International Company and Commercial Law Review, 16(11), 461.
Bertrand, M., & Mullainathan, S. (2001). Are CEOs rewarded for luck? The ones without principals are. The Quarterly Journal of Economics, 116(3), 901-932.
Blair, R. C., & Higgins, J. J. (1980). A comparison of the power of Wilcoxon's rank-sum statistic to that of student's t statistic under various nonnormal distributions. Journal of Educational Statistics, 5(4), 309-335.
Chen, J. J., Liu, X., & Li, W. (2010). The effect of insider control and global benchmarks on Chinese executive compensation. Corporate Governance: An International Review, 18(2), 107-123.
Chizema, A., Liu, X., Lu, J., & Gao, L. (2015). Politically connected boards and top executive pay in Chinese listed firms. Strategic Management Journal, 36(6), 890-906.
Chng, D. H. M., Rodgers, M. S., Shih, E., & Song, X. B. (2012). When does incentive compensation motivate managerial behaviors? An experimental investigation of the fit between incentive compensation, executive core self‐evaluation, and firm performance. Strategic Management Journal, 33(12), 1343-1362.
Ciscel, D. H., & Carroll, T. M. (1980). The determinants of executive salaries: An econometric survey. The Review of Economics and Statistics, 7-13.
Conyon, M. J. (2006). Executive compensation and incentives. The Academy of Management Perspectives, 20(1), 25-44.
Conyon, M. J. (1997). Corporate governance and executive compensation. International journal of industrial organization, 15(4), 493-509.
Correa, R., & Lel, U. (2016). Say on pay laws, executive compensation, pay slice, and firm valuation around the world. Journal of Financial Economics, 122(3), 500-520.
Devers, C. E., Cannella Jr, A. A., Reilly, G. P., & Yoder, M. E. (2007). Executive compensation: A multidisciplinary review of recent developments. Journal of Management, 33(6), 1016-1072. Ezzamel, M., & Watson, R. (1998). Market comparison earnings and the bidding-up of executive cash compensation: Evidence from the United Kingdom. Academy of Management Journal, 41(2), 221-231.
Fama, E. F. (1980). Agency problems and the theory of the firm. Journal of Political Economy, 88(2), 288-307.
Fay, M. P., & Proschan, M. A. (2010). Wilcoxon-Mann-Whitney or t-test? On assumptions for hypothesis tests and multiple interpretations of decision rules. Statistics Surveys, 4, 1.
Fiani, R., Kupfer, D., & Hasenclever, L. (2002). Teoria dos custos de transação. Economia Industrial.
Finkelstein, S., & Hambrick, D. C. (1989). Chief executive Compensation: A study of the intersection of markets and political processes. Strategic Management Journal, 10(2), 121-134. Finkelstein, S., Hambrick, D. C., & Cannella, A. A. (2009). Strategic Leadership: Theory and research on executives, top management teams, and boards. Strategic Management Journal. Oxford, UK: Oxford University Press.
Firth, M., Fung, P. M., & Rui, O. M. (2007). How ownership and corporate governance influence chief executive pay in China's listed firms. Journal of Business Research, 60(7), 776-785.
Goergen, M., & Renneboog, L. (2011). Managerial compensation. Journal of Corporate Finance, 17(4), 1068-1077.
Gomez-Mejia, L. R., Tosi, H., & Hinkin, T. (1987). Managerial control, performance, and executive compensation. Academy of Management Journal, 30(1), 51-70.
Greckhamer, T. (2016). CEO compensation in relation to worker compensation across countries: The configurational impact of country‐level institutions. Strategic Management Journal, 37(4), 793-815.
Hoskisson, R. E., Castleton, M. W., & Withers, M. C. (2009). Complementarity in monitoring and bonding: More intense monitoring leads to higher executive compensation. The Academy of Management Perspectives, 23(2), 57-74.
Jacquart, P., & Armstrong, J. S. (2013). The ombudsman: are top executives paid enough? An evidence-based review. Interfaces, 43(6), 580-589.
Jensen, M. C., & Meckling, W. H. (1976). Theory of the firm: Managerial behavior, agency costs and ownership structure. Journal of Financial Economics, 3(4), 305-360.
Kaplan, S. N. (2008). Are US CEOs Overpaid? The Academy of Management
Perspectives, 22(2), 5-20.
Kaplan, S. N., & Rauh, J. (2009). Wall Street and Main Street: What contributes to the rise in the highest incomes? The Review of Financial Studies, 23(3), 1004-1050.
Locke, E. A. (2008). The immoral assault on CEO pay. The Academy of Management Perspectives, 22(3), 3-4.
La Porta, R., Lopez-de-Silanes, F., Shleifer, A., & Vishny, R. (2002). Investor protection and corporate valuation. The Journal of Finance, 57(3), 1147-1170.
Malmendier, U., & Tate, G. (2009). Superstar CEOs. The Quarterly Journal of Economics, 124(4), 1593-1638.
Murphy, K. J., & Zábojník, J. (2004). CEO pay and appointments: a market-based explanation for recent trends. The American Economic Review, 94(2), 192-196.
Murphy, K. J. (1999). Executive compensation. Handbook of labor economics, 3, 2485-2563. Nichols, D., & Subramaniam, C. (2001). Executive compensation: Excessive or equitable? Journal of Business Ethics, 29(4), 339-351.
North, D. C. (1991). Institutions. Journal of Economic Perspectives, 5(1), 97-112.
Oreiro, J. L. (2017). A grande recessão brasileira: diagnóstico e uma agenda de política econômica. Estudos Avançados, 31(89), 75-88.
Pennings, J. M. (1993). Executive reward systems: a cross‐national comparison. Journal of Management Studies, 30(2), 261-280.
Pfeffer, J., & Jeffrey, P. (1998). The human equation: Building profits by putting people first. Harvard Business Press.
Rediker, K. J., & Seth, A. (1995). Boards of directors and substitution effects of alternative governance mechanisms. Strategic Management Journal, 16(2), 85-99.
Safatle, C., Borges, J., & Oliveira, R. (2016). Anatomia de um desastre: Os bastidores da crise econômica que mergulhou o país na pior recessão da história. Portfolio-Penguin.
Sawilowsky, S. S. (2005). Misconceptions leading to choosing the t test over the Wilcoxon Mann-Whitney test for shift in location parameter.
Shin, T. (2014). Explaining pay disparities between top executives and nonexecutive employees: A relative bargaining power approach. Social Forces, 92(4), 1339-1372.
Steinberg, H. (2003). A dimensão humana da governança corporativa: pessoas criam as melhores e as piores práticas. Editora Gente.
Su, Z., Li, Y., & Li, L. (2010). Ownership concentration and executive compensation in emerging economies: evidence from China. Corporate Governance: The international Journal of Business in Society, 10(3), 223-233.
Teagarden, M. B., Von Glinow, M. A., & Mellahi, K. (2018). Contextualizing international business research: Enhancing rigor and relevance. Journal of World Business, 53(3), 303-306. Van Essen, M., Otten, J., & Carberry, E. J. (2015). Assessing managerial power theory: A meta-analytic approach to understanding the determinants of CEO compensation. Journal of Management, 41(1), 164-202.
Von Glinow, M. A., & Teagarden, M. B. (2009). The future of Chinese management research: Rigour and relevance redux. Management and Organization Review, 5(1), 75-89.
Walsh, J. P. (2008). CEO compensation and the responsibilities of the business scholar to society. The Academy of Management Perspectives, 22(2), 26-33.
Warner, R. M. (2008). Applied statistics: From bivariate through multivariate techniques. Sage. Welch, B. L. (1947). The generalization ofstudent's' problem when several different population variances are involved. Biometrika, 34(1/2), 28-35.
Willard, W. (2014). Throwing out the baby and weighing the bathwater: The nonsense of Executive compensation oversight.
Wright, M., Filatotchev, I., Hoskisson, R. E., & Peng, M. W. (2005). Strategy research in emerging economies: Challenging the conventional wisdom. Journal of Management Studies, 42(1), 1-33.
Wooldridge, J. M. (2010). Econometric analysis of cross section and panel data. MIT press. Yermack, D. (2006). Golden handshakes: Separation pay for retired and dismissed CEOs. Journal of Accounting and Economics, 41(3), 237-256.
Young, O., King, L., Galaz, V., & Hahn, T. (2008). Institutions and environmental change: principal findings, applications, and research frontiers (pp. 255-272). O. R. Young, L. A. King, & H. Schroeder (Eds.). Cambridge, MA: MIT press.
Young, M. N., Peng, M. W., Ahlstrom, D., Bruton, G. D., & Jiang, Y. (2008). Corporate governance in emerging economies: A review of the principal–principal perspective. Journal of Management Studies, 45(1), 196-220.
Zajac, E. J., & Westphal, J. D. (1994). The costs and benefits of managerial incentives and monitoring in large US corporations: When is more not better? Strategic Management Journal, 15(S1), 121-142.