Original Article
BODY DISSATISFACTION AND ANTHROPOMETRIC MEASURES AMONG ADOLESCENTS FROM JUIZ DE FORA-MG, IN SOCIOECONOMIC
VULNERABILITY
INSATISFAÇÃO CORPORAL E MEDIDAS ANTROPOMÉTRICAS DE ADOLESCENTES EM VULNERABILIDADE SOCIOECONÔMICA DE JUIZ DE FORA-MG
Maria Elisa Caputo Ferreira1, Fabiane Frota da Rocha Morgado2, Clara Mockdece Neves1, Jairo José Monteiro Morgado3and Juliana Fernandes Filgueiras Meireles1
1
Universidade Federal de Juiz de Fora, Juiz de Fora-MG, Brasil. 2
Universidade Federal Rural University of Rio de Janeiro, Seropédica-RJ, Brasil. 3
Centro de Treinamento Físcio do Exército, Rio de Janeiro-RJ, Brasil.
RESUMO
Este estudo objetivou investigar a insatisfação corporal de adolescentes em situação de vulnerabilidade socioeconômica e verificar possíveis associações com indicadores antropométricos autorreferidos e aferidos (massa corporal, estatura e IMC). Participaram 204 adolescentes, 78 meninas, entre 10 a 14 anos de idade (11,9+1,55). Massa corporal e estatura foram aferidas e autorreferidas. A insatisfação corporal foi avaliada por meio da Escala de Silhuetas Brasileiras para Crianças. Foram encontrados níveis de insatisfação corporal (82,8%) em ambos os sexos, sendo que meninas e meninos não se diferenciaram quanto aos níveis de insatisfação (p=0,10). Em ambos os sexos, a massa corporal (p=0,05 em meninas; p=0,0339 em meninos) e a estatura (p=0,0086 em meninas; p=0,0001 em meninos) aferidas foram significantemente diferentes das mesmas medidas autorreferidas. Insatisfação corporal relacionou-se positiva e significantemente ao IMC aferido (rs=0,55, p<0,0001), mas não ao autorreferido (rs=-0,0324, p=0,645). Concluiu-se que as medidas autorreferidas não representaram realisticamente os dados aferidos, devendo ser utilizadas com cautela em estudos futuros que abarquem insatisfação corporal de adolescentes em vulnerabilidade socioeconômica.
Palavras-chave: Imagem corporal. Estado nutricional. Vulnerabilidade social.
ABSTRACT
This study aimed to investigate body dissatisfaction among adolescents in social vulnerability and to verify possible associations with self-reported and measured anthropometric data (weight, height and BMI). A total of 204 adolescents participated, being 78 girls and 126 boys aged 10 to 14 years old (11.9+1.55). Body weight and height were measured and self-reported. Body dissatisfaction was assessed by the Brazilian Silhouette Scale for Children. Body dissatisfaction levels were found (82.8%) in both sexes, wherein girls and boys did not differ as to dissatisfaction (p=0.10). In both sexes, measured body mass (p=0.05 in girls; p=0.0339 in boys) and height (p=0.0086 in girls; p=0.0001 in boys) were significantly different from self-reported body mass and height. Body dissatisfaction related positively and significantly to measured BMI (r=0.55, p<0.0001), but not to self-reported BMI (rs=-0.0324, p=0.645). In conclusion, self-reported measures did not represent measured data realistically and should be used with caution in future studies addressing body dissatisfaction among adolescents in social vulnerability.
Keywords: Body image. Nutritional status. Social vulnerability.
Introduction
Body image is one’s mental representation of his or her own body5. It is a complex phenomenon, constantly changing, constructed and structured in continuous contact with the world6. Body dissatisfaction is part of this construct and refers to any negative thoughts and feelings about one’s own body or physical appearance3. In addition, it can be understood as a discrepancy between the perception that the individual has of his or her real and ideal body7.
Research indicates high levels of body dissatisfaction in adolescents of both sexes 8-10
. Socioeconomic status has been pointed out as an important issue that affects body dissatisfaction11-13. However, few studies have considered this relationship and presented controversial results. Pereira et al.13 found that adolescents from higher economic classes showed greater dissatisfaction with their thinness, while those from lower classes were dissatisfied with their excessive weight. Other investigations have shown that this association is not totally correct, having little or no effect derived from one’s social class11,12. It is worth highlighting that these studies used different means to classify the individuals’ socioeconomic level, and the number of adolescents from lower classes was limited. Thus, the literature is still restricted in the sense of verifying body dissatisfaction in adolescents in situations of socioeconomic vulnerability.
Moreover, the literature shows that the higher the Body Mass Index (BMI), the higher the levels of body dissatisfaction14,15. About adolescents, studies have used body mass and height data, both measured15-17 and self-reported18,19. However, no research that assessed the discrepancy between the different ways of obtaining this data was identified. In addition, for adolescents in situations of socioeconomic vulnerability, little is known about self-reported and measured anthropometric indicators, as well as their correlation with body dissatisfaction.
Considering the knowledge gap regarding the assessment of body dissatisfaction among youths from lower economic classes, as well as the comparison of self-reported and measured anthropometric indicators, the objective of this study was to investigate body dissatisfaction among adolescents in situations of socioeconomic vulnerability and to verify possible associations with self-reported and measured anthropometric data (body mass, height and BMI).
Methods
This is a cross-sectional, quantitative investigation20. It began after the approval of the Ethics Committee on Research with Human Beings of the Federal University of Juiz de Fora, under legal opinion No 130.944, approved on 18/10/2012.
Participants
The initial sample consisted of 350 youths in the initial stage of adolescence (10 to 14 years old), as per the WHO21, from the eight units of the Socio-Educational Service of the Municipal Association for Community Support [Associação Municipal de Apoio Comunitário] (AMAC)/Social Assistance Secretariat [Secretaria de Assistência Social] (SAS) of the Municipality of Juiz de Fora-MG [Prefeitura de Juiz de Fora] (PJF). This service is aimed at the social protection of children and adolescents, offering social, artistic, sports and interactive activities outside school hours. To be users of this project, beneficiary families must be classified as “Class E”, as per the “Brazilian Economic Classification Criterion”22, and be recipients of the “Bolsa Família” (Family Allowance), a welfare program of the Brazilian Federal Government.
(FICF). On the other hand, it excluded individuals who: (1) did not know how to answer the instrument used; (2) missed or quit the research during its conduction; and (3) did not return the FICF duly signed.
After the exclusion criteria were applied, the final sample was composed of 204 adolescents, being 78 girls and 126 boys. The participants were aged between 10 and 14 years old. The mean age was 11.92 years (SD=1.55).
Instruments
Brazilian Silhouette Scale for Children23: Scale consisting of 11 cards representing the biotype of children/adolescents, different for each sex. The figures oscillate in body dimensions and shapes, comprehending those with the lowest BMI (figure 1) to those with the highest BMI (figure 11). The BMI means corresponding to each figure vary from 12 to 29 kg/m2. The objective of the Scale is to assess body dissatisfaction through the discrepancy between the silhouette chosen as representative of one’s real body and the one chosen to represent his or her ideal body. The greater the discrepancy, the greater the level of dissatisfaction. If the silhouettes chosen as representatives of one’s real and ideal bodies are the same, then that person is satisfied with his or her body dimensions. In its validation study23, the scale presented good test-retest reliability parameters (r=0.61, p<0.01), tested with a sample of 69 children/adolescents (7 to 12 years old) and positive and significant convergent validity for both girls (r=0.57, p<0.01) and boys (r=0.64, p <0.01).
Scale and stadiometer: To measure body mass, the Tanita portable electronic scale was used, with a precision of 0.1kg. For height analysis, a Tonelli portable stadiometer was used, with a precision of 0.1 cm. To measure BMI, the traditional body mass/height formula2 was applied. Measured BMI values were classified with cutoff points usually reported in the literature: underweight (BMI <18.5 kg/m2), normal weight (BMI between 18.5 and 24.9 kg/m2) and overweight (BMI ≥ 25 kg/m2)24,25.
Sociodemographic questionnaire: Instrument adopted to access self-reported sex, age, body mass and height data (for self-reported BMI calculation).
Procedures
First, the coordination of the participating social projects was contacted for explanation of study objectives and methods, as well as authorization request for the research. After acceptance, a schedule was defined for data collection at the eight units. In the first contact with the adolescents, a brief explanation was given about the research, and the FICF was handed out, which should be signed by their parents or guardians and then returned the next day. The procedures were completed only after the FICF was returned. It is worth mentioning that data collection was divided in two moments; on the first day, the sociodemographic questionnaire and the Silhouette Scale were applied, and, on the second day, anthropometric assessments were carried out, always by the same researcher, who had a Physical Education degree. Collections happened in the first half of 2014, in the city of Juiz de Fora, MG.
Statistical analysis
The data were carefully tabulated and organized by sex. After descriptive statistics, data normality was checked using the Kolmogorov-Smirnov test. Non-normal distribution was identified and, for this reason, non-parametric tests were used for all analyses.
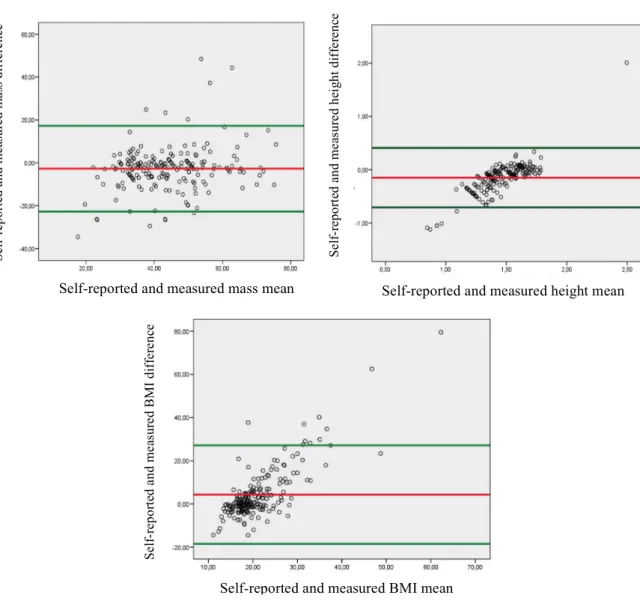
silhouette), Spearman’s rank correlation coefficient (rs) was applied. To assess differences between body mass, height and self-reported and measured BMI, the Wilcoxon non-parametric test was used for related samples. Also, Bland-Altman plots26 were used to illustrate graphically the agreement between self-reported and measured indicators (body mass, height and BMI). The limits of agreement lines show where 95% of the individual observations should be. Outliers are shown outside the limits of agreement lines. Finally, the Kruskal Wallis test was applied to measure differences as to dissatisfaction level between three groups: underweight, normal weight and overweight.
The level of significance adopted in all analyses was p<0.05. The SPSS 19.0 program was used in the analyses.
Results
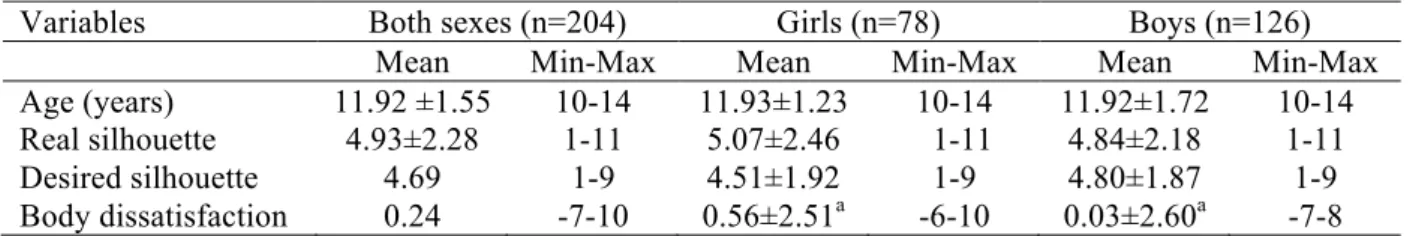
The general characteristics of the sample are displayed in Table 1. Regarding the comparison of body dissatisfaction means, there was no significant difference between sexes (p=0.10). Thus, it is understood that the level of body dissatisfaction was similar in the boys and girls assessed.
Table 1. Sample general characterization.
Note: n = sample size; a= comparison between sexes (p=0.10). Source: The authors
Table 2 shows a comparison between the means of measured and self-reported anthropometric data. Significant differences were identified for body mass, height and BMI in the total sample, in girls and boys. This indicates that the assessed adolescents failed to report their anthropometric measures reliably, underestimating them most of the time.
Table 2. Comparison of the means of measured and self-reported anthropometric data.
Note: SD=Standard deviation; BMI=Body Mass Index; *=significant for p<0.05. Source: The authors.
Figure 1 displays the Bland-Altman plot26 for body mass, height, and BMI (measured and self-reported). For body mass (upper left), the mean difference is -2.72 (limit of agreement= -22.73, 17.29). For height (upper right), the mean difference is -0.14 (limit of
Variables Both sexes (n=204) Girls (n=78) Boys (n=126)
Mean Min-Max Mean Min-Max Mean Min-Max
Age (years) 11.92 ±1.55 10-14 11.93±1.23 10-14 11.92±1.72 10-14
Real silhouette 4.93±2.28 1-11 5.07±2.46 1-11 4.84±2.18 1-11
Desired silhouette 4.69 1-9 4.51±1.92 1-9 4.80±1.87 1-9
Body dissatisfaction 0.24 -7-10 0.56±2.51a -6-10 0.03±2.60a -7-8
Self-reported data Mean±SD
Measured data Mean±SD
p
Total sample body mass 42.37±13.68 45.10±11.63 0.0001*
Girl body mass 43.92±12.19 46.51±11.35 0.05*
Boy body mass 41.43±14.48 44.23±11.76 0.0339*
Total sample height 1.38±0.32 1.53±0.11 0.0001*
Girl height 1.46±0.33 1.54±0.08 0.0086*
Boy height 1.33±0.30 1.54±0.08 0.0001*
Total sample BMI 30.82±71.47 18.94±3.30 0.0001*
Girl BMI 25.76±38.70 19.42±3.52 0.0001*
agreement= 0.70, 0.40). For BMI (lower) the mean difference is 4.32 (limit of agreement= -18.50, 27.16). The high mean differences, mainly body mass and BMI, indicate low agreement between measured and self-reported data.
Figure 1. Bland-Altman plots for total sample (n=204). The upper plot on the left refers to body mass. The upper plot on the right refers to height. The last one refers to BMI.
Source: The authors
Table 3 describes the participants as to categorical variables. There is a high percentage of body dissatisfaction among them (82.8%), with the majority of girls wanting a skinnier body (62.0%), while, among boys, 51.4% desired greater body dimensions. Concerning nutritional status (NS) groups, the majority of the sample is underweight (51.9%).
Self-reported and measured height mean
Self-reported and measured BMI mean Self-reported and measured mass mean
Table 3. Sample description by categorical variables.
Variables Both sexes (n=204) Girls (n=78) Boys (n=126)
n(%) n(%) n(%)
Body satisfaction 35 (17.2%) 12 (15.4%) 23(18.3%)
Total body dissatisfaction 169 (82.8%) 66 (84.6%) 103 (81.7%)
Dissatisfaction with thinness 77 (45.5%) 25 (38.0%) 53 (51.4%)
Dissatisfaction with fat 92 (54.5%) 41 (62.0%) 50 (48.6%)
Underweight measured NS 106 (51.9%) 38 (48.8%) 68 (53.9%)
Adequate measured NS 82 (40.6%) 31 (39.7%) 51 (40.5%)
Overweight measured NS 16 (7.5%) 9 (11.5%) 7 (5.6%)
Note: n = absolute sample; %=relative sample; NS=Nutritional status. Source: The authors.
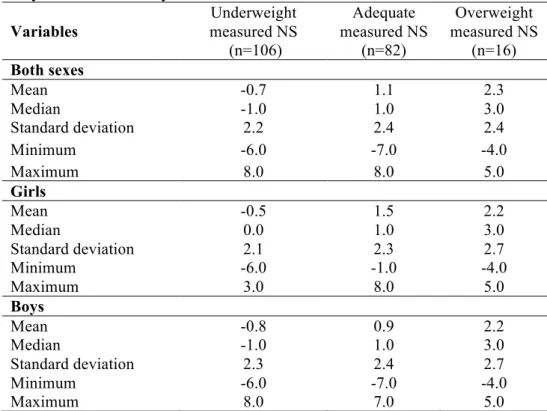
Comparing the three groups by nutritional status, regarding body dissatisfaction, there was a difference between them (p<0.0001) in the analysis of both girls and boys. Overweight individuals were more dissatisfied, and those with adequate weight, less dissatisfied. It is noted that underweight individuals remained with intermediate dissatisfaction. Table 4 presents these values on body dissatisfaction. Positive values indicate a desire to reduce body silhouette, while negative values, to increase it.
Table 4. Body dissatisfaction by nutritional status.
Note: n = absolute sample; NS=Nutritional Status. Source: The authors.
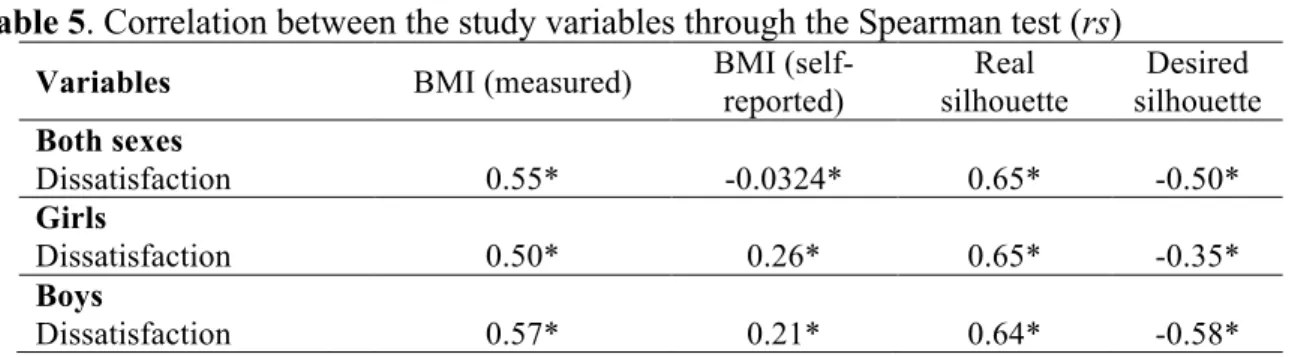
Positive, significant and moderate correlations were found27, both between body dissatisfaction and BMI (measured), and between dissatisfaction and real silhouette in both sexes, among girls and among boys. There were also significant, negative, and weak and moderate correlations27 between dissatisfaction and desired silhouette also in the groups assessed. However, no significant relationship was found between dissatisfaction and self-reported BMI. Table 4 details these results.
Variables
Underweight measured NS
(n=106)
Adequate measured NS
(n=82)
Overweight measured NS
(n=16)
Both sexes
Mean -0.7 1.1 2.3
Median -1.0 1.0 3.0
Standard deviation 2.2 2.4 2.4
Minimum -6.0 -7.0 -4.0
Maximum 8.0 8.0 5.0
Girls
Mean -0.5 1.5 2.2
Median 0.0 1.0 3.0
Standard deviation 2.1 2.3 2.7
Minimum -6.0 -1.0 -4.0
Maximum 3.0 8.0 5.0
Boys
Mean -0.8 0.9 2.2
Median -1.0 1.0 3.0
Standard deviation 2.3 2.4 2.7
Minimum -6.0 -7.0 -4.0
Table 5. Correlation between the study variables through the Spearman test (rs)
Variables BMI (measured) BMI (self-reported)
Real silhouette
Desired silhouette
Both sexes
Dissatisfaction 0.55* -0.0324* 0.65* -0.50*
Girls
Dissatisfaction 0.50* 0.26* 0.65* -0.35*
Boys
Dissatisfaction 0.57* 0.21* 0.64* -0.58*
*p<0.05; measured BMI – based on measured body mass and height; self-reported BMI – based on self-reported body mass and height.
Source: The authors.
Discussion
This study had as premise to investigate body dissatisfaction among adolescents in situation of socioeconomic vulnerability from the city of Juiz de Fora-MG, associating it with self-reported and measured anthropometric indicators. The fact that the present research took into account a population with specific characteristics and little investigated by previous researches reinforces its relevance.
The data from the present study indicated that body dissatisfaction was a preponderant factor among the participants, since the majority of the adolescents, whether in the analysis of the total population (82.8%) or specific population (girls=84.6% and boys=81.7%), is dissatisfied. These data are alarming in that, according to the Statistic Manual of Mental Disorders28, a negative body image is considered a diagnostic criterion for the development of eating disorders such as anorexia nervosa and bulimia nervosa.
Similar findings have been reported in studies that have also assessed body dissatisfaction by means of silhouette scales14,29. Corseuil et al.29 observed, in girls aged 10 to 17 years old, 85% of dissatisfaction with body image. In boys aged 7 to 17 years old, Fidelix et al.14 reported a prevalence of 74.7% of dissatisfaction. Different hypotheses may explain the high indexes found. At first, the use of the silhouette scale may overestimate dissatisfaction, since, if the individual chooses as ideal a silhouette different from that considered as real, he or she is automatically considered dissatisfied30. That is, by this method of assessment, any difference between the real and the desired silhouette is considered as dissatisfaction with one’s current physical appearance.
As seen in Table 3, most girls in the present study want a smaller silhouette, while most of the boys, a larger one. These findings are in line with past Brazilian studies such as that developed by Petroski, Pelegrini and Glaner9, who investigated adolescents aged 11 to 19 and found, for boys, a desire to increase their body silhouette, while girls would like to reduce it. Pereira et al.13 identified in girls aged 9 to 15 years old a desire for bodies with lower BMI levels, while boys of the same age wanted stronger bodies. Graup et al.31, assessing youths aged 9 to 16, corroborate these findings, verifying that, compared to girls, boys seek bigger silhouettes. It is possible that these findings are due to cultural factors that value thinness as ideal for women and muscles for men3,32.
About the findings by nutritional status classification, most participants were underweight. It can be considered that this percentage was high compared to other studies, such as that by Dunker, Fernandes and Carreira Filho11, which found a prevalence of 17.2% of underweight adolescents. In addition, as for the “overweight” classification, only 7.5% of the investigated adolescents fit in this category. This prevalence is below those observed by previous studies, which were closer to 15%11,14,31. According to Dunker, Fernandes and Carreira Filho11, the prevalence of overweight tends to be higher in individuals with better access to foods, from higher social classes, and, similarly, the prevalence of underweight tends to be higher in lower social classes. This point is particularly important as underweight participants, as well as overweight ones, presented the highest rates of body dissatisfaction when compared to normal-weight adolescents.
A positive and significant correlation was found between body dissatisfaction and measured BMI in the total sample, in girls and boys. In the same way, moderate and significant associations27 were also found between body dissatisfaction and silhouette chosen as real body in these groups. It can be deduced from these results that adolescents who had larger body proportions and/or who perceived their bodies with larger body dimensions were those that presented higher levels of dissatisfaction. Furthermore, body dissatisfaction was negatively associated with the desired silhouette; the greater the dissatisfaction, the smaller the ideal silhouette, especially when the analysis was done for both sexes and for boys. Altogether, these results corroborate previous studies by Fidelix et al.14, considering boys aged 7 to 17 years old, and Miranda et al.15, assessing adolescents between the ages of 10 and 19 of both sexes. These authors pointed out that the desire for a skinnier body is more prevalent in adolescents with high BMI; therefore, the higher the BMI, the higher the levels of body dissatisfaction14,15.
Based on these findings, body dissatisfaction and self-reported BMI were not significantly correlated in the total sample, in girls and boys. One possible explanation for this outcome arises from the fact that self-reported body mass and height were significantly different from measured body mass and height. Although the initial hypothesis that self-reported BMI would be valid for use in the anthropometric classification, the results of the present study showed otherwise. Previous research has found little discrepancy between measured and self-reported data35,36. It seems that the situation of socioeconomic vulnerability in which the adolescents of the present study live interferes with this correlation. A hypothesis that perhaps explains this finding is the difficulty of the assessed adolescents in reporting their anthropometric measures for not having access (or having limited access) to measurement tools (scales and stadiometers). Or also, these youths may not be effectively concerned with these measures, because their socioeconomic problems (such as extreme poverty, lack of basic sanitation, need to work from an early age) take most of their time, so they are not attentive to this measurement. Finally, it is possible that they do not have a culture of assessment of these measures, so they can live in communities that, culturally, do not value the assessment of body mass and height.
However, it should be noted that this instrument has been widely recommended in studies that recruit a large number of participants, because it is low cost and quick and easy to apply.
Conclusions
The present research sought to fill the knowledge gap with regard to the assessment of body dissatisfaction in youths from lower economic classes, as well as the comparison of self-reported and measured anthropometric indicators. The results suggest high body dissatisfaction in the adolescents of both sexes, without significant differences between boys and girls. This information is of the utmost importance for professionals from different areas who work with adolescents, especially those from health and education fields. Considering that body dissatisfaction may lead to the development of serious psychopathological disorders, the articulation of effective intervention strategies is vital, such as practice of physical exercises with a focus on wellbeing, aiming at the treatment and prevention of body dissatisfaction in adolescents in situation of socioeconomic vulnerability.
On the other hand, the findings of this study showed that self-reported and measured body mass and height were different; consequently, self-reported and measured BMI differed as well. This implies that the use of self-reported anthropometric measures (body mass and height) in populations of lower economic classes should be performed with caution, since the data may produce inconsistent results. Further studies should be conducted to assess other variables that may interfere with the body image of these adolescents such as risk behavior for eating disorders, media influence and self-esteem. It is worth stressing that future investigations will enable a broader and deeper knowledge of anthropometric, affective and cognitive aspects of young individuals that deserve attention on the part of professionals who deal directly with them.
References
1. Papalia DE, Olds SW, Feldman RD. Desenvolvimento humano. 10a ed. São Paulo: Artmed; 2008. 2. Miranda VPN, Conti MA, Carvalho PHB, Bastos RR, Ferreira MEC. Body image in different periods of
adolescence. Rev Paul Pediatr. 2014; 32(1): 63-69.
3. Ferreira MEC, Castro MR, Morgado FFR. Imagem Corporal: Reflexões, diretrizes e práticas de pesquisa. Juiz de Fora: Editora UFJF; 2014.
4. Conti MA. Os aspectos que compõem o conceito de imagem corporal pela ótica do adolescente. Rev Bras Crescimento Desenvolvimento Human. 2008; 18(3): 240-253.
5. Schilder P. A imagem do corpo: as energias construtivas da psique. 3a ed. São Paulo: Martins Fontes; 1999. 6. Slade PD. What is body image? Behav Res Ther. 1994; 32(5): 497-502.
7. Morgado FFR, Ferreira ME, Campana AN, Rigby AS, Tavares MCGCF. Initial evidence of the reliability and validity of a Three-dimensional Body Rating Scale for the congenitally blind. Percept Mot Skills. 2013; 116(1): 91-105.
8. McCabe MP, Ricciardelli LA. A longitudinal study of pubertal timing and extreme body change behaviors among adolescent boys and girls. Adolescence. 2004; 39(153): 145-166.
9. Petroski EL, Pelegrini A, Glaner MF. Motivos e prevalência de insatisfação com a imagem corporal em adolescentes. Ciênc Saúde Coletiva. 2012; 17(4): 1071-1077.
10. Scherer FC, Martins CR, Pelegrini A, Matheus SC, Petroski EL. Imagem corporal em adolescentes:
associação com a maturação sexual e sintomas de transtornos alimentares. J Bras Psiquiatr. 2010; 59(3): 198-202.
11. Dunker KLL, Fernandes CPB, Carreira Filho DC. Influência do nível socioeconômico sobre comportamentos de risco para transtornos alimentares em adolescentes. J Bras Psiquiatr. 2009; 58(3): 156-161.
13. Pereira ÉF, Graup S, Lopes AS, Borgatto AF, Daronco LSE. Percepção da imagem corporal de crianças e adolescentes com diferentes níveis socio-econômicos na cidade de Florianópolis, Santa Catarina, Brasil. Rev Bras Saúde Mater Infant. 2009; 9(3): 253-262.
14. Fidélix YL, Minatto G, Ribeiro RR, Santos KD, Petroski ÉL. Dados sociodemográficos, estado nutricional e maturação sexual de escolares do sexo masculino: exposição à insatisfação com a imagem corporal. Rev Edu Fís/UEM. 2013; 24(1): 83-92.
15. Miranda VPN, Conti MA, Carvalho PHB, Bastos RR, Ferreira MEC. Imagem corporal em diferentes períodos da adolescência. Rev Paul Pediatr. 2014; 32(1): 63-69.
16. Fortes LS, Filgueiras JF, Oliveira FC, Almeida SS, Ferreira MEC. Modelo etiológico dos comportamentos de risco para os transtornos alimentares em adolescentes brasileiros do sexo feminino. Cad. Saúde Pública. 2016; 32(4): 1-11.
17. Neves CM, Meireles JFF, Carvalho PHB, Ferreira MEC. Body dissatisfaction and sociodemographic, anthropometric and maturational factors among artistic gymnastics athletes. Rev Bras Educ Fís Esporte. 2016; 30(1): 61-70.
18. Amaral ACS, Conti MA, Ferreira MEC, Meireles JFF. Avaliação Psicométrica do Questionário de Atitudes Socioculturais em Relação à Aparência-3 (SATAQ-3) para Adolescentes. Psic: Teor e Pesq. 2015; 31(4): 471-479.
19. Meireles JFF, Amaral ACS, Neves CM, Conti MA, Ferreira MEC. Avaliação psicométrica do Questionário de Mudança Corporal para adolescentes. Cad Saúde Pública. 2015; 31(11): 2291-2301.
20. Thomas JR, Nelson JK, Silverman SJ. Métodos de pesquisa em atividade física. 6a. ed. São Paulo: Artmed; 2012.
21. World Health Organization [WHO]. Nutrition in adolescence: issues and challenges for the health sector: issues in adolescent health and development. Geneva: WHO; 2005.
22. Associação Brasileira de Empresas de Pesquisa (ABEP). Critério de Classificação Econômica Brasil. 2012 [acesso em: 07 dez. 2012]. Disponível em: http://www.abep.org/criterioBrasil.aspx.
23. Kakeshita IS, Silva AIP, Zanatta DP, Almeida SS. Construção e fidedignidade teste-reteste de escalas de silhuetas brasileiras para adultos e crianças. Psic: Teor e Pesq. 2009; 25(2): 263-270.
24. Cole TJ, Flegal KM, Nicholls D, Jackson AA. Body mass index cut offs to define thinness in children and adolescents: international survey. BMJ. 2007; 335(7612): 166-167.
25. Cole TJ, Bellizzi MC, Flegal KM, Dietz WH. Establishing a standard definition for child overweight and obesity worldwide: international survey. BMJ. 2000; 320(7244): 1240-1243.
26. Bland JM, Altman DG. Statistical methods for assessing agreement between two methods of clinical measurement. Lancet. 1983; 1(8476): 307-310.
27. Dancey CP, Reidy J. Estatística sem Matemática para Psicologia. 5a ed. Porto Alegre: Penso; 2013.
28. American Psychiatric Association [APA]. Diagnostic and statistical manual of mental disorders (DSM-V). 5a ed. Washington: APA; 2014.
29. Corseuil MW, Pelegrini A, Beck C, Petroski EL. Prevalência de insatisfação com a imagem corporal e sua associação com a inadequação nutricional em adolescentes. Rev Edu Fís/UEM. 2009; 20(1): 25-31. 30. Gardner RM, Brown DL. Comparison of video distortion and figural drawing scale for measuring and
predicting body image dissatisfaction and distortion. Pers Indiv Differ. 2010; 49(7): 794-798.
31. Graup S, Pereira EF, Lopes AS, Araújo VC, Legnani RFS, Borgatto, AF. Associação entre a percepção da imagem corporal e indicadores antropométricos de escolares. Rev Bras Educ Fís Esporte. 2008; 22(2): 129-138.
32. Cash TF, Smolak L. Body image: A handbook of science, practice, and prevention 2nd ed. New York: The Guilford Press; 2011.
33. McCabe MP, Ricciardelli LA. Sociocultural influences on body image and body changes among adolescent boys and girls. J Soc Psychol. 2003; 143(1): 5-26.
34. Carvalho PHB, Ferreira MEC. Imagem corporal em homens: instrumentos avaliativos. Psic: Teor e Pesq. 2014; 30(3): 277-285.
35. Oliveira LPM, Queiroz VAO, Silva MCM, Pitangueira JCD, Costa PRF, Demétrio F et al. Índice de massa corporal obtido por medidas autorreferidas para a classificação do estado antropométrico de adultos: estudo de validação com residentes no município de Salvador, estado da Bahia, Brasil. Epidemiol. Serv. Saúde. 2012; 21(2): 325-332.
Acknowledgements: The authors are thankful to Minas Gerais Research Foundation [Fundação de Amparo à Pesquisa de Minas Gerais] (FAPEMIG) for the financial aid provided to the research.
Received on Oct, 03, 2015. Reviewed on Mar, 27, 2017. Accepted on Apr, 21, 2017.
Author address: Maria Elisa Caputo Ferreira. Rua José Lourenço Kelmer, s/n – Campus Universitário. Bairro São Pedro –