INTRODUCTION
A latitudinal gradient of decreasing species diversity
from the tropics toward the poles is considered to be one
of the few truly general patterns in biogeography and
ecology (Rosenzweig, 1995). As a result, a voluminous
body of literature has accumulated over the last 30 years,
dedicated to explaining the basis of the latitudinal
gradi-ent (Rohde, 1992). Substantial progress has been made
toward cataloging moss diversity through floristic
treat-ments of many tropical areas. During this effort,
bryolo-gists have repeatedly noted that there appear to be high
levels of species diversity in the tropics (e.g., Argent,
1979; Gradstein & Pocs, 1989; Frahm, 2003). Frahm
(2003) indicated that about two-thirds of all bryophyte
species (mosses, hornworts, and liverworts) occur in the
tropics. To date, however, no formal analyses of global
distribution patterns have been undertaken to test the
hypothesis that mosses are in fact more diverse in
tropi-cal than higher latitude regions.
Crosby & al. (2000) recognized 12,800 moss species
in their worldwide checklist. The number of species
increases as new taxa are described and decreases as
species are synonymized during the course of revisionary
work (Touw, 1974). Given these contradictory trends, the
current number is probably a pretty good, albeit rough,
estimate for the total number of mosses.
The statistical analysis of broad-scale trends in
bio-diversity must be undertaken with care. In addition to
complicating factors such as uneven sampling intensity,
differing sample area sizes, and non-comparable habitats
and levels of habitat heterogeneity among areas, species
themselves are unequal in “biodiversity value”. Some,
for example, are closely related to congeners while
oth-ers are more isolated; some species contain high levels of
genetic diversity while others are relatively invariant. For
these reasons, some have advocated alternative metrics
for quantifying biodiversity that do not rely on subjective
and sometimes arbitrary definitions of what constitutes a
species (Faith, 1992, 1994; Vane-Wright & al., 1991;
Nixon & Wheeler, 1992; Humphries & al., 1995).
The primary purpose of this study was to test the
hypothesis that mosses are more diverse near the equator
than at higher latitudes. Data were compiled from
region-al checklists to estimate species richness (“taxonomic
diversity”), and these were compared to geographic
pat-terns in molecular diversity derived from nucleotide
sequences from the plastid rps4 gene and an intron in the
mitochondrial nad5 gene. Two estimates of molecular
diversity were compared to the species richness data:
nucleotide diversity, which represents standing levels of
biodiversity at the DNA level, and phylogenetic
diversi-ty (PD; Faith, 1992, 1994), which provides a
phyloge-netic (i.e., historical) estimate of molecular biodiversity.
Global patterns of moss diversity: taxonomic and molecular inferences
A. Jonathan Shaw
1, Cymon J. Cox
1& Bernard Goffinet
21Department of Biology, Duke University, Durham, North Carolina 27278, U.S.A. [email protected] (author for correspondence); [email protected]
2Department of Ecology and Evolution, University of Connecticut, Storrs, Connecticut, 06269, U.S.A. [email protected]
Taxonomic and molecular data were utilized to test the hypothesis that moss diversity is greatest near the equa-tor. Species richness estimates from 86 taxonomic checklists representing global moss diversity do not support the hypothesis that, in general, mosses are more species-rich in the tropics than at higher latitudes. A signifi-cant latitudinal gradient was, however, detected for North, Central, and South American samples when ana-lyzed alone. Taxonomic estimates of biodiversity patterns were compared to molecular estimates based on standing nucleotide diversity, and on phylogenetic diversity, the latter taking into account the historical infor-mation contained in a molecular phylogenetic tree for the mosses. Molecular estimates suggest that moss diver-sity is highest in the Southern Hemisphere and lowest in the Northern Hemisphere, with the tropics having an intermediate level. The differences, however, are slight, and analyses of molecular variance (AMOVA) indi-cate that there is virtually no generalized differentiation between major latitudinal zones. These results reflect the fact that virtually all moss lineages have representatives in all three latitudinal zones. At the nucleotide level, mosses best fit the pattern of “everything is everywhere”.
KEYWORDS:
latitudinal biodiversity gradient, moss phylogeny, nad5 intron, rps4, phylogenetic diversity, tropical biodiversity.The molecular dataset utilized here to investigate
moss diversity patterns was assembled for phylogenetic
analyses of moss genera based on multiple loci. Names
of taxa included in the analysis are provided in Appendix
2 but are omitted from presented trees because they are
not relevant to the purpose of this study. Measures of
clade support (e.g., bootstrap percentages, posterior
probabilities) are also omitted because the biodiversity
analyses explicitly take phylogenetic uncertainty into
account, and the results are averaged across equally
opti-mal trees. Topological relationships among the genera
will be described in subsequent papers; we presently
focus on the shape of the moss phylogenetic tree, which
reflects the distribution of branch lengths on the
recon-structed phylogram. These branch lengths estimate the
“amount of evolution” that has occurred along
inter-nodes, and therefore permit analyses of biodiversity
pat-terns.
MATERIALS AND METHODS
Regional checklists. — Numbers of species
recorded from 86 geographic regions were obtained from
checklists available in journals, on the World Wide Web
(WWW), and by personal communication (Appendix 1).
Subspecific taxa are not included. The area covered by
each checklist was either obtained from the original
pub-lication, or was available on the WWW. In some cases
(e.g., North American Pacific Northwest), the total area
was estimated by adding together nested political units.
When a fraction of some state, province, or country was
included in the region covered by a checklist, the area
was estimated as accurately as possible. Each area was
assigned a geographic latitudinal center obtained from
the WWW for all politically-defined regions (http://www
.cia.gov/cia/publications/factbook/index.html and http://
www.netstate.com/states/index.html). In cases where
regions consisted of multiple political units (e.g., Pacific
Northwest), latitudinal centers were estimated from
maps. Checklists of some U.S. states were obtained from
relatively old sources, and species have undoubtedly
been added to these lists. Although species are regularly
added to regional checklists, no systematic attempt was
made to update published lists to their currently accepted
species counts. Only checklists dating from 1968 or later
were used for U.S. states.
Statistical analysis. — The relationship between
species richness and latitude was assessed by several
methods that were designed to take sample area into
account. For graphical purposes, the number of species
per 10,000 km
2was plotted against latitude. The number
of species per 10,000 km
2was itself related to sample
area size, but over a broad range of sample area sizes this
relationship could be ignored (see below). For statistical
analyses of the latitudinal trend, regression analyses were
conducted using SAS software (SAS Institute, 1991).
Species counts were regressed against sample area (in
km
2) or the log of sample area, and latitudinal center. In
this way, the relative contributions of sample area and
latitude could be separated. Species counts per 10,000
km
2were also regressed against latitude. Variations in
how the regressions were conducted did not affect
infer-ences about latitudinal trends in species diversity, so only
the regressions of species richness on log sample area
and latitude are presented.
Molecular dataset. — Nucleotide sequences for
the chloroplast encoded rps4 gene and the mitochondrial
encoded nad5 intron were obtained from 556 moss
accessions representing 555 different genera. All of the
major lineages of mosses were sampled; the dataset
includes a species from 64% of all moss genera
recog-nized by Crosby & al. (2000). Herbarium voucher
infor-mation and GenBank accession numbers for all
sequences are provided in Appendix 2. Protocols for
DNA extraction and sequencing of these regions,
includ-ing primer information, were given by Cox & al. (2004).
Phylogenetic analyses. — Analyses of the
556-taxon dataset were conducted using Bayesian statistical
inference. Heterogeneous Bayesian analyses were
per-formed using MrBayes3 (Huelsenbeck & Ronquist,
2002). Separate substitution models were applied to each
codon position at the rps4 locus and for the nad5 intron
region. The appropriate substitution models were
deter-mined by hierarchical likelihood ratio tests with the aid
of MrModeltest 1.1b (Nylander, 2002). Bayesian
analy-ses were conducted starting from a “usertree” calculated
using the Neighbor-joining algorithm under maximum
likelihood distances in PAUP (Swofford, 2001) with
10,000,000 generations using default, uniform priors.
Model parameters including trees were sampled every
500
thgeneration. The number of trees needed to reach
stationality (i.e., the “burnin”) in the MCMC algorithm
was estimated by visual inspection of the plot of ML
score at each sampling point using Excel (Microsoft
Corp.). Trees of the burnin (i.e., those before the chain
reached stationality) for each run were excluded from the
tree set, and the trees from each run were combined to
form the full sample of trees assumed to be
representa-tive of the posterior probability (p.p.) distribution.
19,200 trees were saved from the Bayesian analyses.
This tree set was filtered using the FILTER command of
PAUP to include only those trees that were compatible
with well-supported nodes relating the same taxa
includ-ed in the backbone topology of moss relationships
described by Cox & al. (2004). Topological details and
support for each node will be presented in subsequent
papers.
Molecular biodiversity. — Each accession was
assigned to one of three latitudinal zones based on where
it was collected. Collections from north of 30° N latitude
were considered “Northern Hemisphere”, those from
between 30° S and 30° N were assigned to the “Tropical”
zone, and those collected south of 30° S were considered
“Southern Hemisphere.” Although it is acknowledged
that not all habitats between 30° N and 30° S are
ecolog-ically tropical (e.g., high elevation sites), characterizing
each site climatically or vegetationally was neither
pos-sible in all cases, nor fully objective. The same scoring
approach was used by Shaw & al. (2003a).
Accessions included in the molecular analyses were
selected to represent moss genera for purposes of
resolv-ing phylogenetic relationships. However, most genera of
mosses have at least one species that occurs in each of
the zones. Thus, most genera could not be assigned to
one and only one zone. Indeed, many of the species
included in these analyses are distributed across more
than one of our three latitudinal zones. Biogeographic
patterns are therefore based on the accessions themselves
rather than the genera (or even species) they represent.
The accessions represent random samples from each of
the three latitudinal zones. The estimates of phylogentic
diversity, described below, therefore test the null
hypoth-esis that random samples of mosses from the three
latitu-dinal zones contain the same (i.e., indistinguishable)
lev-els of molecular biodiversity.
Nucleotide variation and diversity. —
Analysis of molecular variance (AMOVA) was used to
estimate components of molecular variance among
ver-sus within latitudinal zones, and test for significant
genetic differentiation among samples from the zones.
AMOVA addresses the hypothesis that nucleotide
fre-quencies are non-uniform among latitudinal zones.
Nucleotide diversity within each latitudinal zone was
estimated from the sample of sequences representing that
region using ARLEQUIN (Schneider & al., 2000).
Phylogenetic diversity. — Phylogenetic
diversi-ty (PD; Faith, 1992) was estimated on 10 randomly
selected trees from the posterior probability distribution
with branch lengths optimized under a General
Time-Reversible substitution model with a discrete gamma
dis-tribution of rate (four categories) and a proportion of
invariant characters (GTR+I+G). PD utilizes information
inferred from phylogenetic relationships among
acces-sions included in the dataset. PDs for each geographic
region were estimated as the total length of the
mini-mum-spanning subtree connecting all accessions
repre-senting that region. The sum of all branch lengths on the
object tree constitutes the total PD contained in our
sam-ple. Partitioning of PD among regions was estimated by
deleting all taxa other than those in the region of interest,
and branch lengths were again summed for the remaining
subsample.
PD is based on total (i.e., cumulative) branch length
for each geographic region, so estimates are affected by
sample sizes. The substantial differences in sample sizes
among regions (see Table 1) make the effect of sample
size potentially significant. In order to correct for
differ-ing sample sizes among geographic regions and make
direct comparisons possible, PDs were estimated for
ran-domly sampled subsets of the Northern and Tropical
accessions at N = 87, the size of our Southern
Hemisphere sample. PD was recalculated for each of 100
taxon subsamples (of N = 87), so that we could estimate
PD based on sample sizes equivalent to the least
exten-sively sampled region (Southern Hemisphere). This
sub-sampling procedure assessed the effect of which
Northern Hemisphere accessions we used to estimate PD
for the region. In order to account for phylogenetic
uncertainty, which can also affect PD estimates, this
sub-sampling procedure was repeated on each of 10
random-ly selected trees from the Bayesian posterior probability
distribution.
Differences in PD among regions were tested by
analysis of variance (ANOVA), implemented in SAS.
The model included latitudinal region (N = 3) and tree (N
= 10) as main effects, with error variances provided by
taxon subsamples. The model was unbalanced because
estimates for Northern Hemisphere and Tropical regions
had 100 taxon subsample replicates whereas the
Southern Hemisphere region had no such replication.
Variance components attributable to the main effects
were estimated using the VarComp procedure in SAS,
using the ML option.
RESULTS
Global patterns in species richness. —
Numbers of species, sample areas, and the latitudinal
centers for each area used to analyze species richness
patterns are shown in Appendix 1. Species richness is,
not surprisingly, significantly related to the size of the
area covered by checklists (Fig. 1). In addition, there are
more species per unit area (10,000 km
2) in the largest
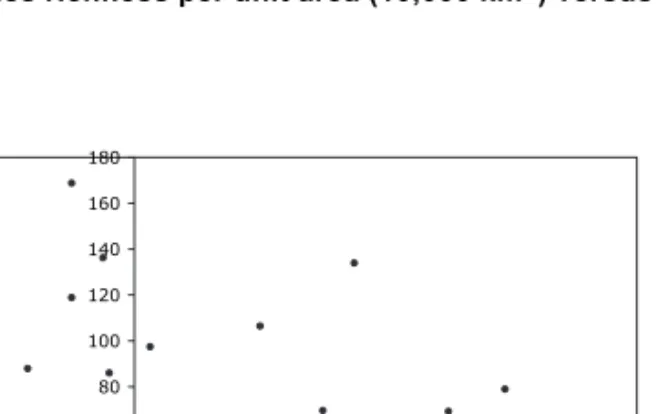
sample areas compared to smaller areas (Fig. 2). The
trend is not strong except for the largest areas, possibly
because these areas encompass an exceptionally broad
Table 1. Nucleotide diversity in Northern Hemishere (> 30° N), tropical, and Southern Hemisphere (> 30° S) accessions.
Region Sample size Nucleotide diversity Northern Hemisphere 224 0.057214 ± 0.027320
Tropical 245 0.057601 ± 0.027491
range of climatic zones and topographic features; for
example, North America north of Mexico, which
includes subtropical to high arctic habitats. The size of
the sample area and scale at which biodiversity occurs
can have a strong effect on analyses of this type.
When no sample areas are excluded from the
analy-sis, some samples from low latitudes had the highest
numbers of species, but other tropical areas had much
lower species richness (Fig. 3). The relationship between
species richness and latitude is not significant when
sam-ple area is taken into account, but the trend is apparent
from the fact that the latitude effect is nearly significant
(Table 2).
To test whether a latitudinal pattern is obscured by
the largest sample areas, these were separated from
smaller sample areas and the two groups were analyzed
separately. However, the effect of latitude is not
signifi-cant for either the large sample area dataset (Fig. 4; Table
2) or the smaller sample area dataset (Fig. 5; Table 2).
Various other subsets of the data based on area sizes were
analyzed separately, but the latitudinal effect was not
sig-nificant in any regression. Some of the samples from the
tropical zone were from desert countries of northern
Africa, for example, where the flora is incompletely
known and the dry climate may obscure a general
latitu-dinal pattern. Nevertheless, even when these countries
(Cyprus, Israel, Jordan, Kuwait, Lebanon, Oman, Syria,
United Arab Emirates) plus the smallest sample areas
(Hong Kong, Maldive Islands, Simeonof Island
[Alaska], and Barro Colorado Island [Panama]) were
excluded, the latitudinal affect was not significant.
However, when only samples from North, Central, and
South America were included, the latitudinal effect was
significant (Table 2).
Nucleotide diversity. — Molecular diversity is
lowest in the Northern Hemisphere, intermediate in the
tropical zone, and highest in the Southern Hemisphere,
but standard errors of nucleotide diversities are high (as
is typical of such estimates) and the differences are small
(Table 1). The AMOVA shows that there is virtually no
molecular differentiation between accessions from the
three latitudinal zones (Table 3). Indeed, almost 99% of
the total diversity at the rps4 and nad5 loci exists within
latitudinal zones.
Moss phylogenetic relationships and
geo-graphic patterns. — A randomly selected tree from
Table 2. Effects of sampling area size and latitude on species richness estimates for mosses, based on linear regression. D.f. = degrees of freedom. F = test statistics of ANOVA; Pr > F probability of observing an F of that magnitude (or greater) by chance alone.
Source D.f. Type III sum of squares Mean square F value Pr > F
All data: Ln area 1 7775504.0414 7775504.0414 43.63 0.0001 Latitude 1 600635.3623 600635.3623 3.37 0.0700 Sampling areas > 1,000,000 km2 Ln area 1 3422309.9092 3422309.9092 11.00 0.0033 Latitude 1 866532.0605 866532.0605 2.79 0.1099
Sampling areas > 10,000 and <1,000,000 km2
Ln area 1 666262.80387 666262.80387 8.84 0.0044
Latitude 1 33291.14159 33291.14159 0.44 0.5091
North, Central, and South American sampling areas
Ln area 1 2594762.2561 2594762.2561 24.02 0.0001
Latitude 1 1573547.2541 1573547.2541 14.57 0.0007
Fig. 1. Plot of species number versus (log) sample area.
0 1 2 3 4 5 6 7 8 9 0 5 10 15 20 Ln area (km²) Ln species
Fig. 2. Plot of number of species per unit area versus sampling area size included in moss checklists.
0 0 2 0 4 0 6 0 8 0 0 1 0 2 1 0 4 1 0 6 1 0 8 1 8 1 6 1 4 1 2 1 0 1 8 6 4 2 0 Species / Ln area (km 2 ) Ln area (km²)
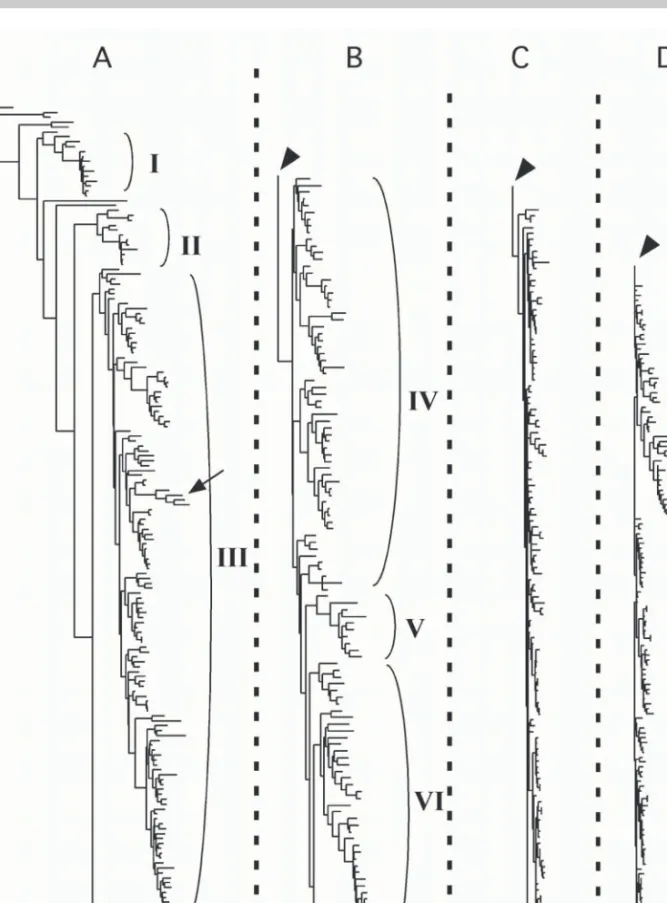
the Bayesian posterior probability space on which the
phylogenetic diversity analyses were conducted is shown
as Fig. 6. The tree has a characteristic shape that has been
documented in previous studies (Cox & al., 2004);
internode branch lengths are fairly consistent until the
origin of hypnalian pleurocarps, after which they are
abruptly short (Fig. 6). The sister group to Hypnales,
Hookeriales, does not exhibit short branch lengths that
characterize Hypnales (Fig. 6). Other small regions of
the tree suggest more local changes in diversification
rate, or substitution rate, or both (e.g., a clade that
includes seven genera of Polytrichaceae
[Notologotrichum, Polytrichadelphus, Meiotrichum,
Polytrichastrum, Oligotrichum, Atrichum, Psilopilum,
Dawsonia, Polytrichum]: marked I in Fig. 6; a
haplolepi-deous clade that includes Syrrhopodon, Mitthyridium,
Anthrocormus, Exodictyon: short arrow in Fig. 6A).
Accessions from Northern Hemisphere, Tropical,
and Southern Hemisphere localities are rather scattered
throughout the moss phylogenetic tree (not shown).
Nevertheless, some groups, such as Hookeriales, are
clearly most diverse in tropical regions. The moss
phy-logeny therefore reflects both the efficacy of dispersal,
and evolutionary radiations following dispersal.
Phylogenetic diversity. — PD estimates follow
the same pattern as standing nuclear diversity: Southern
Hemisphere > Tropical > Northern Hemisphere (Table
4). An analysis of variance for PD estimates indicates
that although the differences among regions in PD are
small, they are significant and account for 64% of the
total variation in PD (Table 5). One possible explanation
for the relatively high PD in Southern Hemisphere
acces-sions is that Southern Hemisphere harbors early
diverg-ing and relatively isolated taxa. On average, Southern
Hemisphere taxa are indeed closer to the root of the moss
phylogeny, although the standard deviations associated
with these estimates are large and overlapping (Table 6).
DISCUSSION
This study provides only weak evidence that the
tropics are richer in moss species than are high latitude
regions, although there is a statistically significant
rela-tionship between species numbers and latitude for New
World floras. Our inference from this exercise is that
moss diversity, measured by the numbers of species, is
Table 3. Analysis of molecular variance in rps4 and nad5 sequences among accessions collected from three major lat-itudinal zones (Northern Hemisphere, Tropical, Southern Hemisphere).
Source of variation D.f. Sum of squares Variance component Percentage of variation
Among geographic regions 2 313.535 0.63958 1.35
Within geographic regions 553 25825.413 46.70057 98.65
Total 555 26138.948 47.34015
Fig. 3. Species richness per unit area (10,000 km2) versus
latitude. 0 0 2 0 4 0 6 0 8 0 0 1 0 2 1 0 4 1 0 6 1 0 8 1 0 0 1 0 8 0 6 0 4 0 2 0 0 2 -0 4 -0 6 -e d u t i t a L Species / Ln area (km 2)
Fig. 4. Species richness per unit area versus latitude from checklists for areas > 1,000,000 km2.
0 0 2 0 4 0 6 0 8 0 0 1 0 2 1 0 4 1 0 6 1 0 8 1 0 8 0 6 0 4 0 2 0 0 2 -0 4 -e d u t i t a L Species / Ln area
Fig. 5. Species richness per unit area versus latitude from checklists for areas < 1,000,000 km2.
0 0 1 0 2 0 3 0 4 0 5 0 6 0 7 0 8 0 9 0 0 1 0 0 1 0 8 0 6 0 4 0 2 0 0 2 -0 4 -0 6 -e d u t i t a L
Fig. 6. Phylogenetic relationships among 550 genera of mosses based on rps4 (cpDNA) and nad5 intron (mtDNA) sequences, showing the general shape of the tree. Note that branch lengths in the Hypnales (panels C and D) are excep-tionally short. This tree was randomly selected from the Bayesian posterior probability space. I = Polytrichaceae, II = Funariales and Encalyptales, III = haplolepideous mosses, IV = acrocarpous (and cladocarpous) taxa with diplolepi-deous-alternate peristomes, V = Garovagliales, and VI = Hookeriales. Panels C and D are all Hypnales.
probably highest in the tropics, but the pattern is not
striking. The lack of an obvious pattern is itself
notewor-thy. A pronounced latitudinal gradient is well-known for
angiosperms (Gentry, 1988) and has been evident for
over 100 million years (Crane & Lidgard, 1989). Many
early botanists accepted the center of diversity = center
of origin hypothesis put forth by Willis (1922) but it is
now widely accepted that high levels of species
diversi-ty may reflect relatively low regional extinction rather
than a center of origin (Stebbins, 1974).
Latitudinal gradients in species richness have been
documented for a broad range of plants and animals
(Rosenzweig, 1995), and most of the earth’s top 25
bio-diversity hotspots are in the tropics (Meyers & al., 2000).
Tropical rainforests are said to contain very high levels
of angiosperm diversity. The moss flora of Amazonia, in
contrast, is notably depauperate (Churchill, 1998). There
are high levels of moss diversity in tropical mountains
(Churchill & Linares, 1995), as in many other organisms
(Churchill & al., 1995), but the numbers presently
avail-able for mosses do not support the view that tropical
mountain systems, including the Andes, are obviously
richer than some regions at higher latitudes. In one of the
only other studies to attempt a test of increasing moss
diversity toward the equator, Vitt (1991) found no such
diversity gradient among South Pacific Islands.
The analysis of broad-scale trends in species
rich-ness is fraught with methodological and statistical
diffi-culties (Conner & McCoy, 1979; Rahbek, 1995, 1997).
The confounding effects of area are substantial, and area
itself may be the primary explanation underlying both
altitudinal and latitudinal gradients (Terborgh, 1977;
Rosenzweig, 1995). In addition, regions within a
latitu-dinal zone are ecologically heterogeneous because of
dif-ferences in, for example, rainfall, humidity, and
topogra-phy. Regions within latitudinal zones also differ in
histo-ry, which can be an important determinant of species
richness. In fact, the general absence of a clear
latitudi-nal trend in the current study may be due in part to
eco-logical and historical variation among sampling regions
within latitudinal zones. Attempts were made to explore
this possibility for mosses by examining subsets of the
data, but except for a significant but weak trend in the
Americas, we were not able to tease out a clear
latitudi-nal pattern from any subset of the data. Despite all the
weaknesses in our data, we would expect to see a trend if
the global latitudinal patterns were strong. They are not,
at least not at the geographic/ecological scales at which
floristic data provide insight.
Areas covered by the moss checklists differ in
sam-pling intensity; that is, how completely known the flora
is. Tropical moss floras are obviously less intensively
sampled than are at least the Northern Hemisphere areas,
and species richness is almost certainly higher in the
tropics than current numbers suggest. Nevertheless, the
numbers would have to change relatively much for a
clear pattern to emerge; moreover, the same inequality of
floristic knowledge is true of angiosperms and most
other organisms. Incomplete sampling is unlikely to
explain the lack of a clear latitudinal gradient in moss
species richness.
Another factor that could affect our ability to detect
latitudinal trends is the superimposed patterns of
diversi-ty at different scales. Beta (regional) diversidiversi-ty could be
higher in tropical moss flora even though alpha (local)
diversity is not. The moss flora of Costa Rica might not
include an exceptionally high number of species, but
there might be higher species turnover between Costa
Rica and Mexico than, for example, between Montana
and California. Our data are not sufficient to address this
issue because the analyses are based on species numbers
alone for each region; additional studies in which the
pri-mary data are species lists are needed so that floristic
turnover among sampling areas could be evaluated.
There are some exceptions to the general trend of
increasing biodiversity toward the equator, and organism
body size appears to be related to the magnitude (or
exis-tence) of the latitudinal gradient (Hillebrand & Azovsky,
2001). Small species tend to have cosmopolitan
distribu-tions and the slopes of species-area curves decrease with
body size (Fenchel & Finlay, 2004). Microorganisms
represent the extreme case, in which population sizes are
so huge that “everything is everywhere” (Fenchel &
Table 4. Phylogenetic diversity (PD) in NorthernHemi-shere (> 30° N), tropical, and Southern Hemisphere (> 30° S) accessions.
Region Sample PD (± standard deviation) Northern Hemisphere 1000 2.2027276 ± 0.1577044 Tropical 1000 2.4655070 ± 0.1136834 Southern Hemisphere 1000 2.6576010 ± 0.0100686
Table 5. Analysis of variance in phylogenetic diversity (PD) for accessions collected from three major latitudinal zones (Northern Hemisphere, Tropical, Southern Hemisphere), and among ten randomly selected trees from the 95% posteri-or probability space of a Bayesian phylogenetic analysis. F = test statistics of ANOVA.
Source D.f. Sum of squares Mean square F value % variation
Region 2 35.56770175 17.78385088 942.81 64*
Tree 9 0.07033818 0.00781535 0.41 0*
Finlay, 2004). Hillebrand & Azovsky (2001) posit that
community patterns of species diversity in big organisms
are determined by large-scale and long-term processes
such as speciation rates and patterns, biogeography, and
history, whereas communities of small organisms may be
more influenced by ecological processes such as
compe-tition and other biotic interactions. In other words,
assemblages of large organisms are “unsaturated” and
are limited by dispersal (i.e., who got
there—biogeogra-phy, history), whereas assemblages of smaller organisms
are not so dispersal limited. At the level of taxonomic
species, mosses do not display the “everything is
every-where” biogeographic extreme, but it is well known that
moss distributions tend to be much broader, on average,
than are those of angiosperms. Mosses fit the pattern of a
relationship between body size, apparent dispersal
abili-ty, and strength of the latitudinal gradient.
Another factor that can affect inferences about
bio-diversity patterns are species delimitations. Clearly, not
all species “were created equally” with regard to
biodi-versity value. Species that are part of a recent radiation
may be very closely related genetically, even if
morpho-logically distinct (e.g., Baldwin, 1997; Meyer, 1993).
Moreover, some species contain high levels of genetic
diversity while others are depauperate. How do broad
scale biodiversity patterns based on species richness
compare to patterns based on molecular diversity? At
least in the moss genus, Sphagnum, the patterns can be
quite different (Shaw & al., 2003a).
Nucleotide and phylogenetic diversity show
con-gruent, even if subtle, geographic trends. A random
sam-ple of tropical mosses has higher molecular diversity
than a comparable Northern Hemisphere sample, but
Southern Hemisphere accessions have the highest
diver-sity. The patterns in phylogenetic diversity are
signifi-cant, but the degree of molecular differentiation among
regions is very minor: about 1% of the total diversity
among mosses at the two loci sampled in our study.
Moreover, the statistical analysis of PD should be
inter-preted with caution since the Southern Hemisphere
esti-mate did not incorporate taxon subsampling. Our results
are clear, however, in showing that phylogenetic
uncer-tainty contributes little to the variance in PD estimates, at
least in this study where the phylogenetic tree was
rela-tively well resolved and statistically supported (such that
equally optimal trees were very similar in both shape and
topology).
The fact that there is little differentiation in
mito-chondrial and plastid DNA (for the loci we sampled)
between broad geographic regions across a clade that is
several hundred million years old demonstrates that there
has been substantial inter-regional migration. Tropical
accessions are found throughout our phylogenetic
recon-struction for the mosses, and few clades are completely
restricted to particular latitudinal zones. These
observa-tions attest to the migratory prowess of mosses; every
major and most minor lineages of mosses have
success-fully dispersed between northern, tropical, and southern
latitudinal zones. On the other hand, some nonrandom
geographic clustering of accessions also indicates that
radiations have followed some dispersal events. Species
level phylogenies for smaller clades are required to
fur-ther elucidate such evolutionary patterns. Nevertheless,
because of extensive dispersal at a global scale, mosses
as a whole come close to displaying the “everything is
everywhere” pattern at the nucleotide level. Perhaps it is
not therefore surprising that the latitudinal trend in moss
diversity is weak, at best.
There is suggestive evidence that moss molecular
diversity might be higher in the Southern Hemisphere
than in either the tropics or the Northern Hemisphere.
The difference in phylogenetic diversity is significant,
and the same pattern is present for nucleotide diversity
estimates. Even if the pattern is real, the basis for it is
obscure. Our analyses suggest that two randomly
select-ed Southern Hemisphere accessions are, on average,
more distinct in terms of DNA sequences than are
ran-domly selected tropical or Northern Hemisphere
sam-ples.
One possible explanation is that mosses are older in
the Southern Hemisphere, raising the possibility that they
originated there. This hypothesis is difficult to test by
reconstructing geographic ranges on the generic
phy-logeny because most moss genera span more than one of
the latitudinal zones that we have defined. The
Sphagnopsida are cosmopolitan, although it appears that
the early diverging lineages of Sphagnopsida are
Southern Hemisphere and/or tropical (Shaw & al.,
2003b). The two species of Takakia are both Northern
Hemisphere; Andreaeopsida are most diverse in the
Southern Hemisphere, but there are species from the
sub-antarctic to the arctic. The only clear pattern is that none
of the early diverging lineages of mosses are primarily
tropical, but no other inferences are presently possible.
Only a species-level phylogeny for the mosses, in which
early-diverging species of all major clades are identified,
might be capable of resolving the geographic origin of
mosses. Our results, including the observation that
Southern Hemisphere accessions tend to be closer to the
root of the moss phylogeny, are consistent with a
Southern Hemisphere origin.
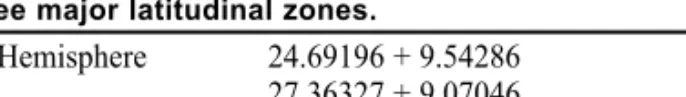
Table 6. Mean (+ standard deviation) number of nodes from the phylogenetic root of mosses for accessions from three major latitudinal zones.
Northern Hemisphere 24.69196 + 9.54286
Tropical 27.36327 + 9.07046
ACKNOWLEDGEMENTS
This study was supported by NSF grants DEB-0089131 to AJS and DEB-0089633 to BG.
LITERATURE CITED
Anderson, L. E., Crum, H. A. & Buck, W. R. 1990. List of the mosses of North America north of Mexico. Bryologist 93: 448–499.
Argent, G. C. G. 1979. The systematics of tropical bryophytes. Pp. 185–193 in: Clarke, G. C. S. & Duckett, J. G. (eds.), Bryophyte Systematics. Academic Press, London. Baldwin, B. G. 1997. Adaptive radiation of the Hawaiian
sil-verword alliance: congruence and conflict of phylogenetic evidence from molecular and non-molecular investiga-tions. Pp. 103–128 in: Givnish T. J. & Sytsma, K. J. (eds.), Molecular Evolution and Adaptive Radiation. Cambridge Univ. Press, New York.
Bird, C. D. 1973. A New Catalogue of the Bryophytes from Alberta, Saskatchewan, and Manitoba. Univ. Calgary, Calgary.
Born, S., Frahm, J.-P. & Pócs, T. 1993. A new checklist of the Mosses of Central Africa. Trop. Bryol. 8: 223–273. Brassard, G. R. 1971. The mosses of northern Ellesmere
Island, arctic Canada. II. Annotated list of taxa. Bryologist 74: 282–311.
Brassard, G. R. 1983. Checklist of the mosses of the island of Newfoundland, Canada. Bryologist 86: 54–63.
Churchill, S. P. 1998. Catalog of Amazonian mosses. J. Hattori Bot. Lab. 85: 191–238.
Churchill, S. P., Balslev, H., Forero, E. & Luteyn, J. L. (eds.). 1995. Biodiversity and Conservation of Neotropical Montane Forests. New York Bot. Garden, New York. Churchill, S. P., Griffin, D. III & Muñoz, J. 2000. A
check-list of the mosses of the tropical Andean countries. Ruizia 17: 1–203.
Churchill, S. P. & Linares, E. L. 1995. Prodromus Bryologiae Novo-Granatensis. Part 1. Instituto de Ciencias Naturales, Museo de Historia Natural, Univ. Nacional de Colombia, Bogota.
Conner, E. F. & McCoy, E. F. 1979. The statistics and biolo-gy of the species area relationship. Amer. Nat. 113: 791–833.
Cox, C. J., Goffinet, B., Shaw, A. J. & Boles, S. 2004. Phylogenetic relationships among the mosses based on heterogeneous Bayesian analysis of multiple genes from multiple genomic compartments. Syst. Bot. 29: 234–250. Crane, P. R. & Lidgard, S. 1989. Angiosperm diversification
and paleolatitudinal gradients in cretaceous floristic diver-sity. Science 246: 675–678.
Crosby, M. R., Magill, R. E., Allen, B. & He, S. 2000. A Checklist of the Mosses. Missouri Botanical Garden, St. Louis, Missouri, U.S.A. http://www.mobot.org/MOBOT/ tropicos/most/checklist.shtml
Crosby, M. R., Schultze-Motel, U. & Schultze-Motel, W. 1983. Katalog der Laubmoose von Madagaskar und den umliegenden Inseln. Willdenowia 13: 187–255.
Dirkse, G. M., Bouman, A. C. & Losada-Lima, A. 1993. Bryophytes of the Canary Islands, an annotated checklist. Cryptog., Bryol. Lichén. 14: 1–47.
Eggers, J. 1982. Artenliste der Moose Makaronesiens. Cryptog., Bryol. Lichén. 3: 283–335.
Faith, D. P. 1992. Conservation evaluation and phylogenetic diversity. Biol. Conserv. 61: 1–10.
Faith, D. P. 1994. Phylogenetic diversity: a general framework for the prediction of feature diversity. Pp. 251–268 in: Forey, P. L., Humphries, C. J. & Vane-Wright, R.I. (eds.), Systematics and Conservation Evaluation. Clarendon, Oxford.
Fenchel, T. & Finlay, B. J. 2004. The ubiquity of small species: patterns of local and global diversity. Bioscience 54: 777–784.
Fife, A. J. 1995. Check-list of the mosses of New Zealand. Bryologist 98: 313–337.
Florschutz-de Waard, J. 1990. A catalogue of the bryophytes of the Guianas. II. Musci. Trop. Bryol. 3: 89–104. Flowers, S. 1973. Mosses of Utah and the West. Brigham
Young Univ., Provo, Utah.
Frahm, J.-P., O’Shea, B., Pócs, T., Koponen, T., Piippo, S., Enroth, J., Rao, P. & Fang, Y.-M. 2003. Manual of Tropical Bryology. Trop. Bryol. 23: 1–196.
Frey, W. & Kürschner, H. 1991. Conspectus Bryophytorum Orientalum et Arabicorum. An annotated catalogue of the bryophytes of southwest Asia. Bryophyt. Bibl. 39: 1–181. Gentry, A. H. 1988. Tree species richness of upper Amazonian
forests. Proc. Nat. Acad. Sci. U.S.A. 85: 156–159. He, S. 1998. A checklist of the mosses of Chile. J. Hattori Bot.
Lab. 85: 103–189.
Hermann, F. J. 1976. Recapilación de los musgos de Bolivia. Bryologist 79: 125–171.
Higuchi, M. & Nishimura, N. 2003. Mosses of Pakistan. J. Hattori Bot. Lab. 93: 273–291.
Hillebrand, H. & Azovsky, A. I. 2001. Body size determines the strength of the latitudinal diversity gradient. Ecography 24: 251–256.
Huelsenbeck, J. P. & Ronquist, F. 2002. MrBayes Version 3.0B. Available from the authors: http://morphbank.ebc.uu .se/mrbayes3/info.php.
Humphries, C. J., Williams, P. H., & Vane-Wright, R. I. 1995. Measuring biodiversity value for conservation. Annu. Rev. Ecol. Syst. 26: 93–111.
Ignatov, M. S. & Ofanina, O. M. 1992. Check-list of mosses of the former USSR. Arctoa 1: 1–85.
Ireland, R. R., Bird, C. D., Brassard, G. R., Schofield, W. B. & Vitt, D. H. 1980. Checklist of the Mosses of Canada. National Museums of Canada, Ottawa.
Ireland, R. R. & Cain, R. F. 1975. Checklist of the mosses of Ontario. Nat. Mus. Can. Pub. Bot. 5: 1–67.
Iwatsuki, Z. 1991. Catalog of the Mosses of Japan. Hattori Botanical Laboratory, Nichinan.
Iwatsuki, Z. & Tan, B. C. 1979. Checklist of Philippine moss-es. Philippine J. Biol. 8: 179–210.
Kis, G. 1985. Mosses of South-East Tropical Africa. Inst. Ecology Bot. Hungarian Acad. Sci. 1–170.
Kucera, J. & Vána, J. 2003. Check- and red-list of bryophytes of the Czech Republic. Preslia, Praha 75: 193–222. Lampton, K. R. 1970. Mosses of Georgia: a checklist of
species which have been collected within the state. Bull. Georgia Acad. Sci. 28: 81–98.
Lawton, E. 1971. Moss Flora of the Pacific Northwest. Hattori
Botanical Laboratory, Nichinan.
Magill, R. E. & Schelpe, E. A. 1979. The bryophytes of
Southern Africa. Mem. Bot. Surv. S. Afr. 43: 1–39
McCleary, J. A. & Green, V. V. 1971. A checklist of Idaho
mosses. Bryologist 74: 175–180.
Menzel, M. 1991. Listado básico de la flora Salvadorensis.
Bryophyta. Cuscatlania 1(5): 1–24.
Menzel, M. 1992. Preliminary check-list of the mosses of Peru
(Studies on Peruvian Bryophytes IV). J. Hattori Bot. Lab. 71: 175–254.
Menzel, M. & Passow-Schindhelm, R. 1990. The mosses of
the Maldive Islands. Cryptog., Bryol. Lichén. 11: 363–367.
Meyer, A. 1993. Phylogenetic relationships and evolutionary
processes in East African cichlid fishes. Trends Ecol. Evol. 8: 267–305.
Myers, N., Mittermeier, R. A., Mittermeier, C. G., Fonseca, G. A. B. da & Kent, J. 2000. Biodiversity hotspots for
conservation priorities. Nature 403: 853–858.
Nixon, K. C. & Wheeler, Q. D. 1992. Measures of
phyloge-netic diversity. Pp. 216–234 in: Novacek, M. J. & Wheeler, Q. D. (eds.), Extinction and Phylogeny. Columbia Univ. Press, New York.
Nylander, J. A. A. 2002. MrModeltest - Version 1.1b. Available
from the authors. http://www.ebc.uu.se/systzoo/staff/ nylander.html.
O’Shea, B. J. 2002. Checklist of the mosses of Sri Lanka. J.
Hattori Bot. Lab. 92: 125–164.
O’Shea, B. J. 2003. Bryogeographic relationships of the
moss-es of Sri Lanka. J. Hattori Bot. Lab. 93: 293–304.
Pursell, R. A. 1973. Un censo de los musgos de Venezuela.
Bryologist 76: 473–500.
Rahbek, C. 1995. The elevational gradient of species richness:
a uniform pattern? Ecography 18: 200–205.
Rahbek, C. 1997. The relationship among area, elevation, and
regional species richness in neotropical birds. Amer. Nat. 149: 875–902.
Reese, W. D. 1972. List of the mosses of Louisiana. Bryologist
75: 290–298.
Rohde, K. 1992. Latitudinal gradients in species diversity: the
searching for the primary cause. Oikos 65: 514–527.
Rosenzweig, M. L. 1995. Species Diversity in Space and Time.
Cambridge Univ. Press, New York.
Salazar Allen, N., Arrocha, C. & Chung, C. 1991. The
moss-es of Barro Colorado Island, Panama. Bryologist 94: 289–293.
SAS Institute. 1991. SAS Users Guide: Statistics. SAS
Institute Inc., Cary, North Carolina.
Schneider, S., Roessli, D. & Excoffier, L. 2000. ARLEQUIN
ver. 2.000. http://anthro.unige.ch/arlequin.
Schofield, W. B., Talbot, S. & Talbot, S. L. 2004. Bryophytes
from Simeonof Island in the Shumagin Islands, south-western Japan. J. Hattori Bot. Lab. 95: 155–198.
Schultze-Motel, W. 1975. Katalog der Laubmoose von
West-Afrika. Willdenowia 7: 473–535.
Shaw, A. J., Cox, C. J. & Boles, S. B. 2003a. Global patterns
of peatmoss biodiversity. Molec. Ecol. 12: 2553–2570.
Shaw, A. J., Cox, C. J. & Boles, S. B. 2003b. Polarity of
peat-moss (Sphagnum) evolution: who says peat-mosses have no roots? Amer. J. Bot. 90: 1777–1787.
Stebbins, G. L. 1974. Flowering Plants. Evolution Above the
Species Level. Harvard Univ. Press, Cambridge.
Steere, W. C. 1978. The mosses of arctic Alaska. Bryoph. Bibl.
14: 1–508.
Streimann, H. & Klazenga, N. 2002. Catalogue of Australian
Mosses. Flora of Australia Supplementary Series no. 17. Australian Biological Resources Study. Canberra.
Swofford, D. L. 2001. PAUP*: Phylogenetic Analysis Using
Parsimony (*and Other Methods), vers. 4.0b8. Sinauer Associates, Sunderland, Massachusetts.
Tan, B. C. & Iwatsuki, Z. 1991. A new annotated moss
check-list. Harvard Pap. Bot. 3: 1–64.
Tan, B. C. & Iwatsuki, Z. 1993. A checklist of Indochinese
mosses. J. Hattori Bot. Lab. 74: 325–405.
Terborgh, J. 1977. Bird species diversity on an Andean
eleva-tional gradient. Ecology 58: 1007–1019.
Touw, A. 1974. Notes on taxonomic and floristic research on
exotic mosses. J. Hattori Bot. Lab. 36: 123–128.
Townsend, C. & Allen, B. H. 1998. A checklist of the mosses
of Belize. Trop. Bryol. 15: 89–100.
Uyar, G. & Cetin, B. 2004. A new check-list of the mosses of
Turkey. J. Bryol. 26: 203–220.
Vane-Wright, R. I., Humphries, C. J. & Williams, P. H.
1991. What to protect? — Systematics and the agony of choice. Biol. Conserv. 55: 235–254.
Vitt, D. H. 1973. Distributional studies on bryophytes of
Alberta. Bryologist 76: 505–510.
Vitt, D. H. 1976. The mosses reported from the Yukon
Territory. J. Hattori Bot. Lab. 38: 299–321.
Vitt, D. H. 1991. Distribution patterns, adaptive strategies, and
morphological changes of mosses along elevational and latitudinal gradients on South Pacific islands. Pp. 205–231 in: Nimis, P. L. & Crovello, T. J. (eds.), Quantitative Approaches to Phylogeography. Kluwer, Netherlands.
Weber, W. A. 1973. Guide to the mosses of Colorado. Inst.
Arctic & Alpine Research Occas. Pap. 6: 1–48.
Willis, J. C. 1922. Age and Area. Cambridge Univ. Press,
Cambridge.
Yano, O. 1981. A checklist of Brazilian mosses. J. Hattori Bot.
Lab. 50: 279–456.
Young, K. R., Ulloa Ulloa, C. & Luteyn, J. L. 2002. Plant
evolution and endemism in Andean South America: an introduction. Bot. Rev. 68: 4–21.
Zhang, L. & Lin, P.-J. 1997. A checklist of bryophytes from
Appendix 1. Checklists of moss species from selected geographic regions of the world. Negative latitudes are given as negative numbers because that is how they were analyzed statistically.
Geographical unit Area (km2) Species Latitude Reference
Afghanistan 647,500 215 33.00 Frey & Kürschner (1991)
Alberta 644,392 437 54.50 Vitt (1973)
Amazonia 5,500,000 311 -5.50 Churchill (1998)
Arctic Alaska 487,496 415 68.75 Steere (1978)
Arizona 113,642 373 34.31 Johnson (1969)
Australia 7,617,930 1074 -27.00 Streimann & Klazenga (2002)
Bangladesh 133,910 183 24.00 O’Shea (2003)
Barro Colorado Island 15,600 81 9.20 Allen, Salazar, Arrocha & Chung (1991) Belize 22,806 250 17.25 Townsend & Allen (1998)
Bolivia 1,084,390 1222 -17.00 Hermann (1976)
Borneo 743,330 724 0.50 M. Suleiman & B. Tan (pers. comm.)
Brazil 8,456,510 1896 -10.00 Yano (1981)
Britain 310,480 755 54.00 http://rbg-web2.rbge.org.uk/bbs/Resources/uklist.htm British Columbia 930,532 620 54.50 Schofield (1968)
California 403,970 607 36.96 J. Shevock (pers. comm.)
Canada 9,093,507 996 60.00 Ireland, Bird, Brassard, Schfield & Vitt (1980) Canary Islands 7,500 309 28.10 Dirkse, Bouman & Losada-Lima (1993) Central Africa 2,398,306 712 -2.00 Born, Frahm & Pocs (1993)
Central America 522,765 905 13.00 B. H. Allen (pers. comm.)
Chile 748,800 778 -30.00 He (1998)
China 9,326,410 2,150 35.00 S. He (pers. comm.) Colombia 1,038,700 889 4.00 Churchill & Linares (1995)
Colorado 268,660 292 39.00 Weber (1973)
Cyprus 9250 169 35.00 Frey & Kürschner (1991)
Czech Republic 77,276 642 49.75 Kucera & Vána (2003) East Africa 4,999,832 1327 -4.00 Kis (1985)
El Salvador 20,720 233 13.83 Menzel (1991)
Ellesmere Island 196,235 160 80.25 Brassard (1971)
Estonia 43,211 408 59.00 http://www.zbi.ee/%7Etomkukk/sammal.htm
Georgia 150,010 315 32.71 Lampton (1970)
Guianas 447,470 238 4.20 Florschütz-de Waard (1990) Hong Kong 1,076 198 22.37 Zhang & Lin (1997) Idaho 214,325 257 44.26 McCleary & Green (1971)
India 3,166,830 1594 20.00 O’Shea (2003)
Indochina 1,939,320 1008 30.00 O’Shea (2003)
Iran 1,648,000 297 32.00 Frey & Kürschner (1991)
Iraq 437,072 167 33.00 Frey & Kürschner (1991)
Israel 20,770 190 31.50 Frey & Kürschner (1991)
Italy 294,020 851 42.83 http://dbiodbs.univ.trieste.it/web/myxo/mosses1
Japan 374,744 1180 36.00 Iwatsuki (1991)
Java 132,090 628 -7.50 Tan & Iwatsuki (1993), updated by B. Tan (pers. comm.) Jordan 92,300 105 31.00 Frey & Kurschner (1991)
Kuwait 17,820 19 29.50 Frey & Kurschner (1991) Lebanon 10,400 190 33.83 Frey & Kurschner (1991)
Louisiana 112,836 240 30.96 Reese (1972)
Macaronesia 10,844 485 33.00 Eggers (1982)
Madagascar 587,039 1254 -20.00 Crosby, Schultze-Motel, V. & W. (1983)
Malawi 94,080 267 -13.50 http://www.nhm.ac.uk/hosted_sites/bbstbg/tbgmal.htm Maldive Islands 298 9 -5.00 Menzel & Passow-Schindhelm (1990)
Malesia 3,015,250 1454 2.50 O’Shea (2003)
Manitoba 549,350 267 54.50 Bird (1973)
New Zealand 268,680 523 -41.00 Fife (1995) Newfoundland 405,720 445 49.25 Brassard (1983)
North America 18,255,430 1320 59.00 Anderson, Crum & Buck (1990) Northern Africa 6,268,655 420 16.00 R. M. Ros Espin (pers. comm.)
Norway 307,860 802 62.00 http://www.nhm.uio.no/botanisk/mose/m-taxa.htm
Oman 212,460 29 21.00 Frey & Kürschner (1991)
Ontario 1,068,580 430 49.25 Ireland & Cain (197). Pacific NW North Am. 1,976,011 598 48.00 Lawton (1971)
Appendix 1 (continued.)
Geographical Unit Area (km2) Species Latitude Reference
Papua NG 452,860 650 -6.00 Tan & Iwatsuki (1993), updated by B. Tan (pers. comm.) Peninsular Malaysia 328,550 474 2.5 Tan & Iwatsuki (1993), updated by B. Tan (pers. comm.)
Peru 1,280,000 882 -10.00 Menzel (1992)
Phillipines 298,170 642 13.00 Iwatsuki & Tan (1979), Tan & Iwatsuki (1991) Phillipines (updated) 298170 700 13.00 Tan & Iwatsuki (1993), updated by B. Tan (pers. comm.) Saskatchewan 652,330 214 54.50 Bird (1973)
Saudi Arabia 1,960,582 98 25.00 Frey & Kürschner (1991) Simeonof Island (AK) 31 202 54.90 Schofield, Talbot & Talbot (2004)
South Yemen 287,680 18 Frey & Kürschner (1991)
Southern Africa 2,613,940 591 -26.50 Magill & Schelpe (1979) Spain 504,750 1020 40.00 R. M. Ros Espin (pers. comm.)
Sri Lanka 65,610 568 7.00 O’Shea (2002)
Sub-Sahara 23,284,250 2863 -10.00 O’Shea (2002)
Switzerland 39,770 737 47.00 http://www.bryolich.ch/bryologie/ChecklisteMoose.html Syria 185,180 109 35.00 Frey & Kurschner (1991)
Thailand 511,770 620 15.00 B. Tan (pers. comm.)
Tropical Andies 4,561,980 2089 -5.00 Churchill, Griffin & Munoz (2000) Turkey 780,580 726 39.00 Uyar & Cetin (2004)
United Arab Emirates 82,880 3 24.00 Frey & Kürschner (1991) USSR 22,272,000 1172 50.00 Ignatov & Ofonina (1992)
Utah 212,815 256 39.38 Flowers (1973)
Venezuela 882,050 626 8.00 Pursell (1973)
Vietnam 325,360 598 16.00 Tan & Iwatsuki (1993), updated by B. Tan (pers. comm.) West Africa 7,727,123 964 -5.00 Schultze-Motel (1975)
Yemen 527,970 33 15.00 Frey & Kürschner (1991)
Yukon 536,327 347 64.75 Vitt (1976)
Appendix 2. Taxon sampling, collection information, geographic origin, and GenBank accession numbers for speci-mens included in the analyses of molecular moss biodiversity. N = Northern Hemisphere; T = Tropical; S = Southern Hemisphere. See Materials and Methods for additional information about classification of latitudinal regions.
Taxon, Collector, Collection number and (voucher location), Latitudinal region, rps4, nad5
Abietinella abietina, Schofield 103458 (DUKE), N, AY907953, AY908386; Acanthorrhynchium papillatum, Kristoferson 1990-04-17 (NY), T, AY908206,
AY908468; Achrophyllum quadrifarium, Streimann 51258 (NY), S, AY449660, AY452316; Acrocladium auriculatum, Kantak & Churchill 166 (NY), S, AY306854, AY908747; Acroporium pungens, Buck 33028 (NY), T, AY908207, AY908539; Acroschisma wilsonii, Cox 00-668 (DUKE), S, AY908011, AY908811; Actinodontium sprucei, Buck 37977 (NY), T, AY306855, AY908451; Actinothuidium hookeri, Croat 76028 (MO), N, AY908335, AY908399;
Adelothecium bogotense, Vital & Buck 19649 (NY), T, AY306856, AY452318; Aerobryidium aureo-nitens, Redfearn 2270 (MO), T, AY306857, AY908730; Aerobryopsis longissima, Streiman 57914 (MO), S, AY306859, AY908719; Aerobryum speciosum, Allen 6642 (MO), T, AY306861, AY908498; Aerolindigia cappilacea, Lineares 3721 (MO), T, AY908303, AY908511; Alophosia azorica, Rumsey s.n. (DUKE), N, AY330476, AY312867; Alsia cali-fornica, Shevock 18765 (MO), N, AY908258, AY908639; Amblytropis hispidula, Lyon 54 (MO), T, AY908609, AY908452; Amphidium lapponicum, Schofield 98089 (DUKE), N, AF222896, AY908962; Anacamptodon splachnoides, Buck 32568 (NY), N, AF143031, AY908419; Anacolia webbii, Düll 1998 (herb. Goffinet), N, AY907987, AY908949; Ancistrodes genuflexa, Holz & Franzaring CH 00-154 (NY), S, AY306863, AY452319; Andoa berthelo-tiana, Hedenas B4599 (MO), N, AY908179, AY908438; Andreaea rothii, Shaw 11565 (DUKE), N, AY312866, AY312862; Anoectangium aestivum, Schofield 104414 (MO), N, AY908049, AY908832; Anomobryum julaceum, Cox s.n. (RNG), N, AF023786, AY908353; Antitrichia curtipendula, Goffinet 7829 (UCONN), N, AY908570, AY908645; Aongstroemia jamaicensis, Allen 6403 (DUKE), T, AY908094, AY908869; Aphanorrhegma serratum, Goffinet s.n. (herb. Goffinet), N, AF223048, AY908931; Aplodon wormskioldii, Nimis s.n. (herb. Goffinet), N, AY039047, AY908955; Aptychella proligera, Vital & Buck 19448 (NY), T, AY908228, AY908474; Aptychopsis pyrophylla, Vital & Buck 19464 (NY), T, AY908212, AY908476; Arbusculohypopterygium arbusculum, Holz & Franzaring CH 00-80 (NY), S, AY449665, AY452366; Archidium donnellii, Risk 1536 (DUKE), N, AY908090, AY908972; Arctoa fulvella, Schofield 102571 (DUKE), N, AY908075, AY908894; Arthrocormus schimperi, Reese 17371 (DUKE), T, AY908151, AY908874; Aschisma carniolicum, Cano & al. 7968 (MUB), N, AY908054, AY908851; Astomiopsis kienerii, Cardenas 3953 (DUKE), T, AY908072, AY908857; Atractylocarpus longisetus, Churchill & al. 15076-a (DUKE), T, AY908126, AY908905; Atrichum undulatum, Goffinet 7605 (UCONN), N, AY908018,
AY908810; Aulacomnium androgynum, Cox 149 (RNG), N, AF023811, AJ291564; Aulacopilum hodgkinsoniae, Vitt 28261 (ALTA), S, AY908116, AY908968; Baldwiniella kealeensis, Flynn 5137 (NY), T, AY908590, AY908734; Barbella cubensis, Allen 14172 (DUKE), T, AY908285, AY908722;
Barbellopsis trichophora, Streimann 56092 (NY), S, AY908288, AY908723; Barbula unguiculata, Zander 1975 (BUFF), N, AF306986, AY908844; Bartramia stricta, Longton 4871 (RNG), N, AF023799, AY312870; Bartramiopsis lescurii, Schofield 99187 (MO), N, AY908019, AY908800; Beeveria distichophylloides, Fife 11150 (NY), S, AY306867, AY452320; Benitotania elimbata, Akiyama & Suleiman 2002 (NY), T, AY449661, AY452321; Bestia vancouveriensis, Newton 5017 (herb. Newton), N, AY908328, AY908660; Bissetia lingulata, Yamaguchi 2000 (MO), N, AY908352, AY908448; Boulaya mitteni, Shevock 16392 (MO), N, AY908338, AY908395; Brachelyma subulatum, Allen Font. exs. # 87 (DUKE), N, AF306998, AY908492; Brachymenium nepalense, Long 23614 (RBG), T, AY078338, AY908354; Brachythecium salebrosum, Goffinet 4723 (DUKE), N, AF143027, AY312871; Braunfelsia dicranoides, Koponen 32555 (DUKE), T, AY908102, AY908879; Breutelia scoparia, McDowell 4039 (NY), T, AF143075, AY908382; Brothera leana, Long 21998 (DUKE), T, AY908129, AY908911; Brotherella recurvans, Buck 31506 (NY), N, AY908227, AY908470; Bryhnia novae-angliae, Buck 32561
(NY), N, AY908308, AY908523; Brymela tutezona, Salazar & al. 13656 (NY), T, AY449662, AY908454; Bryoandersonia illecebra, Goffinet 5274 (herb. Goffinet), N, AY908317, AY908471; Bryobartramia nova-valesiae, Magill & Schelpe 3218a (DUKE), T, AY908160, AY908967; Bryobrothera crenulata,
Streimann 57716 (NY), T, AY306869, AY452325; Bryocrumia andersonii, Redfearn & Su 971 (DUKE), T, AY908196, AY908437; Bryoerythrophyllum campylocarpum, Churchill 19042 (BUFF), T, AY908027, AY908845; Bryomaltaea obtusifolius, Allen 12284 (DUKE), T, AY908006, AY908948; Bryonorrisia acutifolia, Redfearn & Su 1003 (DUKE), T, AY908553, AY908450; Bryostreimannia turgida, Streimann 53659 (NY), S, AY908556,
Appendix 2 (continued).
Taxon, Collector, Collection number and (voucher location), Latitudinal region, rps4, nad5
AY312872; Callialaria curvicaulis, Allen 10426 (MO), N, AY908249, AY908424; Callicladium haldanianum, Schofield 97218 (MO), N, AY908561, AY908760; Callicostella pallida, Holz FG 00-14 (NY), T, AY306872, AY452328; Callicostellopsis meridensis, Griffin PV-898 (NY), T, AY306871, AY452327; Calliergon cordifolium, Rumsey 136/3 (herb. Rumsey), N, AF469844, AY908710; Calliergonella cuspidata, Schofield 105806 (MO), N, AY908183, AY908403; Calomnion complanatum, Streimann 51519 (MO), S, AY907997, AY908946; Calyptopogon mnioides, Streimann 59469 (MO), S, AY908041, AY908816; Calyptothecium praelongum, Newton & Bell 5299, T, AY908594, AY908699; Calyptrochaeta brownii, Streimann 60613 (NY), S, AY306873, AY452329; Camptochaete arbuscula, Streimann 51516 (MO), S, AY908330, AY908658; Campyliadelphus stellatus, Lisowski B11801 (MO), N, AY908248, AY908417; Campylium chrysophyllum, Buck 32532 (NY), N, AF143048, AY908418; Campylophyllum halleri, Schofield & al. 93659 (MO), N, AY908252, AY908433; Campylopodiella stenocarpa, Delgadillo 5002 (DUKE), T, AY908131, AY908909; Campylopus introflexus, Shaw 10490 (DUKE), S, AY908128, AY908906; Campylostelium augustifolium, Allen 22321 (MO), N, AY908147, AY908929; Canalohypopterygium tamariscinum,
Frey & Pfeiffer 98-T10C (CHR), S, AY306878, AY452331; Cardotiella subappendiculata, Arts 18/01 (herb. Goffinet), T, AY908615, AY908937; Caribaeohypnum polypterum, Dauphin 2083 (MO), T, AY908347, AY908628; Catagoniopsis berteroana, Mahu 50182 (MO), S, AY908200, AY908756; Catagonium nitens, Goffinet 5459 (herb. BG), S, AF307003, AY908473; Catharomnion ciliatum, Streimann 51423 (NY), S, AY306879, AY452332; Ceratodon purpureus, Arts REU 44/15 (DUKE), T, AY908123, AY908862; Chaetomitriopsis glaucocarpa, Wang 4046A (MO), T, AY908603, AY908681; Chaetomitrium borneense, Tan 95-1116 (NY), T, AY306880, AY452333; Chamaebryum pottioides, Venter 346 (DUKE), S, AF223051, AY908983; Cheilothela chloropus, Werner & Ros 14024 (DUKE), N, AY908124, AY908861; Chenia leptophylla, Schafer-Verwimp 14361 (MO), T, AY908042,
AY908815; Chionostomum rostratum, Redfearn 33924 (NY), T, AY908210, AY908477; Chorisodontium mittenii, Churchill & al. 19750 (MO), T, AY908107, AY908885; Chrysoblastella chilense, Buck 39507 (DUKE), T, AY908165, AY908789; Chrysocladium flammeum, Weber B-99410 (MO), T, AY908287, AY908725; Chrysohypnum diminutivum, Churchill & al. 20423 (MO), T, AY908345, AY908625; Cinclidotus aquaticus, Boscher & al. (herb. Goffinet), N, AY908029, AY908843; Cirriphyllum cirrosum, Allen 19686 (MO), N, AY908310, AY908524; Cladomnion ericoides, Streimann 51478 (NY), S, AY306884, AY452336; Cladomniopsis crenato-obtusa, Buck 41360 (NY), S, AY306883, AY452335; Cladophascum gymnomitrioides, Perold 2475 (MO), S, AY908097, AY908871; Cladopodanthus speciosus, Tan 1991 (NY), T, AY908132, AY908912; Claopodium whippleanum, Shevock 19289 (DUKE), N, AY908294, AY908746; Clasmatodon parvulus, Buck 33446 (NY), N, AF143032, AY908519; Clastobryella kusatsuensis, Buck 9611 (NY), N, AY908226, AY908460; Clastobryopsis planula, Crosby 16026 (MO), T, AY908229, AY908550; Cnestrum alpestre, Buck 36198 (NY), N, AY908077, AY908896; Codonoblepharon menziesii, Shevock 18773 (herb. Goffinet), N, AY908175, AY908497; Colobodontium vulpinum, Allen 19306 (MO), T, AY908215, AY908534; Conardia compacta, Shevock 16984 (MO), N, AY908568, AY908634; Conostomum tetragonum, Goffinet 5755 (herb. Goffinet), S, AF306990, AY908954; Coscinodon calyptratus, Schofield 109633 (DUKE), N, AJ553978, AY908918; Cratoneuron filicinum, Smith 3618 (MO), N, AY908250, AY908425; Cratoneuropsis relaxa, Streimann 65232 (MO), S, AY908244, AY908427; Crosbya straminea, Fife 10379 (NY), S, AY306887, AY908490; Crossidium crassinerve, Ros 26/2/2002 (MU), N, AY908037, AY908823; Crossomitrium epiphyllum, Buck 33259 (NY), T, AY306885, AY452337; Crumia latifolia, Buck 30338 (NY), N, AY908031, AY908821; Cryptogonium phyllogonoides, Buck 7395 (NY), T, AY908598, AY908703;
Cryptoleptodon longisetus, Schafer-Verwimp 4206 (MO), N, AY908260, AY908651; Cryptopapillaria penicillata, Churchill & Betancur 16932 (NY), T,
AY908292, AY908717; Cryptopodium bartramioides, Frahm 1998 (MO), S, AY907998, AY908774; Curvicladium kurzii, Akiyama 85 (NY), T, AY908266, AY908670; Curviramea mexicana, Buck 28242 (NY), T, AF143062, AY908629; Cyathophorella hookeriana, Akiyama 39 (NY), T, AY306890, AY452340;
Cyathophorum bulbosum, Streimann 55638 (NY), S, AY306889, AY452339; Cyclodictyon albicans, Churchill & al. 18795 (NY), T, AY306892, AY452342; Cynodontium strumiferum, Allen 2000 (MO), N, AY908078, AY908897; Cyptodon muelleri, Vitt 27223 (NY), S, AY908586, AY908686; Cyptodontopsis obtusifolia, Akiyama 1990 (NY), T, AY908588, AY908687; Cyrtohypnum schistocalyx, Newton, Equihua & DeLuna 4618 (herb. Newton), T, AY908336,
AY908396; Cyrtopodendron vieillardii, van der Werff. & McPherson 16072 (MO), T, AY908010, AY908768; Cyrtopus setosus, Frahm 1998 (MO), S, AY908007, AY908773; Daltonia gracilis, Buck 39508A (NY), T, AY306894, AY452344; Dawsonia superba, Kantak 582 (DUKE), S, AY908016, AY908804; Dendroalsia abietina, Goffinet 7764 (UCONN), N, AY908185, AY908459; Dendrocryphaea cuspidata, Holz & Franzaring 00-95 (MO), S, AY908587, AY908694; Dendrocyathophorum decolyi, Matsui 7264 (NY), N, AY306896, AY452346; Dendroligotrichum dendroides, Goffinet 5425 (herb. Goffinet), S, AF306957, AY312873; Dendropogonella rufescens, Schafer-Verwimp SV/H-0478 (MO), T, AY908562, AY908708; Desmotheca apiculata,
Vinas 96-4 (herb. Goffinet), T, AY908614, AY908942; Dialytrichia mucronata, DeSloover 45.173 (MO), N, AY908030, AY908830; Diaphanodon bland-um, Long 18822 (DUKE), T, AY908291, AY908731; Dichelodontium nitidbland-um, MacMillan 1/5/1999 99/14 (CHR), S, AY449664, AY452347; Dichelyma falcatum, Allen Font. exs. # 92 (DUKE), N, AY908318, AY908493; Dichodontium pellucidum, Goffinet 7967 (UCONN), N, AY908114, AY908971; Dicnemon seriatum, Newton & Bell 5400 (herb. Newton), T, AY908104, AY908886; Dicranella heteromalla, Goffinet 8162 (CONN), N, AY908099,
AY908938; Dicranodontium meridionale, Lyon 1992 (MO), T, AY908130, AY908910; Dicranoloma eucamptodontoides, Newton & Bell 5757 (herb. Newton), S, AY908103, AY908887; Dicranoweisia crispula, Schofield 108251 (DUKE), N, AY908164, AY908925; Dicranum scoparium, Rumsey s.n. (herb. Rumsey), N, AF234158, AY908884; Didymodon rigidulus, Allred & Allred 6443 (MO), N, AY908047, AY908828; Dimerodontium balansae, Bordas
56 23 (NY), T, AY907952, AY908409; Dimorphocladon borneense, Tan 95-1060 (NY), T, AY306898, AY452348; Diphyscium foliosum, Goffinet 4492
(Pers. Herb.), N, AF223034, AY312874; Diploneuron connivens, Crosby 13732 (NY), T, AY306899, AY908457; Distichium capillaceum, Allen 9698 (MO), N, AY908162, AY908786; Distichophyllidium nymanianum, Mohamed & Damanhuri 1118 (NY), T, AY306901, AY452350; Distichophyllum pulchellum,
Streimann 51380 (NY), S, AY306902, AY452351; Ditrichum pallidum, Nelson 13749 (DUKE), N, AF306979, AY908934; Dixonia thamnoides, Akiyama Th-12 (HKY), T, AY907956, AY908469; Dolichomitra cymbifolia, Deguchi s.n. (MO), N, AY908344, AY908495; Dolichomitriopsis diversiformis, Shevock 17935 (MO), T, AY908329, AY908663; Dolotortula mniifolia, Djan-Chekan 94-71 (NY), T, AY908036, AY908824; Donnellia commutata, Allen 11883A
(MO), T, AY908211, AY908536; Dozya japonica, Mizutani 13730 (DUKE), N, AY908262, AY908649; Drepanocladus aduncus, Shevock 1998 (MO), N, AY908241, AY908422; Drummondia obtusifolia, Goffinet 5586 (DUKE), S, AF223038, AY908926; Dryptodon patens, Shevock 20102 (MO), N, AY908142, AY908921; Duthiella wallichii, Redfearn 35722 (MO), T, AY908286, AY908728; Eccremidium floridanum, Allen 7505 (DUKE), T, AY908098, AY908872; Echinodium umbrosum, Streimann 49668 (NY), S, AY908269, AY908680; Ectropothecium leptochaeton, Whittemore 5594 (MO), T, AY908558, AY908405; Elmeriobryum philippinense, Koponen 33157 (DUKE), T, AY908323, AY908388; Encalypta ciliata, Schofield 98872 (DUKE), N, AY908161, AY312875; Entosthodon laevus, Goffinet 5601 (herb. Goffinet), S, AY908156, AY312876; Ephemeropsis trentepohlioides, Macmillan 95/94 (NY), S, AY306906, AY908491; Ephemerum serratum, Goffinet 4524 (herb. Goffinet), N, AY908061, AY908848; Epipterygium wrightii, Allen 6400 (MO), T, AY907985, AY908372; Eriodon conostomus, Mahu 21497 (MO), S, AY908239, AY908684; Erythrophyllopsis fuscula, Churchill & al 19928 (MO), T, AY908028, AY908831; Eucamptodon perichaetialis, Holz & Franzaring CH 00-119 (MO), S, AY908081, AY908899; Eulacophyllum cultelliforme, Allen
18241 (MO), T, AY908197, AY908752; Euptychium robustum, Streimann 56137 (NY), S, AY306907, AY452352; Eurhynchiella acanthophylla, Taylor 11048 (NY), S, AY908299, AY908503; Eurhynchium hians, Bachmann 327 (DUKE), N, AY908314, AY908513; Eurohypnum leptothallum, Yamaguchi 132
(MO), N, AY908203, AY908443; Eustichia longirostris, Goffinet 7091 (herb. Goffinet), S, AY908091, AY908930; Exodictyon diatatum, Newton & Bell
5305 (herb. Goffinet), T, AY908149, AY908875; Fauriella tenuis, He & Song 00327 (MO), T, AY908233, AY908545; Felipponea montevidensis, Wasum & Jasper 8207(MO), S, AY908576, AY908714; Fissidens subbasilaris, Goffinet 5263 (herb. Goffinet), N, AF223056, AY312877; Fleischerobryum longi-colle, Deguchi 158 (MO), N, AY907989, AY908383; Floribundaria aurea, Mizutani 15715 (MO), N, AY306910, AY908724; Flowersia campylopus, Cardenas 4369 (MO), T, AY907988, AY908788; Foreauella orthotheca, Redfearn, Magill, Crosby, Wu, Lou, Wang 34244 (NY), T, AY908560, AY908461; Forsstroemia trichomitra, Anderson 27401 (DUKE), N, AY908263, AY908650; Funaria hygrometrica, Cox s.n. (RNG), N, AF023776, Z98959; Funariella curviseta, Townsend 89/235 (E), N, AY908157, AY908791; Ganguleea angulosa, Vital & Buck 20053 (NY), T, AY908068, AY908970; Garckea phascoides, Magill & Pocs 11583 (MO), T, AY908096, AY908870; Garovaglia elegans, Hoffman 89-476 (NY), T, AY306915, AY452356; Gigaspermum repens, Schofield 90527 (DUKE), N, AF223049, AY908974; Glyphomitrium daviesii, Buck 14830 (NY), N, AY908082, AY908895; Glyphothecium sciuroides,