Tholon P1
Queiroz SA2
1 Universidade Estadual de Londrina –
Londrina, PR.
2 Faculdade de Ciências Agrárias e
Veterinárias – UNESP, Jaboticabal, SP.
Sandra Aidar de Queiroz Depto Zootecnia
Universidade Estadual Paulista
Faculdade de Ciências Agrárias e Veterinárias Via de Acesso Prof. Paulo Donato Castellani, s/n 14.884-900. Jaboticabal, SP, Brasil
E-mail: [email protected]
Growth parameters; growth evaluation; non-linear models; wild birds.
M odels f or t he analysis of grow t h curves f or
rearing t inam ous (
Rhynchot us ruf escens
) in
capt ivit y
M ail Address
Ke yw o rd s Aut hor(s)
Arrived: October / 2006 Approved: February / 2007
ABSTRACT
Growth curves models provide a visual assessment of growth as a function of time, and prediction body weight at a specific age. This study aimed at estimating tinamous growth curve using different models, and at verifying their goodness of fit. A total number 11,639 weight records from 411 birds, being 6,671 from females and 3,095 from males, was analyzed. The highest estimates of a parameter were obtained using Brody (BD), von Bertalanffy (VB), Gompertz (GP,) and Logistic function (LG). Adult females were 5.7% heavier than males. The highest estimates of b parameter were obtained in the LG, GP, BD, and VB models. The estimated k parameter values in decreasing order were obtained in LG, GP, VB, and BD models. The correlation between the parameters a and k showed heavier birds are less precocious than the lighter. The estimates of intercept, linear regression coefficient, quadratic regression coefficient, and differences between quadratic coefficient of functions and estimated ties of quadratic-quadratic-quadratic segmented polynomials (QQQSP) were: 31.1732±2.41339; 3.07898± 0.13287; 0.02689±0.00152; -0.05566±0.00193; 0.02349±0.00107, and 57 and 145 days, respectively. The estimated predicted mean error values (PME) of VB, GP, BD, LG, and QQQSP models were, respectively, 0.8353; 0.01715; –0.6939; –2.2453; and –0.7544%. The coefficient of determination (R2
) and least square error values (MS) showed similar results. In conclusion, the VB and the QQQSP models adequately described tinamous growth. The best model to describe tinamous growth was the Gompertz model, because it presented the highest R2 values, easiness of convergence, lower PME, and the easiness of parameter biological interpretation.
INTRODUCTION
The wide geographical dissemination, omnivorous eating habits, and hunting capacity of tinamous (Rhynchotus rufescens) make them attractive from the economic standpoint. Tinamous (Rhynchotus rufescens) belong to the Order Tinamiformes, which include a group of terrestrial fowl with gallinaceous appearance, similar to Old World partridges, Alectoris and Perdix, but geographically restricted to South America (Sick, 1985). Their reproductive period is between August and March, and one of its characteristics is a well-known peculiar peeping of the male, which start peeping one or two months before the fertile period. Breeding system is classified as polyandric (Fowler, 1986). Eggs are violet-chocolate, shiny, and have a porcelain appearance (Sick, 1985). Average egg weight is 57.70 g (Carnio et al., 1999).
the chicks (Moro, 1991). Nakage et al. (2002) determined that the optimal temperature for tinamous egg incubation is between 35.5ºC and 36.5ºC, and 60% relative humidity. Bruneli et al. (2005), studying 248 eggs, reported that tinamous chicks weigh 37.81 g at hatching, varying between 27.44 and 53.84 g. Tholon et al. (2003) reported a fast growth rate between 7 and 90 days of age, after which birds grow slower until slaughter age, which is around 160 days. Estimated slaughter weights and average daily weight gain were 676.3±2.0 g and 0.0235±0.0002 g/day, respectively. In studies with tinamous raised in wire-mesh aviaries in the state of Rio Grande do Sul, Menegheti et al. (1985) observed a weight of 663 g at 133 days of age. Recent research studies showed interesting results in terms of meat production, with a carcass yield of 74.37%, and breast yield of 36.65% (Moro et al., 2006).
Therefore, the knowledge of the growth curve of tinamous and of the function that affect it is important to develop management practices to rear this species in captivity. Growth curves are mathematical models that relate body weight to age. Several mathematical models can be used to describe bird growth, and the most commonly used are those derived from the function of Richards, which includes four parameters:
Yt = a(1± b exp-kt)1/(1-m)
where
Yt is body weight at age t, a is the asymptote value, b is the scale parameter, k is maturity index, and
m is the inflection parameter, which determined the function shape.
The asymptote value (a) corresponds to the estimated inflection point of the growth curve, i.e., when weight no longer changes with time, and thus, it indicates mature weight or maximal theoretical weight (Braccini Neto, 1993; Maruyama et al., 1999; Mignon-Grasteau & Beaumont, 2000), as well as weight at sexual maturity. When adult weight is not reached, the parameter reflects an estimation of the weight at the last weighing (Freitas, 2005).
The scale parameter (b) does not have a biological interpretation, and it is established by the initial y and t values after birth (Braccini Neto, 1993). According to Mignon-Grasteau & Beaumont (2000) and Freitas (2005), this parameter related weight at hatching
(hatching, t =0) to asymptotic weight (t→∞).
Maturity index (k) estimates relative rate in which the asymptotic value is reached. This parameter is a logarithm function of weight, changing linearly per unit of time, and thus can be interpreted as the curve slope (Braccini Neto, 1993). It also expresses a reduction in relative growth rate (Freitas, 2005). More sigmoid curves indicate earlier growth (Kni•ztová et al., 1991b), suggesting an antagonism between mature weight (a) and maturation rate (k).
The parameter “m” determines the position of the inflection point, i.e., the point in which the growth curves changes from increasing to decreasing slope, reflecting sigmoid curvature degree, with higher m values expressing a more accentuated “S” curve (Braccini Neto, 1993). According to Grossman & Bohren (1982), poultry growth curve is characteristically an asymetrical sigmoid relative to the inflection point, which is located in a non-central point of the curve. When different values are attributed to “m”, different growth curve models can be obtained, such as those described below.
1) Gom pert z m odel
The inflection parameter (m) tends to 1 in this function. The Gompertz model was originally developed to describe mortality rates in a population. It has good fitting for weight information which inflection point occurs in the beginning of growth, when approximately 35 to 40% is achieved (Braccini Neto, 1993).
2) Brody m odel
In this model, inflection parameter (m) is equal to zero. This function divides the growth curve in two segments: the first is designated as “growth acceleration phase”, whereas the second is the “growth self-inhibition phase.” The inflection point of this model joins both segments when one third of the asymptotic weight is achived.
3) von Bert alanf f y m odel
In this function, inflection parameter (m) is equal to 2/3. The von Bertalanffy growth curve considers animal growth as the result of the opposition between anabolic and catabolic processes. The inflection point occurs when approximately 30% (8/27) of the asymptote is reached (Braccini Neto, 1993).
4) Logist ic m odel
function presents one low asymptote or zero limit value, one high asymptote with growth rates tending to zero, because growth is limited, and an inflection point established when 50% of final weight is reached, i.e., growth rate symmetry relative to the inflection point. Anthony et al. (1986) found different inflection points among Japanese quail genetic lines that were attributed to differences in selection criteria, and concluded that selection for live weight in birds older than four weeks of age resulted in a reduction in initial weight. However, this result may also be attributed to the high fat deposition during the adult phase, as well as to the effect of compensatory growth.
Different models are used to describe poultry growth due to the different inflection points of each analyzed population. Kni•ztová et al. (1991b) observed that ducks presented higher asymptotic weights and inflection points as compared to chickens or geese. In general, age at the inflection point in duck (Kni•ztová et al., 1991b) and Japanese quail (Anthony et al., 1986) growth curves is lower than in laying chickens, showing that those species are more precocious.
Kni•ztová et al. (1991a) and Freitas (2005) found excellent fitting of the Gompertz function to describe broiler growth; however, Kni•ztová et al. (1991b) and Maruyama et al., (1999) did not obtain the same result when analyzing duck growth data.
Sengül & Kiraz (2005) obtained good fitting of turkey growth curves using Gompertz, logistic, Morgan-Mercer-Flodine, and Richards’ functions, obtaining coefficients of determination (R2
) higher than 0.99, and little difference between sexes.
Anthony et al. (1986) observed an intense acceleration phase in Japanese quail (Coturnix coturnix japonica) growth curves , followed by a long inhibition phase, which indicates that growth probably continues after sexual maturity. This behavior was also observed in broilers byKni•ztová et al. (1991a) and Goliomytis et al. (2003).
According to Tholon et al. (2003), the models that best fitted tinamous (R. rufescens) growth curves were the Gompertz and the von Bertalanffy functions. The latter was also used by Menegheti et al. (1985) and Moro (1991). However, abdominal fat accumulation in mature ages possibly is the cause of lack of fit (Anthony et al., 1986; Kni•ztová et al., 1991a; Sengül & Kiraz, 2005). During the final growth phase, sexual organs development and growth, particularly in females, may result in differences in growth function fit. Therefore, multiphase functions can be used, segmenting the
phases in different parts of the weighted development of animals.
Segmented polynomial or splines functions treat differently each region of the curve, and may defined as “polynomial segments of degree P, connected in points named “ties” or junction points, in order to have continuous derivatives of degree P-1" (Rice, 1969). The ties indicate where the curve changes its behavior. Tholon et al. (2003) obtained good fit of tinamous growth data using quadratic-quadratic segmented polynomial function, with R2
equal to 0.89, and tie at 35 days of age.
The fitting of growth curve models can be assessed by determination coefficient values (Freitas, 2005; Sengül & Kiraz, 2005), residue mean square values (Kni•ztová et al., 1991a e 1991b; Freitas, 2005; Sengül & Kiraz, 2005), Durbin-Watson’s statistical test (Grossman & Koops, 1988; Yakupoglu & Atil, 2001), possibility of biological interpretation of parameters (Braccini Neto, 1993; Freitas, 2005), mean error estimate (Freitas et al.,1984; Sengül & Kiraz, 2005), and easiness of convergence of parameter estimates (Yakupoglu & Atil, 2001), demonstrating the wide array of criteria to check goodness of fit of models. Therefore, the present study aimed at estimating tinamous (R. rufescens) growth curves, and verifying their goodness of fit.
M ATERIAL AND M ETHODS
This study was carried out at the Wild Animals Sector of the Department of Animal Sciences, School of Agrarian and Veterinary Sciences, State University of São Paulo, Jaboticabal campus.
Weight data from the progeny of breeders reared in family groups, which consisted of one to five females per male, were used. Data from four production years, from August, 2000 to June, 2004, were analyzed.
During this period, birds were reared in wire-mesh pens, measuring approximately 8 m2. The floor was covered with hay litter (Cynodon dactylon – Bermuda grass), and pens were located inside poultry houses with asbestos roof, and equipped with blue canvas curtains on the sides.
As to health management, only endo- and ectoparasite infestations were regularly checked. Tinamous houses were isolated from wild birds by wire-mesh screens, minimizing disease transmission. No vaccination program was used as, according to Sousa et al. (1999), these birds do not present Newcastle disease symptoms, and no symptoms of any other important diseases that affect traditional poultry production.
Eggs were collected and incubated daily. Average incubation temperature and relative humidity from 1 to 15 days of incubation were 35.5ºC and 60%, respectively. On day 16, eggs were transferred to the hatcher, where the same temperature and relative humidity were applied until hatch.
In order to determine the birds’ pedigree, eggs were identified with adhesive labels containing family number (pen), and egg sequential number. At hatching, birds were weighed and provisionally identified with rings of different colors in the legs, and then were transferred to the rearing pens, under similar conditions to those described above for breeders. When chicks reached approximately 90g, birds definitively identified by wing bands, containing six figure numbers, which replaces the provisional identification. Chicks were brooded during the first week of life.
Birds were weekly and individually weighed. When birds reached 250g, they were sexed by cloaca inversion, according to the procedure described by Moro (1991).
A total number of 13,164 weights from one- to 290-day-old birds was obtained. After preliminary consistency test, data on birds that were weighed less than 5 times and which parents had less than 3 known chicks were excluded. Therefore 11,639 weight data from 411 birds were used to estimate growth curves, being 6,671 from females, and 3,095 from males. These data were analyzed using least square methodology. Brody, von Bertalanffy, logistic, Gompertz, and quadratic-quadratic-quadratic spline functions fitting of the growth curves were performed using the NLIN procedure (SAS, 1998), and the modified method of Gauss-Newton, according to Silveira Jr. et al. (1992). Convergence criterion was 10 exp-9, as suggested by the default software option. The equations of the growth curve models are presented below.
Logistic model Y=a*(1+b*exp(-k*age))-1
Brody model Y= a*(1-b*exp(-k*age))
von Bertalanffy model Y= a*(1-b*exp(-k*age))3
Gompertz model Y=a*exp(-b*exp(-k*age))
Q-Q-Q spline function Y = a0 + a1X +a2X2
+ b1Z1 +b2Z2;
where:
Z1 = 0 if X ≤ K1; Z1 = (X – K1)
2
if X > K1; Z2 = 0 if X ≤ K2; Z2 = (X – K2)
2 if X > K 2;
For the model equations: Y = estimated weight at age x; a = asymptotic weight;
b = scale parameter; k = maturity index; X = bird age; a0 = intercept;
a1 = linear regression coefficient a2 = quadratic regression coefficient K = ties between polynomial segments
b1, b2 = difference between function quadratic coefficients.
In order to determine segmented polynomials, and to chose initial ties, visual inspection of points of graphs depicting average weights as a function of age on the weighing day was initially performed. Successive analyses were subsequently performed, in which the initially chosen tie was changed in order to find the best tie, which was determined when the analysis presented the lowest residual sum of squares and the highest coefficient of determination (R2
), after which model parameters were estimated (Schenkel, 1989).
The analysis of Richards function derivative fitting was based on the coefficient of determination (R2) of the models, residual mean square values (RMS), on the possibility of biological interpretation of the parameters, and easiness of convergence of parameter estimates. Mean prediction error (MPE) was obtained by the mean of all prediction errors (PE) based on each observation as a percentage of deviation between observed weight and estimated weight divided by the observed weight.
RESULTS AND DISCUSSION
All models estimated slightly higher values of a (asymptotic weight) for females, indicating minor sexual dimorphism in mature weight. In general, female mature weight was about 5.7% higher than male mature weight.
Estimates showed low standard errors, and the logistic, Gompertz, von Bertalanffy models presented the lowest values among non-linear functions, indicating the goodness of fit of these models for estimating this parameter.
The highest estimations of parameter b for females, males, and both sexes were obtained in the logistic, Gompertz, Brody, and von Bertalanffy models, respectively. The small difference between sexes is probably due to the dependence of this parameter on the ratio between initial weight and asymptotic weight fit for each model, and thus it suffer more influence from the function used than from the difference between sexes. Low standard errors indicate a good estimation of this parameter (Table 1).
The values estimated for parameter k (maturity index) were obtained, in decreasing order, in logistic, Gompertz, von Bertalanffy, and Brody models for females, males, and both sexes, respectively. There was little difference between sexes, stressing the influence of initial weight on mature weight in tinamous. The low standard error estimates show that excellent goodness of fit for this parameter (Table 1).
The coefficients of correlation among parameters of the different models and animal classes are presented in Table 2. The correlation among parameters indicates that heavier birds are less precocious due to the antagonism between parameters a and k. However, it must be noted that the values for the correlation between a (asymptotic weight) and k (maturity index) were moderate as estimated by the studied models. Similar results were obtained by Mignon-Grasteau et al. (1999). Nevertheless, the correlation between these parameters varies according to species, as the growth standard is influenced by many environmental and genetic factors.
Only the Brody model presented significant correlation (p<0.05) between parameters a and b, possibly due to the higher asymptotic weight estimates as compared to the other models. Correlation between parameters b and k was high and positive in the Brody model, and intermediate to low in the other models and birds classes (Table 2).
Estimates for females, males, and both sexes of the intercept (a0) of the quadratic-quadratic-quadratic segmented polynomial were 35.05476±4.54557; 33.58139±4.13711; and 31.01732±2.41339, respectively. Linear regression coefficient (a1) and quadratic regression coefficient (a2) estimates were 2.45959±0.21347; 2.58242±0.24941; 3.7898±0.13287; and 0.04099± 0.00267; 0.03525±0.00310; 0.02689±0.00152, respectively.
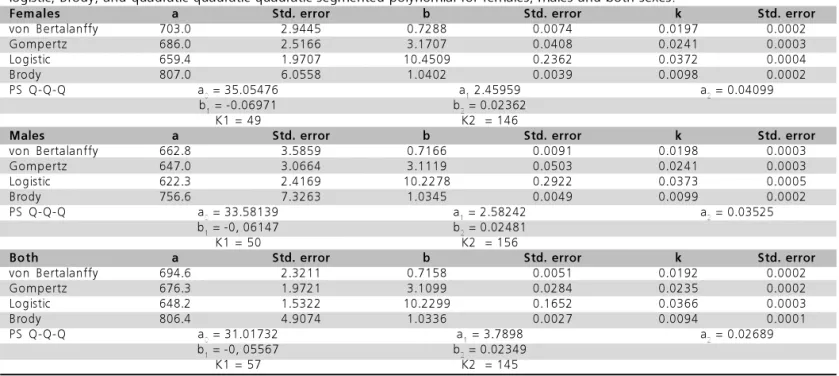
Table 1 – Estimated value means and standard errors of the tinamous growth curve parameter models von Bertalanffy, Gompertz,
logistic, Brody, and quadratic-quadratic-quadratic segmented polynomial for females, males and both sexes.
Females a Std. error b Std. error k Std. error
von Bertalanffy 703.0 2.9445 0.7288 0.0074 0.0197 0.0002
Gompertz 686.0 2.5166 3.1707 0.0408 0.0241 0.0003
Logistic 659.4 1.9707 10.4509 0.2362 0.0372 0.0004
Brody 807.0 6.0558 1.0402 0.0039 0.0098 0.0002
PS Q-Q-Q a0 = 35.05476 a1 2.45959 a2 = 0.04099
b1 = -0.06971 b2 = 0.02362
K1 = 49 K2 = 146
Males a Std. error b Std. error k Std. error
von Bertalanffy 662.8 3.5859 0.7166 0.0091 0.0198 0.0003
Gompertz 647.0 3.0664 3.1119 0.0503 0.0241 0.0003
Logistic 622.3 2.4169 10.2278 0.2922 0.0373 0.0005
Brody 756.6 7.3263 1.0345 0.0049 0.0099 0.0002
PS Q-Q-Q a0 = 33.58139 a1 = 2.58242 a2 = 0.03525
b1 = -0, 06147 b2 = 0.02481
K1 = 50 K2 = 156
Both a Std. error b Std. error k Std. error
von Bertalanffy 694.6 2.3211 0.7158 0.0051 0.0192 0.0002
Gompertz 676.3 1.9721 3.1099 0.0284 0.0235 0.0002
Logistic 648.2 1.5322 10.2299 0.1652 0.0366 0.0003
Brody 806.4 4.9074 1.0336 0.0027 0.0094 0.0001
PS Q-Q-Q a0 = 31.01732 a1 = 3.7898 a2 = 0.02689
b1 = -0, 05567 b2 = 0.02349
K1 = 57 K2 = 145
a = asymptotic weight; b = scale parameter; k = maturity index; a0 = intercept; a1 = linear regression coefficient; a2 = quadratic. Regression
0 50 100 150 200 250 300 350 400 450 500 550 600 650 700 750
1 15 29 43 57 71 85 99 113 127 141 155 169 183 197
age (days) W e ight ( g) -10 0 10 20 30 40 50 60 70 80 PE (g ) Von Bertalanffy
Obs av. weight
PE VB
0 50 100 150 200 250 300 350 400 450 500 550 600 650 700 750
1 15 29 43 57 71 85 99 113 127 141 155 169 183 197 age (days) W e ight ( g) -15 -10 -5 0 5 10 15 PE ( g ) Gompertz Obs av. w eight PE GP 0 50 100 150 200 250 300 350 400 450 500 550 600 650 700 750
1 15 29 43 57 71 85 99 113 127 141 155 169 183 197
age (days) Weight (g) -45 -20 5 30 55 80 105 130 155 180 PE (g ) Brody
Obs av. w eight PE BD 0 50 100 150 200 250 300 350 400 450 500 550 600 650 700 750
1 15 29 43 57 71 85 99 113 127 141 155 169 183 197 age (days )
we ight ( g ) -70 -60 -50 -40 -30 -20 -10 0 10 20 30 40 50 PE( g) Logistic Obs av. w eight PE LG
Figure 1– Estimates of prediction error (PE), observed and
fit-ted weight of tinamous (Rhynchotus rufescens), by the von
Bertalanffy model.
Figure 2 – Estimates of prediction error (PE), observed and fitted
weight of tinamous (Rhynchotus rufescens), by the Gompertz
model.
Figure 3 – Estimates of prediction error (PE), observed and fitted
weight of tinamous (Rhynchotus rufescens), by the Brody model.
Figure 4 – Estimates of prediction error (PE), observed and fitted weight of tinamous (Rhynchotus rufescens), by the logistic model.
Table 2 – Coefficient of correlation estimates of value a
(asymp-totic value), b (scale parameter) and k (maturity index) of tinamous growth curve models: Logistic, von Bertalanffy, Gompertz, and Brody of females, males, both sexes, and respective levels of significance (p).
Brody b p k p
Both a -0.22927 <0.0001 -0.56366 <0.0001
b 0.63566 <0.0001
Females a -0.15056 0.0342 -0.55128 <0.0001
b 0.56562 <0.0001
Males a -0.47035 <0.0001 -0.65463 <0.0001
b 0.78664 <0.0001
Gompertz b p k p
Both a 0.08775 0.0819 -0.31966 <0.0001
b 0.31405 <0.0001
Females a 0.09858 0.1060 -0.31063 <0.0001
b 0.31838 <0.0001
Males a 0.03516 0.6983 -0.37719 <0.0001
b 0.30209 0.0006
Logistic b p k p
Both a 0.06414 0.1983 -0.30672 <0.0001
b 0.20562 <0.0001
Females a 0.06189 0.3065 -0.27318 <0.0001
b 0.21457 0.0003
Males a 0.05387 0.5443 -0.40233 <0.0001
b 0.18937 0.0316
von Bertalanffy b p k p
Both a 0.01568 0.7628 -0.43051 <0.0001
b 0.35857 <0.0001
Females a 0.02359 0.7061 -0.45782 <0.0001
b 0.33692 <0.0001
Males a -0.04628 0.6233 -0.40503 <0.0001
b 0.43693 <0.0001
The differences between quadratic coefficients (b1 and b2) of the functions were:0.06971±0.00314; -0.06147±0.00360; -0.05566±0.00193; and 0.02362 ±0.00136; 0.02481±0.00169; 0.02349±0.00107, respectively, and the estimated ties for the three bids classes were 49 and 146; 50 and 156; and 57 and 145 days of age (Table 1).
Small differences were observed during the first growth phase between sexes. Growth pattern was different only after secondary sexual development (around 5 months of age). Male initial weight was lower than that of females, but their growth pattern was similar. Males were more precocious as compared to females, confirming the trend observed in previous functions relative to mature weight and sexual precocity.
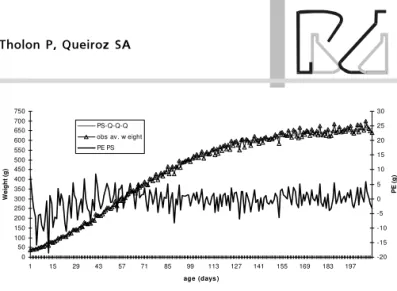
Based on the obtained parameters, growth curves were estimated for both sexes using von Bertalanffy, Gompertz, Brody, logistic, and quadratic-quadratic-quadratic segmented polynomial models (Figures 1, 2, 3, 4 and 5).
presented excellent goodness of fit until 210 days of age, with slight underestimation of weight from1 to 43 days of age (Figure 2). The Brody model showed lack of fit for the first 15 days of age, underestimating initial weights, and overestimating final weights after 30 weeks of age, as this model considers that the self-inhibition phase starts when the bird hatches (Figure 3), i.e., the inflection point occurs at hatching. The logistic model presented lack of fit in the first 70 days of age, overestimating initial weight, and was the only function to present such a behavior (Figure 4). Q-Q-Q segmented polynomial presented excellent goodness of fit for all categories, but overestimated initial weights until 29 days of age (Figure 5).
In all analyzed models, there were some fitting problems in the first and the last weeks of life, probably due to the fact that the birds lost weight during the first week of life, as they do not feed during this phase, and due to the lower number of birds weighed at later ages caused by mortality throughout the analyzed period.
Mean prediction error (MPE) estimates obtained from the mean of prediction errors estimated for each phase allow a better assessment of goodness of fit of the models. Estimates of mean, minimal, and maximal prediction error females, males, and both sexes are shown in Table 3.
Mean prediction error (MPE) estimates, in grams, in the von Bertalanffy model for both sexes, females, and males were, respectively, 4.2510; 0.7473; and 0.8353, indicating that, in general, this function underestimated the observed values. For the Gompertz model, these estimates were 0.0785; –0.3441; and 0.1715, overestimating, in general, values observed in females, and overestimating values observed in the two other classes. The Brody model presented MPE estimates of – 0.9458; -1.1297; and –0.6939, overestimating values observed in the three classes. The logistic function presented MPE estimates of –1.7774; -2.4271; and – 2.2457, overestimating, in general, the observed values. Q-Q-Q segmented polynomial presented MPE estimates of –0.3796; 1.1706; and –0.7544, underestimating, in general, values observed in females and overestimating, in general, values obtained from males and both sexes. The quadratic-quadratic-quadratic segmented polynomial and the Gompertz model presented similar trends as to growth function fit, with the highest PE at 245 and 242 days of age, respectively. The other models had worse fit at one and five days of age, indicating modeling difficulties in the first days, probably due to weight loss during this phase.
As to minimal PE values, the studied models did not present consistent similarities in terms of fit. There was age variation as a function of sex and used model (Table 3).
0 50 100 150 200 250 300 350 400 450 500 550 600 650 700 750
1 15 29 43 57 71 85 99 113 127 141 155 169 183 197 age (days )
W
e
ig
h
t (g
)
-20 -15 -10 -5 0 5 10 15 20 25 30
PE (
g
)
PS-Q-Q-Q obs av. w eight PE PS
Figure 5 – Estimates of prediction error (PE), observed and fitted weight of tinamous (Rhynchotus rufescens), by the quadratic-quadratic-quadratic segmented polynomial model.
Table 3 – Estimates of prediction errors (PE), mean prediction errors (MPE), and minimal (Min) and maximal (Max) prediction errors, in
grams for females, males, and both sexes (Both), using von Bertalanffy (VB), Gompertz (GP), Brody (BD), logistic (LG), and quadratic-quadratic-quadratic segmented polynomial (QQQSP) models.
Both PE VB PE GP PE BD PE LG PE QQQSP
MPE (g) 4.2510 0.0785 -0.9458 -1.7774 -0.3796
Min (g) -0.00598 0.001621 0.028337 0.017699 -0.0001
Age (days) 181 223 143 272 200
Max (g) 68.37831 -22.1836 152.1754 -61.1425 -21.71
Age (days) 1 245 1 1 245
Fêmeas PE VB PE GP PE BD PE LG PE PS
MPE (g) 0.7473 -0.3441 -1.1297 -2.4271 1.1706
Min (g) -0.00155 0.0229 0.103011 0.018353 -0.08457
Age (days) 121 109 146 149 226
Max (g) 56.8876 -24.0821 163.975 -65.8114 -18.8833
Age (days) 1 245 1 5 245
Males PE VB PE GP PE BD PE LG PE PS
MPE (g) 0.8353 0.017146 -0.6939 -2.2457 -0.7544
Min (g) -0.01676 -0.0098 0.005321 0.007995 0.000851
Age (days) 198 15 232 194 144
Max (g) 51.56798 -24.1767 150.9384 -67.3232 -24.0311
results as to goodness of fit, it did not provide parameters similar to the other studied models, and also depends on previous experience for the estimation of parameters, such as the determination of initial ties.
Using the von Bertalanffy model to describe tinamous growth from hatching to 230 days of age, Moro (1991) found overestimated weight after 85 days of age for females. This function did not provide goodness of fit for the growth of males, which weights were overestimated from 1 to six weeks of age and from 20 to 30 weeks of age, and underestimated in the interval between 8 and 17 weeks of age. Despite fitting deficiencies, the von Bertalanffy model was the only one that allowed tinamous weight modeling. Different results were reported by Menegheti et al. (1985), who found that the logistic model was the best to describe tinamous growth. These authors observed initial body weight stabilization at 19 weeks of age (663 g). These studies were carried out with birds reared on dirt floor. Tholon et al. (2003) used 4,833 weight data of tinamous of both sexes, and observed that Gompertz and von Bertalanffy functions best described growth. In that study, a quadratic-quadratic segmented polynomial was used, with the tie at 35 days of age, to model the growth curve, but the fitting criteria for this function were lower than those obtained using the above mentioned functions.
Growth curve parameters of animals belonging to the same species and reared in different environments must be compared with caution, as rearing conditions have a strong influence on performance. In addition, comparisons among results obtained with birds belonging to different species, despite possible, must be avoided, as growth patterns of each species present estimates with very different values. The literature reviewed for the present study mostly refer to other species, and therefore, discuss growth patterns of species that present different biological aspects in terms of growth.
CONCLUSIONS
The von Bertalanffy and the quadratic-quadratic-quadratic segmented polynomial were adequate to describe tinamous growth.
The model that best described tinamous growth was the Gompertz model, as it presents high R2 values, easiness of convergence, lower MPE, and allows the biological interpretation of its parameters.
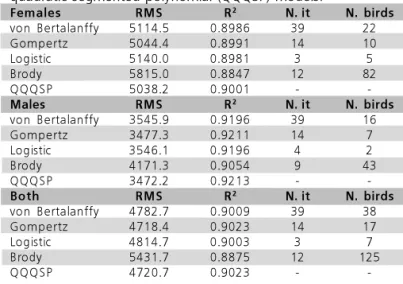
Coefficients of determination (R2
) and residual mean square (RMS) presented similar values in the studied models, indicating goodness of fit, and are presented in Table 4.
Table 4 – Coefficient of determination (R2), Residual Mean
Square (RMS), number of necessary iteractions for convergence (N. it), and number of birds with no parameter estimates of the growth curve of females, males, and both sexes, using von Bertalanffy, Gompertz, Brody, logistic, and quadratic-quadratic-quadratic segmented polynomial (QQQSP) models.
Females RMS R2 N. it N. birds
von Bertalanffy 5114.5 0.8986 39 22
Gompertz 5044.4 0.8991 14 10
Logistic 5140.0 0.8981 3 5
Brody 5815.0 0.8847 12 82
QQQSP 5038.2 0.9001 -
-Males RMS R2 N. it N. birds
von Bertalanffy 3545.9 0.9196 39 16
Gompertz 3477.3 0.9211 14 7
Logistic 3546.1 0.9196 4 2
Brody 4171.3 0.9054 9 43
QQQSP 3472.2 0.9213 -
-Both RMS R2 N. it N. birds
von Bertalanffy 4782.7 0.9009 39 38
Gompertz 4718.4 0.9023 14 17
Logistic 4814.7 0.9003 3 7
Brody 5431.7 0.8875 12 125
QQQSP 4720.7 0.9023 -
-The Gompertz and Q-Q-Q segmented polynomial models presented the lowest RMS values (4718.4 and 4720.7, respectively) and the highest R2
(0.9023 for both) values, indicating better goodness of fit of these models.
Another criterion used to evaluate goodness of fit was easiness of convergence to obtain parameters. Table 4 shows the number of iteractions needed for convergence, and the number of animals which growth curve parameters were not possible to estimate. The Q-Q-Q segmented polynomial model was not included, as it depends on previous knowledge of the curve for initial estimates of the ties.
The number of iteractions needed for convergence may not be the best indicator of easiness of convergence, as it depends on the initial values used in the iteraction process; however, the number of birds which growth curve parameters were not possible to estimate may suggest faster data analysis. The Brody model presented the highest number of birds with no parameter estimates, which was probably due to lack of fit during initial ages, a period where the highest number of weight data are concentrated.
The Brody and the logistic models presented lower goodness of fit, with the highest RMS and MSE, and the lowest R2 values due to fitting problems in the initial phase of growth.
REFERENCES
Anthony NB, Emmerson DA, Nestor KE, Bacon WL. Growth curves of Japanese quail as modified by divergent selection for 4-week body weight. Poultry Science 1986; 65:1825-1833.
Braccini Neto J. Estudo genético de curvas de crescimento de aves de postura [dissertação]. Pelotas (RS):Universidade Federal de Pelotas; 1993.
Bruneli FAT, Tholon P, Isaac FL, Damasceno PR, Tonhati H, Queiroz
SA. Caracterização da reprodução de perdizes (Rhynchotus
rufescens) em cativeiro. Ars Veterinária 2005; 21(2):272-280.
Carnio A, Moro MEG, Giannoni ML. Estudos para a criação e
reprodução em cativeiro de ave silvestre, Rynchotus rufescens
(tinamiformes), com potencial para exploração zootécnica. Ars Veterinaria 1999; 2:140-143.
Fowler ME. Zoo and wild medicine. Colorado: W.B. Sanders; 1986.
Freitas AR, Albino LFT, Michelan Filho T, Rosso LA. Modelos de curvas de crescimento em frangos de corte. Pesquisa Agropecuária Brasileira 1984; 19(9):1057-1064.
Freitas AR. Curvas de crescimento na produção animal. Revista Brasileira de Zootecnia 2005; 34(3):786-795.
Goliomytis M, Panopoulou E, Rogdakis E. Growth curves for body weight and major component parts, feed consumption, and mortality of male broiler chickens raised to maturity. Poultry Science 2003; 82:1061-1068.
Grossman M, Bohren BB. Comparison of proposed growth curve functions in chickens. Growth 1982; 46:259-274.
Grossman M, Koops WJ. Multiphasic analysis of growth curve in chickens. Poultry Science 1988; 67:33-42.
Kníztová H, Hyanek B, Knize B, Roubicek J. Analysis of growth curves of the fowl. I. Chickens. British Poultry Science 1991a; 32:1027-1038.
Kníztová H, Hyanek B, Knize B, Roubicek J. Analysis of growth curves of the fowl. II. ducks. British Poultry Science 1991b; 32:1039-1053.
Maruyama K, Akbar MK, Turk CM. Growth patterns and carcass development in male ducks selected for growth rate. British Poultry Science 1999; 40:233-239.
Menegheti JO, Frozi M, Burger MI. The growth curve of the
red-winged tinamou (Rhynchotus rufescens, Temminck, 1815) (aves,
tinamidae). Iheringia, Series Misc 1985; 1:47-54.
Mignon-Grasteau S, Beaumont C, Bihan-Duval E, Poivey JP,
Rochambeau H, Ricard FH. Genetic parameters of growth curve parameters in male and female chickens. British Poultry Science 1999; 40:44-51.
Mignon-Grasteau S, Beaumont C. Les courbes de croissance chez les oiseaux. Inra Productions Animales 2000; 13(5):337-348.
Moro MEG. Citogenética e alguns aspectos produtivos da
Rhynchotus rufescens – perdiz (aves: Tinamidae) [dissertação]. Jaboticabal (SP): UNESP; 1991.
Moro MEG.Desempenho e características de carcaça de perdizes
(Rhynchotus rufescens) criadas com diferentes programas de alimentação na fase de crescimento [tese]. Jaboticabal (SP): UNESP; 1996.
Moro MEG, Ariki J, Souza PA, Souza HBA, Moraes VMB, Vargas FC. Rendimento de carcaça e composição química da carne da perdiz
nativa (Rhynchotus rufescens). Ciência Avícola 2006;
36(1):258-262.
Nakage ES, Cardozo JP, Pereira GT, Queiroz AS, Boleli IC. Efeito da forma física da ração sobre a porosidade e espessura da casca, e desta sobre a perda de água e eclodibilidade de ovos de perdiz. Revista Brasileira de Ciência Avícola 2002; 4(3):227-234.
Rice JR. The approximation of functions.Masschusetts: Addison-Weslay; 1969.
SAS Institute. Users guide. Cary: SAS institute Incorporation; 1998.
Schenkel FS. Utilização de polinômios segmentados na pesquisa zootécnica: considerações teóricas e práticas [notas]. Porto Alegre (RS):UFRGS; 1989.
Sengül T; Kiraz S. Non linear models for growth curves in Large White turkeys. Turk Journal Veterinary Animal Science 2005; 29:331-337.
Sick H. Ornitologia brasileira, uma introdução. Brasilia: Universidade de Brasília; 1985. v.2
Silveira Jr. P, Zonta EP, Machado AA, Soffioni E S. Método de obtenção de estimativas preliminares de parâmetros de modelos não-lineares de crescimento. Pesquisa Agropecuária Brasileira 1992; 27(12):1607-1613.
Sousa R L M, Cardozo TC, Paulillo AC, Montassier HJ, Pinto AA. Antibody response to Newcastle disease vaccination in a flock of
young partridges (Rhynchotus rufescens). Journal of Zoo and Wildlife
Medicine 1999; 30(3):459-641.
Tholon P, Bruneli FAT, Freitas ECI, Tonhati H, Barbanti, JMD, Figueiredo G, Queiroz SA. Estudo de curvas de crescimento de
perdizes (Rhynchotus rufescens) criadas em cativeiro. In: 40a Reunião
Anual da Sociedade Brasileira de Zootecnia [CD-ROM]; 2003; Santa Maria, Rio Grande do Sul, Brasil.