Revista Árvore. 2017;41(5):e410503
MODELING
Tectona grandis
TREE AND STAND GROWTH USING STEM
ANALYSIS AND PERMANENT PLOT DATA
1Daniel Menezes de Novaes2, Ana Carolina de Albuquerque Santos3*, Carlos Pedro Boechat Soares4,
Haroldo Nogueira de Paiva4, Geraldo Gonçalves dos Reis4, Marco Antônio Monte5, Flávio Siqueira
Davila2 and Helio Garcia Leite4
1 Received on 23.01.2016 accepted for publication on 28.06.2017.
2 Universidade Federal de Viçosa, Mestrado em Ciência Florestal, Viçosa, Minas Gerais, Brasil. E-mail: <[email protected]> and <[email protected]>.
3 Universidade Federal de Viçosa, Programa de Pós-Graduação em Ciência Florestal, Viçosa, Minas Gerais, Brasil. E-mail: <[email protected]>.
4 Universidade Federal de Viçosa, Doutorado em Engenharia Florestal, Viçosa, Minas Gerais, Brasil. E-mail: <[email protected]>, <[email protected]>,<[email protected]> and <[email protected]>.
5 Universidade Fedderal Rural do Rio de Janeiro, Departamento de Silvicutura, Rio de Janeiro, Brasil. E-mail: <[email protected]>.
*Corresponding author.
ABSTRACT – The purpose of this study was to evaluate the efficiency of using total and partial analysis data of the trunk of Tectona grandis trees and of permanent plots, for the construction of site index curves and growth and production modeling, at the level of individual trees and of the settlement. Data were collected in settlements located in the State of Mato Grosso, with ages ranging from 2 to 10 years at the time of tree logging for trunk analysis. At that time, 40 permanent plots were installed, that were measured in the five subsequent years. Trunk analysis data obtained from those plots were used for validation of a variable density model. This model estimated the production with accuracy and consistency. Then, data from permanent plots were added to those of trunk analysis and the model was readjusted. It can be concluded that the trunk analysis of Tectona grandis trees is an efficient alternative of data collection for growth and production studies. The possibility of grouping past data, obtained by trunk analysis, with permanent plots, for growth modeling purposes, was also confirmed. Finally, the efficiency of trunk analysis data for growth modeling at a level of individual trees was evaluated and confirmed.
Keywords: Site index; Validation; Grouping data.
MODELAGEM DO CRESCIMENTO DE ÁRVORES E DE POVOAMENTOS DE
TECTONA GRANDIS UTILIZANDO DADOS DE ANÁLISE DE TRONCO E DE
PARCELAS PERMANENTES
1.INTRODUCTION
Even-aged forest management is primarily informed by three elements, namely land classification, prescription of growth parameters, and prediction of growing stock behavior and production for each management unit (Davis and Johnson, 1987; Campos and Leite, 2013). Land classification in particular encodes productive capacity; site indices are in turn used as inputs for predicting production. Therefore, both land classification and estimation of growing stock and harvesting yield require permanent plot or stem analysis data (Campos and Leite, 2013). Data from other sources, such as temporary plots or experimental designs, are often too restrictive for modeling and managing these two elements. Productive capacity, along with tree and/or stand growth modeling, is broadly treated here as growth and production modeling (GPM).
GPM can be calculated by sampling plots from stands through either minimum or maximum data stratification. The models for the first case, such as Clutter's (1963) or Buckman's (1962) model, are more comprehensive, with more independent explanatory variables. In the latter, the models are simpler, with production or growth expressed as a function of age only, using sigmoid or exponential models (Campos and Leite, 2013). In this case, predictive equations can be transformed for use in projections (Oliveira, 2005; Alcântara, 2012).
In Brazil, it is most efficient to use permanent plots in commercial plantations to determine GPM; nonetheless, data from permanent plots in continuous forest inventories (CFIs) are also employed (Campos and Leite, 2013). These inventories contain random plots within stands, with annual measurements performed up until right before cutting (Soares et al, 2011). The plots are stratified with respect to various parameters internal to the stands, including edaphic, climatic, and physiographic features, as well as continuous variables such as age and categorical variables such as cutting program and region.
In most cases, one plot is sampled for every 10 to 20 ha of CFI (Campos and Leite, 2013). Plot area varies between companies, but rarely exceeds 600 m², except when the stands are subjected to thinning. Every time a plot is analyzed, the diameters of all the trees, and the heights of some, are measured; the rest are estimated using either artificial neural networks (ANNs)
(Binoti et al., 2013a; Binoti et al., 2013b; Vendruscolo et al., 2015) or regression (Leite and Andrade, 2003; Nanos et al., 2004; Guimarães et al., 2009; Silva et al., 2009; Ribeiro et al., 2010; Soares et al., 2011; Mendonça et al., 2015). Meanwhile, the volume of each tree is obtained using volume or taper equations adjusted to the sample data (Thomas et al., 2006, De Souza et al., 2008; Leite et al., 2011; Soares et al., 2011; Campos and Leite, 2013), or through ANN models (Leite et al., 2001; Gorgens et al., 2009; Binoti et al., 2014). In the case of teak and eucalyptus, it is common to cut six trees per 2 cm diameter class (Campos and Leite, 2013), two in an intermediate condition and two in productive capacity extremes.
The use of stem analysis data for growth modeling and classifying productive capacity is an intuitive technique that is well attested in the literature (Carrom, 1968; Meyer, 1962; Novaes, 2009; Campos and Leite, 2013). However, in Brazil, Tectona grandis stands are still commonly analyzed using CFI plots. According to García (2005), data from both stem analysis and permanent plots are sometimes available, making it important to verify that the relationships between height and age are consistent with each other.
In Brazil, this is the most common way that variables necessary for eucalyptus, pine, and teak stand GPM are obtained. Depending on the company size, this process requires the measurement of a large number of plots every year, necessitating considerable investment. There are always many plots in the intermediate condition, which is not necessary for modeling; however, these plots are needed to better estimate confidence limits on the population mean (Campos and Leite, 2013).
One way to minimize sampling effort needed to obtain GPM data is to use a metaheuristic method to optimize sampling (Loures, 2014). In addition, when it is possible, complete and partial tree stem analysis data for a single age can be used (Campos and Leite, 2013). However, this second alternative applies more to hardwood, Araucaria, and Pinus species (Figueiredo Filho, 2001).
25° N. There has been a great deal of research into its silviculture, implantation, artificial debranching, thinning, and wood use (Torres, 1982; Långström and Helqvist, 1991; White, 1991; Torres et al., 1995; Bhat, 1995; Baillères and Durang,2000).
The total area devoted to teak planting in Brazil increases significantly each year; for example, between 2012 and 2013, there was an increase of about 20,941 ha (IBA, 2014). Given this widespread increase and the availability of growth ring visualization, it is important to evaluate the efficiency of the employment of stem analysis data in GPM. In addition, according to García (2005), both permanent plot and stem analysis data are available in certain cases; it is important to verify the consistency in growth trends of these two data sources.
The main objective of the present study is to validate the adjusted Clutter model put forth by Novaes (2009); this was to be accomplished using five measurements of permanent plots taken after complete and partial stem analysis. An additional objective was to corroborate past partial stem analysis data with those measurements, as well as to evaluate the accuracy of estimates generated by an individual tree model using only partial stem analysis data.
2.MATERIALS AND METHODS 2.1.Data Acquisition
The data for this study were obtained from Tectona grandis stands located in the municipality of Santo Antônio do Leverger, in the state of Mato Grosso, Brazil. The stands had an initial spacing of 3 x 2 m, and were subject to pre-commercial thinning with the goal of eliminating trees that were defective or dominant after the growing space was fully occupied. The ages of the trees in these stands varied from 2 to 10 years at the time of the initial data collection performed by Novaes (2009). At that time, a total of 40 permanent, rectangular plots measuring 60 x 20 m (1200 m²) were marked in the stands. The diameter at breast height (Dbh), in this case at 1.30 m from the soil for each tree, and the total height were measured for the first 15 trees in each plot. The diameter data were grouped into 2.0 cm diameter classes centered at Dbh. The height of the remaining trees in each plot were estimated using a regression model. These plots were measured over the following five years. In these plots, the height of
five dominant trees was also measured according to the process established by Assmann (1977). Data from these five trees were used to determine the dominant height of the plots for each age after stem analysis. 2.2.Complete stem analysis
A total of 32 dominant trees were selected for complete stem analysis. These trees were cut and wooden discs of about 3 cm in thickness were removed at cutting heights of 0.3 m, 1.3 m, and then every 2 m up from that point, up until the Dbh (Dbhob) was about 6 cm. Rings were counted using a transparent ruler over two orthogonal positions. In this manner, and following Clutter et al. (1983) and Campos and Leite (2013), height and age data pairs were obtained for each dominant tree. These data were used to adjust the logistical model in order to reach a classification of productive capacity; the guide curve method was used, with an index age of 8 years. The obtained curves were applied to the permanent plot data to validate the stem analysis classification.
2.3. Partial stem analysis and growth modeling In each plot, 2 cm diameter classes centered around Dbh were established, with one sample core collected from each of two trees in each class at a height of 1.3 m. According to Novaes (2009), this frequency of two trees was established arbitrarily; however, the entire range of diameter distribution of each plot was considered in the tree selection, aiming to follow the overall distribution within the corresponding stand. The cores were removed using an auger, after which they were attached to wooden containers with space for four cores (Campos and Leite, 2013). These containers were identified by plot number, tree, and Dbh class. The growth ring measurements completed by Novaes (2009) used a transparent ruler, graduated in millimeters, placed in two positions perpendicular to each other. The radius of each section and age was measured for each case. With the resulting data, the basal area and volume of each plot were calculated for the different reconstituted ages.
tree sampling data from another 138 trees that were felled in the stands. This analysis considered ages from 3 to 10 years and the diameter classes delineated for the corresponding plots for complete and partial stem analysis. This linear model was adjusted for each age.
Data from these 138 trees were also used to fit the non-linear form of the model to estimate tree volume developed by Schumacher and Hall (1933), LnHt = 0 +1 Ln(I) + 2 LnDbh + . The basal areas of each plot at different ages were obtained by multiplying the average sectional areas by the total number of surviving trees at the time of stem analysis. Finally, volumes were obtained using the formula V= 10000NV A-1 , where V is the volume per hectare without
bark, N is the total number of trees in the plot, V is the mean volume per tree in m3, and A is the plot area
in m2.
2.4. GPM
Data obtained through partial stem analysis were initially employed to fit a model to estimate growth in diameter. This model, developed by Pienaar and Shiver (1982), was used to estimate the stem diameter without bark for periods both before and after the age at which stem analysis was performed. The statistical models used were:
Volume, basal area, and site index data were collected for each plot at the age at which the stem analysis was performed and for previous ages; these data were then used to adjust Clutter's model (1963), appearing as it most frequently does in Brazil based on the work by Campos and Leite (2013):
The model was adjusted by the two-stage least squares method (Gujarati, 2001), after which the process was validated using the permanent plot data derived from the five measurements. In addition to graphical
analysis of the residue, the validation step included the calculation of the following parameters: mean absolute difference (MD), relative error (Bias%), and the correlation coefficient between observed and estimated values of production (m3 ha-1) (Siipilehto, 2000; Campos and
Leite, 2013), all calculated as follows:
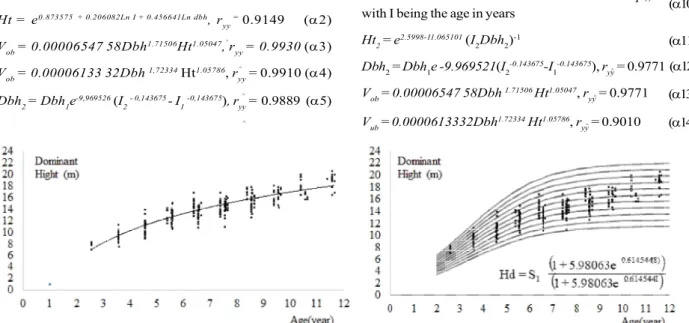
where a Yi, Yi and Y re the observed value, the value estimated by the model, and the observed mean value, respectively, and n is the number of cases. According to Campos and Leite (2013), these statistics were interpreted relative to previous, similar studies. To verify that the production curve tendency was the same before and after the stem analysis, the data observed in the five plot measurements were plotted on the estimated curves along with the stem analysis data. In addition, Clutter's model was also adjusted with the grouped stem analysis and permanent plot data. The site indices were defined by the classification made using the complete stem analysis data, given the consistency observed in Figure 1 (a, b). The estimates obtained by Clutter's model, with and without the inclusion of the permanent plot data, were compared both graphically and through the validation statistics.
3.RESULTS
The logistical model was considered adequate for constructing local index curves for the sampled stand. This is based on the observed consistency between the curves and the dominant heights of both the stem analysis (blue) and the permanent plots measured from 2008 to 2012 (black) (Figure 1 (a)). The estimated equation using data from the complete analysis of the trunk was Hd = 15.343068 (1 + 5.98063e 0.614544I) , where
I = age (years) and ryy = 0.9268; applying an index age Eq1 Eq3 Eq2 _ _
ε
+
e
Dbh
=
Dbh
β11 1 β 2
0I
I-β 1 2 ε + Dbh β + β =
Dbhob 0 1 ub
ε LnB β S β I β
LnV2 03 21 1 1 2 2
Ln S I I I I I I LnB
LnB
2 1 1 2 1 0 2 1 1
2 1 1
ni i i
Y Y n MDA 1 1 ˆ n i i i i Y Y Y n Bias 1 1 ˆ 100 %
n i im n Y
Y
1
1 ˆ
ˆ
of 8 years, the equation yielded:
Hd = S1
The expression 1 was used to construct the local index curves shown in Figure 1 (b), with the limits on dominant height based on site index. The transformation of this expression yielded the site indices for each plot and age. The growth trend in dominant height before and after stem analysis was similar (Figure 1 (a)).
In Figure 1, the dominant height data from the five plot measurements were plotted over the curves generated with the stem analysis data. This analysis was performed to verify the consistency between this data and the generated curves.
The adjusted equations for estimating bark diameter as a function of the respective non-bark diameters obtained from the stem analysis are presented in Table 1.
The equations 2, 3, 4 and 5 were adjusted to the felled and cubed sample tree data when completing stem analysis:
Ht = e0.873575+ 0.206082Ln I + 0.456641Ln dbh, r
yy = 0.9149 (2)
Vob = 0.00006547 58Dbh1.71506Ht1.05047, ryy = 0.9930 (3)
Vob = 0.00006133 32Dbh1,72334 Ht1.05786, r
yy = 0.9910 (4)
Dbh2 = Dbh1e-9,969526(I
2- 0,143675 - I1-0,143675), ryy = 0.9889 (5)
Clutter's model was adjusted with the reconstructed plots, with the age expressed in months, using the two-stage least squares method (Gujarati, 2010):
LnV2 = 1.43799 - 14.8093I2-1 + 0.014842S1 + 1.08090LnB2 LnB2 = LnB1I1I2-1 + 2.458695 (1-I1I2-1) + 0.057271 (1-I1I2-1)S1
By grouping the stem analysis data with the permanent plot data, the following system of equations was obtained:
LnV2 =1.2317 - 20.764112-1 + 0.0093S1 + 1.2415LnB2 (8)
LnB2 = LnB1I1I2-1 + 3.402703 (1-I
1I2-1) (9)
The validation statistics of the
(α )
6
,(α )
7
,(α )
8
, and(α )
9
models are presented in Table 2 and Figure 2. There was no bias in the estimates of acceptable accuracy when compared to similar studies (Cruz et al., 2008). The estimated tree-level equations, which yielded the individual tree model, were:LnHt = 0.873575 + 0.206082LnI + 0.456641Lndap;, with I being the age in years
Ht2 = e2.5998-11.065101 (I
2Dbh2)-1
Dbh2 = Dbh1e -9.969521(I2-0.143675-I1-0.143675), ryy = 0.9771
Vob= 0.00006547 58Dbh 1.71506Ht1.05047, r
yy = 0.9771
Vub = 0.0000613332Dbh1.72334Ht1.05786, r
yy = 0.9010 Eq4
(1 + 5.98063e 0.614544(8))
(1 + 5.98063e 0.614544I) (1)
(7) (6)
(10)
(11) (12)
(14) (13)
^
^
^
^
^
^
^
^
^
Figure 1 – Dominant height growth trends in data of the complete trunk analysis and in data from permanent plots, measured after trunk analysis (a) and site index curves for Tectona grandis, built with complete trunk analysis data, for an index age of eight (8) years, obtained by the curve fitting method (b). Black dots are dominant heights observed in permanent plots measured after trunk analysis
Age Class 0 1 R² F p-value Sxy
10 7.865344 0.706453 0.7143 11.00 0.0452 0.4536
8 2.813622 0.935632 0.9513 79.12 < 0.01 0.5843
7 0.560170 1.074103 0.9918 971.27 < 0.01 0.3153
6 0.411671 1.096542 0.9912 453.06 < 0.01 0.2044
5 0.679659 1.059668 0.9970 2299.68 < 0.01 0.2453
4 1.889067 0.974727 0.9962 2358.06 < 0.01 0.2238
3 0.639653 1.108563 0.9838 182.80 < 0.01 0.3424
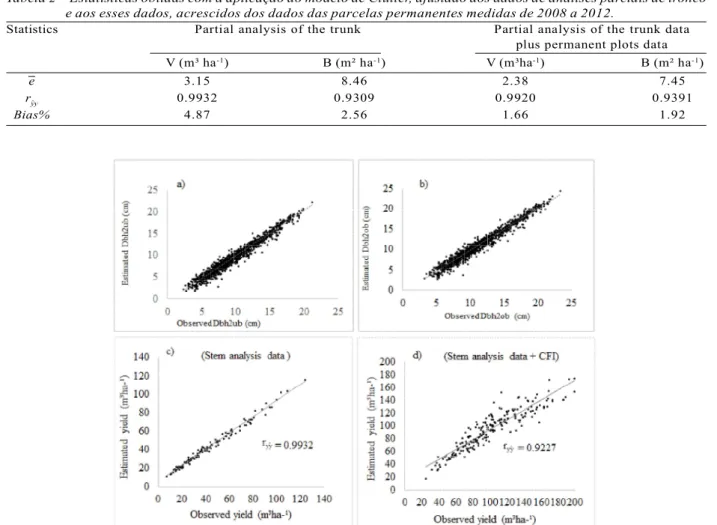
Statistics Partial analysis of the trunk Partial analysis of the trunk data plus permanent plots data
V (m³ ha-1) B (m² ha-1) V (m³ha-1) B (m² ha-1)
e 3.15 8.46 2.38 7.45
ryy 0.9932 0.9309 0.9920 0.9391
Bias% 4.87 2.56 1.66 1.92
Table 2 – Statistics obtained by the application of the Clutter model, adjusted to the data of partial analysis of the trunk and to such data were added those of the permanent plots measured from 2008 to 2012.
Tabela 2 – Estatísticas obtidas com a aplicação do modelo de Clutter, ajustado aos dados de análises parciais de tronco e aos esses dados, acrescidos dos dados das parcelas permanentes medidas de 2008 a 2012.
^
Figure 2 – Diameter estimated at a height of 1.3 m, under (a) and over (Dbh) (b), and the corresponding diameters observed in trunk analysis. Relationship between volumes estimated by the Clutter model adjusted to trunk analysis data (c) and to such data grouped with the data of permanent plots (d).
Figura 2 – Diâmetro estimado a 1,3 m de altura, sem (a) e com casca (dap) (b), e correspondentes diâmetros observados na análise de tronco. Relação entre volumes estimados pelo modelo de Clutter ajustado aos dados de análise de tronco (c) e aos esses dados agrupados aos dados de parcelas permanentes (d).
Table 1 – Coefficients of the adjusted equations for a diameter over bark at 1.3 m in linear function of the diameter under bark at this height (Dbhob = b0 + B1Dbhub + e), and their main statistics.
As mentioned, regular mortality was not considered part of the modeling since stem analysis is performed on live trees in real time. According to Campos and Leite (2013), when using stem analysis there is no way to know what the mortality was in previous years. In ddition, the stands were to be subjected to selective thinning at a low height. The diameter and volume estimates obtained with the previous equations were accurate and free of bias (Figure 2). The statistical parameters used in the validation also resulted in satisfactory values for production estimates, with less than 5% bias and mean absolute differences of 3.15 and 2.38 m3 ha-1 (Table 2).
The adjusted model incorporating stem analysis data was applied to developing projections of the tested permanent plots (Figure 3). Graphical analysis of the residue using this model is represented in Figure 2, where the modeling effectiveness can be verified. The statistical parameters relating to accuracy, e, ryy, and
Bias%, were obtained when the model was applied were.
The results of this study confirm the applicability of stem analysis data for GPM, either at the level of a stand or at the level of an individual tree. They also show that it is possible to group past data obtained with stem analysis with later data from permanent plots for growth modeling. This can decrease cost without affecting accuracy.
4.DISCUSSION
One of the more notable features of wood from Tectona grandis is that growth rings can be easily seen in various parts of the shaft. This allows for complete and partial stem analysis, quickly and inexpensively generating data for growth studies. In this study, it was possible to visualize and measure growth rings on the analyzed wood discs without any additional treatment.
Drescher (2004) reported using stem analysis data for teak growth and production, taking data from plants ranging in age from 2 to 10 years and with an initial spacing of 3 x 2 m. This study took place in the municipalities of Santo Antônio do Leverger and Brasnorte, in Mato Grosso. Both temporary plot data and partial and complete stem analysis data were used, with the complete analysis data being used to construct local index curves. The author presented hypsometric and volumetric equations. In addition, the volume per hectare was obtained using the mean basal area, the mean height, and an artificial form factor, estimated by means of regression; stand volume tables were subsequently generated. However, even though the data was available, no GPM models were generated as was done in the present study.
Bermejo et al. (2004) used data from 318 permanent plots, 500 m² in size, for the construction of empirical
^
Figure 3 – Production curves generated by the Clutter model adjusted to trunk analysis data (a) and production curves generated by the same model, adjusted to the data of partial analysis of the trunk and to such data were added those of the permanent plots measured from 2008 to 2012 (b). The data plotted in a and b are observed productions in permanent plots.
production tables for stands located in Guanacaste, Costa Rica. The volume per hectare was obtained by taking the product of the number of trees per hectare and the average diameter. Again, although it would have been possible, no GPM models were created.
Cruz et al. (2005) and Nogueira et al. (2000) reported using permanent plot data for the construction of teak GPM models. In the first study, a stand-level model was constructed for young and non-thinned plants located in Tangará da Serra, Mato Grosso. In the second study, an adjusted diameter distribution model was used for stands located in municipalities of this state. In this case, a two-parameter Weibull distribution was used to construct the model.
Novaes (2009) used stem analysis data to adjust and evaluate Clutter's and Buckman's models, modified by Silva (2001), in addition to working with a diameter distribution model. At the time, model validation was completed with permanent plot data measured both for the year in which stem analysis was performed and for the subsequent year. The possibility of obtaining consistent estimates of acceptable accuracy using stem analysis data was demonstrated in this case, both with the data used in the adjustment and with those measured in permanent plots for two consecutive years.
The efficiency of the adjusted model to project the diameters of individual trees demonstrates that modeling at the level of an individual tree can be efficiently accomplished using stem analysis data. However, this application is still limited in that it does not account for the mortality component. An alternative approach might be to merge stem analysis data with permanent plot data. This would necessitate installing a small number of plots at an early age in order to monitor survival until the first thinning. After the first thinning, it may no longer be necessary to model regular mortality, at least when thinning occurs at low heights (since the least fit individuals would be eliminated at each intervention).
This study confirms that it is possible to estimate teak stand growth and production using data from complete and partial stem analysis. These analytical methods should be used in special situations where no permanent plot data is available, and offer the advantage of providing data for older stages of plants by taking a single current sample.
5.CONCLUSIONS
Stem analysis is an efficient alternative by which to obtain data for growth and production studies of
Tectona grandis in Brazil, whether at the level of an individual tree or a stand.
Previously acquired data obtained with stem analysis and grouped with later data from permanent plot studies allows for studies of growth and production, without a loss of accuracy.
Although no economic analysis has been performed, it is possible that the use of both data sources can reduce modeling costs. This is because the permanent plots would be measured a certain amount of time after the stem analysis.
Clutter's model, in its most common form, efficiently modeled the growth and production of the stands sampled in this study.
6.REFERENCES
Alcântara, AEMD. Alternativas de modelagem para projeção do crescimento de eucalipto em nível de povoament. – Brasil [tese]. Viçosa -Universidade Federal de Viçosa; 2012.
Assmann E. The principles of forest yield study: studies in the organic production, structure, increment and yield of forest stands. New York: Elsevier; 2013.
Baillères H, Durang, PY. Non-destructive techniques for wood quality assessment of plantation-grown teak. Bois et Forêts des Tropiques. 2000(263):17-29.
Bermejo I, Cañellas I, San Miguel A. Growth and yield models for teak plantations in Costa Rica. Forest Ecology and Management. 2004;189:97-110.
Binoti MLMDS, Binoti DHB, Leite HG, Garcia SLR, Ferreira MZ, Rode R et al. Redes neurais
artificiais para estimação do volume de árvores. Revista Árvore. 2014a;38(2):283-8.
Binoti DHB, Binoti MLMS, Leite HG, Silva A. Redução dos custos em inventário de povoamentos equiâneos. Revista Brasileira Ciências Agrárias. 2013a;8:125-9.
Binoti DHB, Binoti MLMS, Leite HG. Configuração de redes neurais artificiais para estimação do volume de árvores. Ciência da Madeira. Pelotas. 2014b;5:58-67.
Bhat KM. A note on heartwood proportion and wood density of 8-year-old teak. Indian Forester. 1995;121(6):514-7.
Buckman RE. Growth and yield of red pine in Minnesota. Washington, DC: U.S. Department Agriculture; 1962. (Technical bulletin, 1272).
Campos JCC, Leite HG. Mensuração florestal: perguntas e respostas. 3ª ed. Viçosa, MG: Universidade Federal de Viçosa; 2013.
Carron LT. An outline of forest mensuration with special reference to Australia. Camberra: Australia National University; 1968.
Clutter JL. Compatible growth and yield models for loblolly pine. Forest Science. 1963;9(4):354-71.
Clutter JL, Fortson JC, Piennar LV, Brister GH, Bayley RL. Timber manegement : a quantitative approach. New York: Jonh Wiley & Sons; 1983.
Da Cruz JP, Leite HG, Soares CB, Campos JCC, Smit L, Nogueira GS et al. Modelos de
crescimento e produção para plantios comerciais jovens de Tectona grandis em Tangará da Serra, Mato Grosso. Revista Árvore. 2008;32:821-8.
Davis LS, Johnson KN. Forest management. 3ª.ed. New York: McGraw-Hill; 1987.
De Souza CAM, Chassot T, Finger CAG, Schneider PR, Fleig FD. Modelos de afilamento para o sortimento do fuste de Pinus taeda L. Ciência Rural. 2008;38(9):2506-11.
Drescher R. Crescimento e produção de Tectona grandis Linn F. em povoamentos jovens de duas regiões do estado do Mato Grosso – Brasil [tese]. Santa Maria: Universidade Federal de Santa Maria; 2004.
Guimarães MAM, Calegário N, Carvalho LMT, Trugilho PF. Height-diameter models in forestry with inclusion of covariates. Cerne. 2009;15:313-21.
Gujarati DN, Porter DC. Econometria básica. 5aed.
São Paulo: McGraw Hill Brasil; 2011.
García O. Comparing and combining stem analysis and permanent sample plot data in site index models. Forest Science. 2005;51(4):277-83.
Gorgens EB, Leite HG, Santos HN, Gleriani JM. Estimação do volume de árvores utilizando redes neurais artificiais. Revista Árvore.2009;33:1141-7.
Industria Brasileira de Árvores – IBÁ. Boletim técnico. [acessado em 21 de nov. de 2015]. Disponível em: http://www.iba.org/pt/.
Lamprechet H. Silvicultura nos trópicos. Berlim: GTZ, 1990.
Långström B, Helqvist C. Effects of different pruning regimes on growth and sapwood area of Scots pine. Forest Ecology and Management. 1991;44:239-54.
Leite HG, Andrade CL. Importância das variáveis altura dominante e altura total em equações hipsométricas e volumétricas. Revista Árvore. 2003;3:301-10.
Leite HG, Da Silva MLM, Binoti DHB, Fardin L, Takizawa FH. Estimation of inside-bark diameter and heartwood diameter for Tectona grandis Linn. trees using artificial neural networks. European Journal of Forest Research. 2011;130(2):263-9).
Loures NG. Pós amostragem seletiva para modelagem de crescimento de povoamentos de eucalipto [dissertação]. Viçosa, MG: Universidade Federal de Viçosa; 2014.
Mahaphol S. Teak in Thailand. Thailand: Minister of Agriculture-Royal, Forest Departament; 1954.
Mendonça AR,. Pádua Chaves S, Carvalho NC. Modelos hipsométricos generalizados mistos na predição da altura de Eucalyptus Cerne.
2015;21(1):107-15.
Meyer HA. Structure, growth and drain in
balanced uneven-aged forest. Journal of Forestry. 1952;50:85-92.
models. Forest Ecology and Management. 2004;195:221-35.
Nogueira LAH, Lora EES, Trossero MA, Frisk T. Dendroenergia: fundamentos e aplicações. Brasília: ANEEL; 2000.
Novaes DM. Modelagem de crescimento e produção de povoamentos de tectona grandis L.F. a partir de análise de tronco [dissertação]. Viçosa, MG: Universidade Federal de Viçosa; 2009.
Oliveira, MLR, Leite, H G, Nogueira, GS, Garcia, SLR., de Souza, AL (2008). Classificação da capacidade produtiva de povoamentos não desbastados de clones de eucalipto. Pesquisa Agropecuária Brasileira, 43(11):1559-1567.
Pienaar LV, Shiver BD. Survival functions for site prepared slash pine plantations in the flat woods of Georgia Northern Florida. Southern Journal Forestry. 1981;5(2):59-62.
Ribeiro A, Ferraz Filho AC, Mello JM, Ferreira MZ, Lisboa PMM, Scolforo JRS. Estratégias e metodologias de ajuste de modelos
hipsométricos em plantios de Eucalyptus sp. Cerne. 2010;16:22-31.
Schumacher FX, Hall FS. Logaritmic expression of timber volume. Journal of Agricultural Research. 1933;47(9):719-34.
Silva AAL. Emprego de modelos de crescimento e produção em análise econômica de decisões de manejo florestal [tese] Viçosa, MG: Universidade Federal de Viçosa; 2001.
Silva MLM, Binoti DHB, Gleriani JM, Leite HG. Ajuste do modelo de Schumacher e hall e
aplicação de redes neurais artificiais para estimar
volume de árvores de eucalipto. Revista Árvore. 2009;33:1133-9.
Soares CPB, De Paula Neto F, De Souza
AL. Dendrometria e inventário florestal. Viçosa, MG: Universidade Federal Viçosa; 2011.
Siipilehto J. A comparison of two parameter prediction methods for stand structure in Finland. Silva Fennica. 2000:34(4):331-49.
Streets RJ. Exotic forest trees in the British Commonwealth. Oxford: Clarendon Press; 1962.
Thomas C, Andrade CM, Schneider PR, Finger CAG. Comparação de equações volumétricas ajustadas com dados de cubagem e análise de tronco. Ciência Florestal. 2006;16:319-27.
Torres LA. Influencia del sitio y la espesura en el crecimiento de plantaciones de teca (Tectona grandis) en Caparo, Venezuela. Mérida: Universidad de Los Andes, Facultad de Ciencias Forestales; 1982.
Torres G, Luján R, Pineda, M. Diagnóstico técnico del proceso de producción forestal en plantaciones de pequeña escala en Costa Rica. Cartago: ITCR-CIIBI; 1995.
Trockenbrodt M; Josue J. Wood properties and utilisation potential of plantation teak (Tectona grandis) in Malaysia. Journal of Tropical Forest Products. 1999;5:58-70.
Vendruscolo DGS, Drescher R, Souza HS, Moura JPVM, Mamoré FMD, Siqueira TAS. Estimativa da altura de eucalipto por meio de regressão não linear e redes neurais artificiais. Revista Brasileira de
Biomassa. 2015;33(4):556-69.