Received March 1, 2010 and accepted February 23, 2011. Corresponding author: [email protected]
Curtain color and lighting program in broiler production: III - thermal comfort
Paulo Giovanni de Abreu1, Valéria Maria Nascimento Abreu1, Arlei Coldebella1, Fátima Regina Ferreira Jaenisch1, Doralice Pedroso de Paiva1
1 Embrapa Suínos e Aves, Br 153, Km 110, Caixa Postal 21 - 89700-000, Concórdia, Santa Catarina, Brasil.
ABSTRACT - The objective of this study was to evaluate the thermal comfort of broilers reared under two lighting programs (almost continuous and intermittent) in broiler houses with yellow or blue lateral curtains. The experiment was carried out from June 24, 2004 until May 12, 2005. Six consecutive flocks were housed in four 12 × 10 m broilers houses internally divided into four pens of 200 birds each. Six flocks were raised on the same litter. The registration of data was accomplished at 3-hour intervals, for 24 hours twice a week. In the center of each pen and outside the house, dry and wet bulb temperatures, black globe temperature, and air velocity were collected. Based on the data collected at each time, air temperature (AT) (ºC), black globe humidity temperature index (BGHTI), radiant thermal load (RTL) (W/m2), and relative air humidity (RH) were
determined. Harmonic analysis was used to estimate m, R, and f parameters. In general, the best results in terms of thermal comfort for the birds were found when near-continuous lighting program and yellow curtain were used.
Key Words: animal environment, poultry house, thermal index
ISSN 1806-9290 www.sbz.org.br
Introduction
The “optimal climate”, which does not require any adjustment to provide thermal comfort for poultry reared indoors, does not exist in Brazil. In every Brazilian region, the climate factor needs to be corrected to provide favorable environmental conditions to birds. Heat, cold, and daily temperature variation (thermal range) are the weather factors that most affect poultry behavior, performance, and disease resistance. When internal poultry house conditions are adequate, birds respond with high weight gain and feed intake, low feed conversion ratio and low mortality. In addition, as described by Perdomo (1998), energy costs (gas, wood, and electricity) to heat and/or cool the environment are reduced. According to that author, it is necessary to store heat to protect broilers under 28 days from “environmental chilling” during the night in every month of the year. One solution is to prevent the loss of heat generated inside the poultry house to the outside, saving heating costs. The use of side curtains to control ventilation and a drop ceiling (both made of waterproof material) are sufficient to reduce internal heat losses.
The placement of curtains outside the sides of poultry houses aims to prevent the entrance of sun rays and rain inside the poultry house and to control lightness and ventilation inside the house. Curtains made of different fibers, porous, of special plastic mesh or canvas allow gas
exchange with the outside, and only work as wind shields, and are not capable of providing insulation (Abreu & Abreu, 2001a).
In commercial broiler production, yellow curtains are commonly used; however, blue curtains have been recommended. It should be noted that there is little scientific information on the use of blue curtains, particularly in open-sided poultry houses with automation or with air conditioning and that apply lighting programs to stimulate feed intake.
The objective of lighting programs is to regulate feed intake. Continuous photoperiods can be applied as a continuous lighting program (24 hours of light). Nearly continuous (23L:1D + 16L:8D, where L = hours of light; D = hours of darkness), and intermittent light programs are characterized by presenting repeated periods of light and darkess within 24 hours (Classen, 1996).
The proposal of the present study was based on the assumption that curtain color may provide a more or less comfortable environment to broilers, and that lighting programs may increase or reduce bird movement, consequently resulting in higher or lower heat dissipation to the environment, affecting thermal comfort. Therefore, the objective of this study was to evaluate the thermal comfort of broilers reared under two different lighting programs (nearly continuous and intermittent) in broiler houses equipped with yellow or blue curtains.
Material and Methods
The trial was carried out at Campo Experimental de Suruvi, belonging to Embrapa Suínos e Aves, in Concórdia, Santa Catarina, Brazil, and located at 27° 14' 02"S and 52° 01' 40"W, between June 24, 2004 and May 12, 2005. Six consecutive broiler flocks were reared in four broiler houses measuring 12 m ×10 m, internally divided into four pens , each one housing 200 birds.
A total of 19,200 Ross males was distributed according to a completely randomized experimental design in a 6 × 2 × 2 factorial arrangement (six flocks, two lighting programs and two curtain colors), with four replicates per treatment. The first flock was housed on new litter, which was reused by the subsequent flocks. Litter was replaced only in the brooding area. Light was provided by 60 W incandescent light bulbs. Treatments consisted of curtain color (yellow or blue) and two lighting programs (nearly continuous: 23L:1D; intermittent: 16L:2D + 1L + 2D, where L = hours of light and D = hours of darkness) distributed as follows: house 1 = blue curtain and intermittent light; house 2 = yellow curtain and intermittent light; house 3 = yellow curtain and nearly continuous light; house 4 = blue curtain and nearly continuous light.
Environmental parameters were recorded twice a week during 24 hours every three hours. A dry-bulb thermometer, a wet-bulb thermometer, and a black-globe thermometer were placed in each pen and outside the broiler houses. Air velocity was recorded using an anemometer. Based on the data recorded in the internal and external environment, air temperature (AT, ºC), wet bulb globe temperature (WBGT), radiant heat load (RHL, W/m2), and relative air humidity (RH, %) were determined. Internal environment was evaluated using harmonic analysis, according to Morettin & Toloi (2004), by applying the model (1): yt = µ + R cos(ωt + φ) + εt, in which:
yt = observed value of the parameters in time t; µ = mean;
R = range; φ = phase angle; ω = frequency, in this case fixed
as π/12, and εt = random component. In order to evaluate
the effect of lighting programs and curtain color on parameters µ, R and φ, their estimates were calculated for
each combination of treatment, flock, week and pen. Based on these estimates, the effects of flock, curtain color, lighting program, week and the interactions of the last three factors on parameters µ, R and φ were evaluated
through the theory of mixed models for repeated measures and 15 types of variance and covariance matrix, applying PROC MIXED of SAS statistical package (SAS Institute Inc, 2003), as described by Xavier (2000). The structure used in the analysis was chosen based on the lowest value of the Akaike Information Criterion (AIC). The maximum restricted likelihood was used as estimation method. Harmonic analysis was also applied to external environmental data, estimating parameters µ, R and φ for each flock and
week and, finally, calculating the general mean of these parameters in order to compare the curves of internal environment parameters with those of the external environment.
Results and Discussion
The main effects of flock, week and curtain color were significant (P<0.005) for all parameters, whereas the effect of lighting program and of the interaction curtain color × lighting program were significant for air temperature, wet bulb globe temperature and radiant heat load (Table 1).
The details of the interaction curtain × light show that there was no effect of curtain colon on air temperature, wet bulb globe temperature and radiant heat load when the nearly continuous lighting program was used (Table 2). However, when the intermittent lighting program was applied, the lowest parameter values were obtained with the yellow curtain. Considering curtain color, there were no differences in those parameters when yellow curtains were used. When houses had blue curtains, the lowest values were obtained with the nearly continuous lighting program. Therefore, in general, the highest values were obtained with blue curtains and intermittent lighting program. However, air temperature was similar among the four broiler houses. In any study on the physiological response of animals to environmental factors or on the effect of housing
Causes of variation Air temperature Wet bulb globe temperature Radiant heat load Relative humidity
Flock <0.0001 <0.0001 <0.0001 <0.0001
Curtain 0.0017 0.0095 0.0079 0.0071
Light 0.0060 0.0149 0.0007 0.2898
Week <0.0001 <0.0001 <0.0001 <0.0001
Curtain × light <0.0001 0.0039 <0.0001 0.5404
Light × week 0.3712 0.4932 0.5574 0.7127
Curtain × week 0.9997 0.9947 0.9745 0.9312
Curtain × light × week 0.9117 0.9800 0.8265 0.1779
environment on animal performance, comfort, and welfare, the environment where animals are housed needs to be numerically described. In the present study, air temperature, wet bulb globe temperature, and radiant heat load were higher in the house equipped with blue curtains and using intermittent lighting program (Table 2). Relative air humidity was only influenced by curtain color, and the highest relative humidity values were obtained in houses with blue curtains (Table 2). According to Abreu & Abreu (2001b), 60 to 70% are the optimal air relative humidity values for broilers, regardless of age, but all the values obtained in the present experiment were higher than these recommendations. Oliveira et al. (2006), when studying the effects of temperature and relative humidity on the performance and carcass cuts’ yield of 1- to 49-day-old broilers, concluded that high temperature impaired the performance and carcass yield of these broilers, and these effects are more stressed when relative air humidity goes up. Furtado et al. (2003) analyzed the thermal comfort of poultry houses with different environmental conditioning systems and concluded that air temperature, wet bulb
globe temperature, and radiant heat load during the hottest periods of the day reached excessive values for broilers, but relative air humidity remained within the optimal range. As shown by the analysis of ranges (R) (Table 3), the main flock and week effects were significant (P<0.01) for all parameters, and curtain color significantly influenced (P<0.05) AT and relative humidity, whereas the interaction curtain × light was significant for relative humidity.
In order to maintain broiler comfort, the range of environmental parameters must be as narrow as possible. Houses with yellow curtains and intermittent lighting program provided the narrowest AT range (Table 4) and the lowest range was obtained with the intermittent lighting program and blue curtains.
On phi (φ) values, there was only flock and week effects
(Table 5). Phi is the phase angle, i.e., it determines the behavior of the curve. These results show that the curves describing the behavior of temperature, WBGT, radiant heat load and relative humidity, are changed only by flock and week, which depend on weather changes and the season during which the experiment was carried out.
Non-structure variance and covariance matrix structures were used.
Causes of variation Air temperature Wet bulb globe temperature Radiant heat load Relative humidity
Flock <0.0001 <0.0001 <0.0001 <0.0001
Curtain 0.0092 0.0724 0.3338 0.0150
Light 0.0019 0.5611 0.7258 0.1165
Week <0.0001 <0.0001 <0.0001 <0.0001
Curtain × light 0.0947 0.2392 0.4873 0.0500
Light × week 0.9127 0.4296 0.7961 0.4861
Curtain × week 0.9336 0.8846 0.9571 0.8682
Curtain × light × week 0.9838 0.9864 0.8919 0.8956
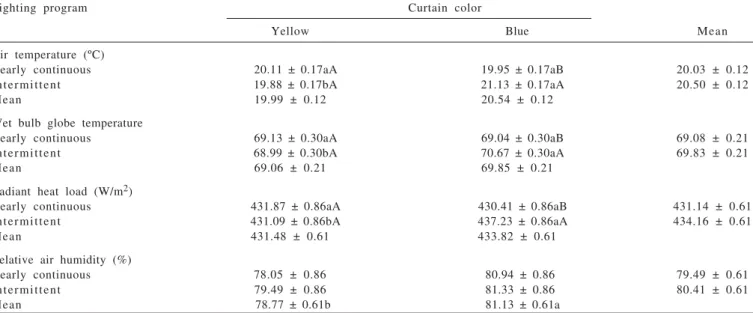
Table 3 - Analysis of air temperature, wet bulb globe temperature, radiant heat load and air relative humidity ranges
Lighting program Curtain color
Yellow Blue Mean
Air temperature (ºC)
Nearly continuous 20.11 ± 0.17aA 19.95 ± 0.17aB 20.03 ± 0.12
Intermittent 19.88 ± 0.17bA 21.13 ± 0.17aA 20.50 ± 0.12
Mean 19.99 ± 0.12 20.54 ± 0.12
Wet bulb globe temperature
Nearly continuous 69.13 ± 0.30aA 69.04 ± 0.30aB 69.08 ± 0.21
Intermittent 68.99 ± 0.30bA 70.67 ± 0.30aA 69.83 ± 0.21
Mean 69.06 ± 0.21 69.85 ± 0.21
Radiant heat load (W/m2)
Nearly continuous 431.87 ± 0.86aA 430.41 ± 0.86aB 431.14 ± 0.61
Intermittent 431.09 ± 0.86bA 437.23 ± 0.86aA 434.16 ± 0.61
Mean 431.48 ± 0.61 433.82 ± 0.61
Relative air humidity (%)
Nearly continuous 78.05 ± 0.86 80.94 ± 0.86 79.49 ± 0.61
Intermittent 79.49 ± 0.86 81.33 ± 0.86 80.41 ± 0.61
Mean 78.77 ± 0.61b 81.13 ± 0.61a
Means followed by different small letters in the same row and different capital letters in the same column are different (P≤0.05) by the F test.
Table 5 - Summary of the phi analysis for air temperature, wet bulb globe temperature, radiant heat load and relative air humidity Causes of variation Air temperature Wet bulb globe temperature Radiant heat load Relative humidity
Flock <0.0001 <0.0001 <0.0001 <0.0001
Curtain 0.9808 0.5537 0.6854 0.2353
Light 0.0629 0.8208 0.4465 0.0666
Week <0.0001 <0.0001 <0.0001 <0.0001
Curtain × light 0.4101 0.6440 0.4600 0.5050
Light × week 0.5501 0.5734 0.5121 0.0782
Curtain × week 0.7440 0.6591 0.3443 0.8804
Curtain × light × week 0.3846 0.6849 0.5809 0.4909
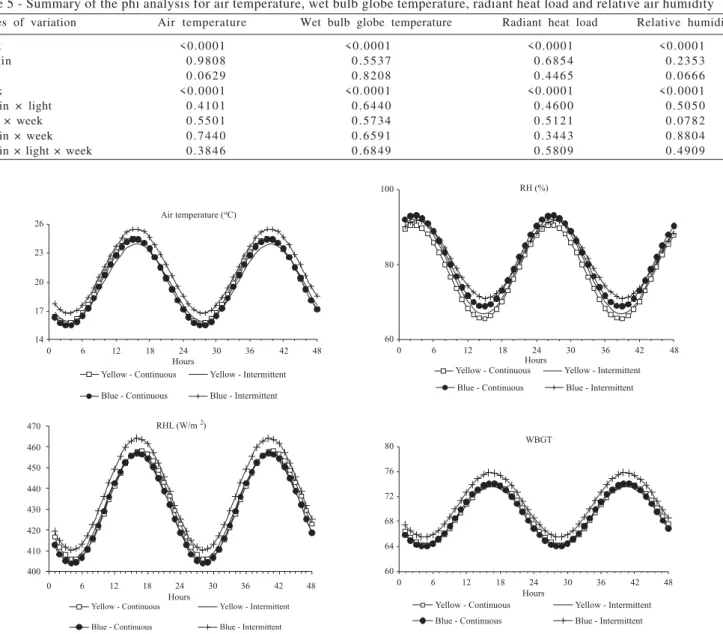
Figure 1 - Air temperature, WBGT, radiant heat load and relative humidity during the experiment.
Lighting program Curtain color
Yellow Blue Mean
Air temperature (ºC)
Nearly continuous 4.43 ± 0.08 4.51 ± 0.08 4.47 ± 0.06A
Intermittent 4.05 ± 0.08 4.39 ± 0.08 4.22 ± 0.06B
Mean 4.24 ± 0.06b 4.45 ± 0.06a
Wet bulb globe temperature
Nearly continuous 4.93 ± 0.20 5.06 ± 0.20 4.99 ± 0.14
Intermittent 4.59 ± 0.20 5.18 ± 0.20 4.88 ± 0.14
Mean 4.76 ± 0.14 5.12 ± 0.14
Radiant heat load (W/m2)
Nearly continuous 26.22 ± 1.02 26.50 ± 1.02 26.36 ± 0.72
Intermittent 25.16 ± 1.02 26.85 ± 1.02 26.01 ± 0.72
Mean 25.69 ± 0.72 26.68 ± 0.72
Relative air humidity (%)
Nearly continuous 12.49 ± 0.53aA 12.21 ± 0.53aA 12.35 ± 0.37
Intermittent 12.69 ± 0.53aA 10.33 ± 0.53bB 11.51 ± 0.37
Mean 12.59 ± 0.37 11.27 ± 0.37
Mean phi values (Figure 1) demonstrate that the slope angle is similar among lighting programs and curtain colors. Those values also describe the opposite behavior of air relative humidity when compared to the other parameters, that is, when AT, WBGT and radiant heat load increased during the day, air relative humidity decreased.
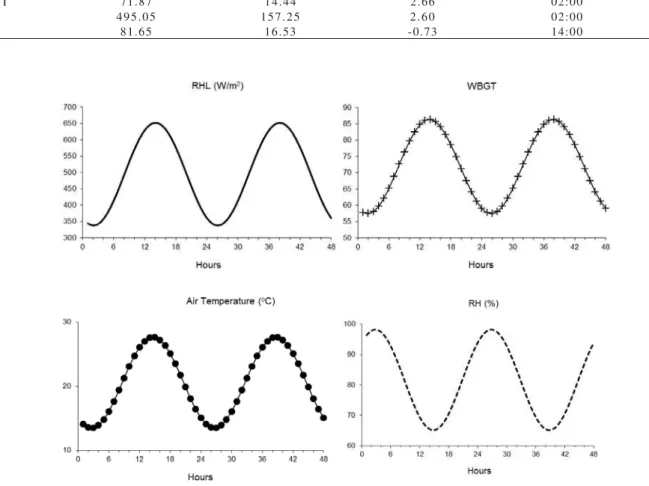
Minimal AT, WBGT and radiant heat load values were recorded around 2 a.m. and maximal values at 2 p.m., contrarily to the relative humidity data observed. The
behavior of the external environment parameters is similar to those of the internal environment (Figure 2, Table 6). As expected, the internal environmental conditions were more favorable to the broilers. Air temperature, wet bulb globe temperature, radiant heat load and relative air humidity values corresponding to the treatments followed the same cyclic trends as the external parameters, as shown by the parameter means (intercept values) and narrower range of these parameters inside the broiler house.
Conclusions
The best broiler thermal comfort conditions are obtained using the nearly continuous lighting program and yellow curtains.
References
ABREU, P.G.; ABREU, V.M.N. Função e manejo da cortina em aviários. Concórdia: Embrapa Suínos e Aves, 2001a. 2p. (Embrapa Suínos e Aves. Comunicado Técnico, 273).
ABREU, V.M.N.; ABREU, P.G. Diagnóstico bioclimático para produção de aves no Oeste Paranaense. In: CONGRESSO BRASILEIRO DE ENGENHARIA AGRÍCOLA – CONBEA, 30., 2001, Foz do Iguaçu. Anais... Foz do Iguaçu: SBEA, 2001b. (CD-ROM).
CLASSEN, H.L. Principios sobre el manejo de luz em pollos de engorde. Avicultura Professional, v.14, n.2, p.21-27, 1996. FURTADO, D.A.; AZEVEDO, P.V.; TINÔCO, I.F.F. Análise do conforto térmico em galpões avícolas com diferentes sistemas de acondicionamento. Revista Brasileira de Engenharia Agrícola e Ambiental, v.7, n.3, p.559-564, 2003.
OLIVEIRA, R.F.M.; DONZELE, J.L.; ABREU, M.L.T. et al. Efeitos da temperatura e da umidade relativa sobre o desempenho e o
Parameter Intercept (µ) Range (R) Phi (φ) min. T max. T
A T 20.57 7.08 2.45 03:00 15:00
WBGT 71.87 14.44 2.66 02:00 14:00
RHL 495.05 157.25 2.60 02:00 14:00
RH 81.65 16.53 -0.73 14:00 02:00
Table 6 - Mean intercept, range, phi and maximum and minimum points of external environmental parameters
rendimento de cortes nobres de frangos de corte de 1 a 49 dias de idade. Revista Brasileira de Zootecnia, v.35, n.3, p.797-803, 2006. MORETTIN, P.A.; TOLOI, C.M.C. Análise de séries temporais.
São Paulo: Edgar Blücher, 2004. 535p.
PERDOMO, C.C. Uso do pvc (viniagro) na melhoria do condicionamento ambiental de frangos de corte. Concórdia: Embrapa Suínos e Aves, 1998. 4p. (Comunicado Técnico, 227).
STATISTICAL ANALYSES SYSTEM - SAS. System for Microsoft Windows: release 9,1. Cary: 2002-2003. (CD-ROM). XAVIER, L.H. M o d e l o s u n i v a r i a d o e m u l t i v a r i a d o p a r a