Recebido para publicação em 14/8/2007 Aceito para publicação em 28/10/2008 (002760)
1 Department of Agricultural and Environmental Engineering, University of Agriculture, Makurd, Nigeria, E-mail: [email protected] 2 Department of Food Science and Technology, University of Agriculture, Makurdi, Nigéria
*A quem a correspondência deve ser enviada
Moisture adsorption characteristics of ginger slices
Características de adsorção de umidade de gengibre em fatias
Joseph ALAKALI2, Simon Verlumun IRTWANGE1*, Adesola SATIMEHIN1
Resumo
As características da adsorção de umidade de amostras de gengibre secas foram estudadas para se determinar o efeito das condições de armazenamento com o propósito de se prever a vida de prateleiraou validade, a seleção de materiais apropriados para empacotamento, avaliar a bondade de ajuste dos modelos de sorção e determinar a termodinâmica da adsorção de umidade para aplicação em secagem. Houve um efeito significativo (p ≤ 0,05) da atividade de água, da temperatura e do pré-tratamento sobre o teor de umidade de equilíbrio higroscópico das amostras de gengibre secas. Sob atividade de água constante (aw), o teor de umidade de equilíbrio higroscópico (CEM) diminuiu com o aumento da temperatura. O teor de umidade de equilíbrio higroscópico de todas as amostras aumentou com o aumento da atividade de água, sob temperatura constante. A umidade de sorção das amostras de gengibre com casca foi maior do que a das amostras de gengibre sem casca enquanto que a das amostras de gengibre não escaldo com e sem casca foi maior do que a das amostras de gengibre escaldado com e sem casca. A equação de Henderson permite previsões mais exatas das isotermas com o menor valor de média quadrática percentual (%RMS) e, portanto, descreve melhor os dados de adsorção dos modelos de Guggenheim Anderson De-Boer (GAB), Oswin e Halsey, nesta ordem. A umidade de monocamada, em geral, diminuiu com a temperatura em todas as amostras. O calor isostérico diminuiu quando o teor de umidade se aproximou do valor assimptótico ou o calor latente de vaporização da água pura (∆Hst = 0), enquanto que a entropia de sorção aumentou com o teor de umidade.
Palavras-chave: modelos de sorção; termodinâmica; atividade de água; amostras de gengibre. Abstract
The moisture adsorption characteristics of dried ginger slices was studied to determine the effect of storage conditions on moisture adsorption for the purpose of shelf life prediction, selection of appropriate packaging materials, evaluate the goodness-of-fit of sorption models, and determine the thermodynamics of moisture adsorption for application in drying. There was a highly significant effect (p ≤ 0.05) of water activity (aw), temperature, and pre-treatment on the equilibrium moisture content (EMC) of the dried ginger slices. At constant aw, the EMC decreased as temperature increased. The EMC of all samples increased as the aw increased at constant temperature. The sorbed moisture of the unpeeled ginger slices was higher than the peeled while those of unblanched samples were higher than the blanched. Henderson equation allows more accurate predictions about the isotherms with the lowest %RMS, and therefore, it describes best the adsorption data followed by GAB, Oswin, and Halsey models in that order. The monolayer moisture generally decreased with temperature for all samples. The isosteric heat decreased with moisture content approaching the asymptotic value or the latent heat of vaporization of pure water (∆Hst = 0) while the entropy of sorption was observed to increase with moisture content.
Keywords: sorption models; thermodynamics; water activity; ginger slices.
1 Introduction
Ginger (Zinziber officinale) was one of the earliest oriental species known in Europe in the 9th century. In the 13th century, it
was introduced to East Africa by the Arabs. In West Africa and other parts of the tropics, it was introduced by the Portuguese in the 16th century (KOCHHAR, 1981). India remains the world’s
largest producer of ginger accounting for more than 50% and Nigeria is one of the top producers.
Ginger is required on a daily basis. In most households, it is used as local medicine and as spice for flavoring and seasoning (AERLS, 1987). The ginger used for commercial purposes is the dried rhizome. It is used in the raw fresh state in small quanti-ties. Kochhar (1981) reported that the methods of preparing ginger vary in different producing countries. The important
grades of dried ginger recognized in the spice trade market are the scrapped or peeled ginger known as uncoated, and the unscrapped or unpeeled ginger. In some countries, the rhizomes are plunged into boiling water for a few minutes (scalded) and then dried. Since the ginger available in the international market is in the dried form, it is necessary to study moisture sorption characteristics of dried ginger. Moisture sorption data is useful for shelf life prediction and selection of appropriate packaging materials. It also serves as useful information for determining the interaction of water, food material, and the thermodynamics of the process (CENKOWSKI; JAYAS; HAO, 1992; ARIAHU; KAZE; ACHEM, 2006).
slices to evaluate the goodness-of-fit of sorption models and to determine the thermodynamics of moisture adsorption of ginger slices.
2 Materials and methods
2.1 Sample preparation
Yellow ginger rhizomes were purchased from a local mar-ket in Makurdi, Nigeria. The ginger rhizomes were thoroughly washed in tap water and divided into three portions. One por-tion was peeled with a stainless steel knife and cut into slices about 2-3 mm thick. The peeled slices were divided into two parts. One part was blanched at 65 °C for 3 minutes in a labora-tory bath. The unpeeled portion was also cut into 3 mm slices and divided into two parts. One part was blanched in 65 °C for 3 minutes using a laboratory bath. All slices were dried in an electric oven (Model T12H Genlab, England) at 65 °C for 48 hours to produce Peeled Ginger Slices (PGS), Peeled-Blanched Ginger Slices (PBS), Unpeeled Ginger Slices (UGS), and Unpeeled-Blanched Ginger Slices (UBS). The four samples were further dried in desiccators over concentrated sulphuric acid for seven days. The samples were sealed in polythene bags and kept in separate airtight containers to be used in the sorp-tion studies.
2.2 Determination of moisture adsorption isotherms
The moisture adsorption of the ginger slices subjected to different pre-treatment were determined gravimetrically (MOK; HETTIARACHCHY, 1990). A split plot in Randomized Complete Block Design (RCBD) comprising of four samples (PGS, PBS, UGS, and UBS), four temperatures (20, 30, 40, 36 and 50 °C), and seven water activities ranging from 0.371 to 0.939 were used. The water adsorption characteristics of ginger slices were determined by exposing the samples to atmospheres of known relative humidities from 37.1 to 93.7%.
Sulphuric acid solutions required to produce the desired humidities were pippeted into a 500 mL capacity airtight plastic containers. (WEAST; ASTLE, 1989). Triplicate samples, 0.5 g each, were weighed in crown corks which were placed on wire gauze above the solution. The plastic containers were covered with lids and allowed to equilibrate to selected temperatures 20, 30, 40 and 50 °C, respectively in the Gallenkamp Incubator (Model INF 600.010R). The samples were removed and weighed at 48 hours interval until three successive readings were each less than 0.5% of the previous 9 weights (SPIESS; WOLF, 1986).
2.3 Moisture sorption models
The moisture adsorption data of the samples was evaluated for goodness-of-fit using the Henderson, Guggenheim Ander-son De-Boer, Oswin, and Halsey models. HenderAnder-son (1952) developed a model (Equation 1) describing the temperature effect on moisture sorption.
1-aw = exp (-ATMe
B) (1)
where A and B = constants, T = temperature and Me = equi-librium moisture content. Rearranging Equation (1) we have (Equation 2):
Ln [-ln (1-aw)] = ln (AT) + B ln Me (2)
The GAB model according to Bizot (1983) and Van den Berg (MOK; HETTIARACHCHY, 1990) states that (Equation 3):
(1 )(1 )
w
o w w w
GKa M
M = −Ka −ka +GKa (3)
where G and K = constants, Mo = monolayer moisture content. The Oswin model (OSWIN, 1946) is written in the form (Equation 4):
1
B w
w
a
M A
a
= −
(4)
where A and B are constants.
The modified Halsey equation (HALSEY, 1948) is as follows (Equation 5):
exp
ln( )
C
o
w
AT B
M
a
+
= −
(5)
where A, B, and C are constants.
2.4 Thermodynamics
Isosteric heat of sorption
Chen and Lai (1990) described four methods of determin-ing isosteric heat of agricultural products. These include the direct calorimetric measurement technique and calculation from the EMC data using BET, Othmer, and Clausius-Clapeyron equation. The Clausius-Clapeyron equation is widely used in sorption studies because of its theoretical basis (IGLESIAS; CHIRIFE, 1976; EZEIKE, 1988; WANG; BRENNAN, 1991; CENKOWSKI; JAYAS; HAO, 1992). At a constant amount of sorbed water, the Clausius-Clapeyron equation is expressed by Wang and Brennan (1991) and Cenkowski et al. (1992) as Equation (6):
–D 1
ln = +
Hst
aw Cst
Ro T
(6)
where Cst is the constant of integration.
Equation (6) was used to calculate the isosteric heats of desorption. A least-squares regression analysis was performed to obtain the slope of the straight line representing ln(aw) versus
1/T.
exp
st o
ch
M
H H
M
Δ = Δ −
(7)
where ΔHo is the isosteric heat of sorption of the first molecule of water in the food (kJ/mol) and Mch is the characteristic
mois-ture content (g H2O.100 g–1 solid) of the food material; it is the
moisture content at which the net isosteric heat of desorption was reduced by 63% (KIRANOUDIS et al., 1993). Equation (7) was fitted to the data for ΔHst and moisture content (M) by
15-least square non-linear analysis to obtain the values of ΔHo
and Mch for FSG, MSG, and CSG 16-samples.
Entropy of sorption
The entropy of sorption was derived from the Gibbs free energy of sorption and related to temperature (ARIAHU; KAZE; ACHEM, 2006; RIZVI, 1995) as follows (Equation 8):
ΔGo = ΔH
st – TΔSº (8)
where ∆Gº is Gibbs free energy (kJ.mol-1) and ∆Sº is the isosteric
entropy of sorption (kJ/mol-K).
According to Rizvi (1995), Gibbs free energy is related to water activity as follows (Equation 9):
ΔGº = RT ln(aw) (9)
From Equations (8 and 9), it follows that (Equation 10):
ln( )
o st w
H S a
R RT
Δ −Δ
= + (10)
The ∆Sº values were determined from the intercept coef-ficient derived from least square regression of the plot of ln(aw) versus 1/T at constant moisture content.
2.5 Statistical analysis
The GAB model was evaluated using non-linear regression while the Henderson, Oswin, and Halsey models were evaluated by linearized forms of the equations using SPSS for windows ver-sion 6.0. The goodness-of-fit of the models were evaluated using the percent root mean square of error (%RMS) as prescribed by Wang and Brennan (1991) (Equation 11):
2
%
ob est
ob
M M
M RMS
n
−
=
∑
(11)where Mob = experimental values; Mest = predicted values; and
n = number of observations.
3 Results and discussion
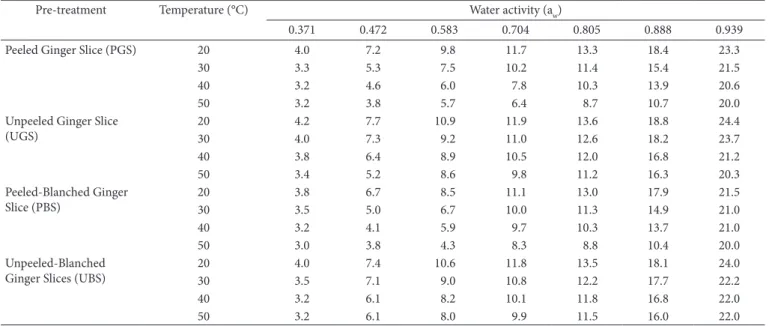
The effect of processing methods, temperature, and water activity on EMC is presented in Table 1 while the analysis of variance (ANOVA) is summarized in Table 2. Mean values of Equilibrium Moisture Content (EMCs) were plotted against water activities to obtain the moisture sorption isotherms. Moisture sorption isotherms of the samples at 20, 30, 40, and
50 °C are presented in Figure 1. The isotherms exhibited J shapes described as type III in the isotherm classification (IGLESIAS; CHIRIFE, 1982). Type III isotherm is typical of foods high in carbohydrates and salts (ARIAHU; KAZE; ACHEM, 2006). The analysis of variance (Table 2) shows highly significant processing methods, temperature, and aw effects.
Fishers Least Significant Difference (F-LSD)
• F-LSD (p = 0.05) of the difference between two processing
methods means = 0.6060;
• F-LSD (p = 0.05) of the difference between two tempera
-ture means = 0.3922; and
• F-LSD (p = 0.05) of the difference between two water
activity means = 0.8905.
3.1 Effect of temperature
Figure 1 shows that at constant water activity (aw) equilibrium moisture content (EMC) decreased as temperature increased. At aw of 0.472, EMC of PGS decreased from 7.20 gH20.100 g
–1 solid
at 20 °C to 3.80 gH20.100 g–1 solid at 50 °C. Similar trend was
observed for all other samples. This means that at any relative humidity ginger slices become less hygroscopic with an increase in temperature. Consequently, in an environment of constant relative humidity, it can absorb more moisture at lower than at higher temperatures. At constant moisture content, an increase in temperature caused lowering of isotherm curves which increased aw thereby making ginger slices more susceptible to microbial spoilage (ROCKLAND, 1969). Similar trends were reported for fish flour (LABUZA; KAANENE; CHEN, 1985), beans flour (MENKOV; DURAKOVA, 2005), and tropical fresh water crayfish (ARIAHU; KAZE; ACHEM, 2006).
A 2-tailed F-LSD test at the 5% level of significance shows that in the case of UGS and UBS, the EMCs were found to be statistically different at all temperature levels. In the case of PBS, statistical difference was observed at 20 and 30 °C, but at 40 and 50 °C one and three mean comparisons, respectively, out of 21 indicated non-significance. In the case of PGS, statistical differ-ence was observed at all temperature levels except for 50 °C at which two mean comparisons indicated non-significance.
3.2 Effect of water activity
Table 1 shows that the moisture content of the PGS in-creased as the water activity inin-creased at constant temperature. The amount of water sorbed at aw below 0.805 was generally low for relatively large increase in water activity. This trend was observed for all other samples. This implies that the critical equilibrium relative humidity (ERH) of the dried ginger slices fall between 70 and 80% in the temperature range studied ( 20-50 °C). Above this range, there will be an astronomical increase in the moisture adsorbed with relatively small incre-ment in water activity indicating the region of rapid spoilage (LABUZA; KAANENE; CHEN, 1985).
sig-nificance was observed in three out of six mean comparisons and at aw levels of 0.472, 0.704, and 0.939. At each of these cases, one non-significance mean comparison was observed. In the case of UGS and PGS, the EMCs were statistically different at all aw levels except at 0.371 and 0.583.
Whereas two out of six non-significance mean comparisons were observed for UGS at both aw levels. Three and one out of six
non-significance mean comparisons, respectively, were observed for PGS. In the case of UBS, a statistical difference was observed between all EMCs at aw level of 0.888, but three comparisons showed non-difference at aw levels of 0.371 and 0.939, two at aw level
of 0.472, and one each at aw levels of 0.583, 0.704, and 0.805.
3.3 Effect of pre-treatment
Figure 1 shows the typical effect of pretreatment on mois-ture adsorption of PGS, PBS, UGS, UBS samples. The graphs show that peeling and blanching have influence on moisture adsorption. The sorbed moisture of unpeeled ginger was higher than the peeled slices. The trend was the same in both blanched and unblanched samples. Naturally, it was expected that peeled ginger slices should be more hygroscopic due to the increased surface area of sorption and direct contact of
the slices (without peels) with moisture. However, this work revealed that unpeeled ginger slices absorbed more moisture. This could be attributed to the high porosity of unpeeled ginger due to the presence of peels and the presence of pentosan in the peels since pentosan is known to be highly hygrophilic. Figure 1 also reveals that the moisture adsorption capacity of ginger was reduced by blanching. The sorbed moisture of blanched was lower than the unblanched samples of both peeled and unpeeled ginger slices. This could be due to gelati-nization of starch molecules which may have blocked sorption sites thus reducing water adsorption. The sorbed moisture of the peeled blanched ginger slices was the lowest compared to all other samples. This indicates that peeled blanched ginger is more shelf stable.
A 2-tailed F-LSD test at the 5% level of significance at all seven levels of aw and four levels of temperature representing 28
mean comparisons shows that between PGS and UGS 32.14% of the mean comparisons were significant. Similarly, 75% non-significance was observed in the mean comparisons between PGS and PBS, 32.14% between PGS and UBS, 25% between UGS and PBS, 82.14% between UGS and UBS, and 21.43% between PBS and UBS. The EMCs of the peeled ginger slices were generally lower than those of the unpeeled at the tempera-tures and water activities studied. At 40 °C and water activity of 0.472, the EMC of PGS was 4.60 gH2O.100 g
–1 solid compared
to 6.40 16-gH2O.100 g
–1 solid for UGS. Similarly, the EMC of
PBS was 4.10 gH2O.100 g–1 solid compared to 6.10 gH 2O.100 g
–1
solid of UBS. Similar trends were observed at all temperatures and water activities studied.
3.4 Goodness-of-fit models
The parameters of four sorption models; GAB, Henderson, Oswin, and Halsey models were evaluated using the SPSS
com-Table 1. Effect of processing methods, temperature, and water activity on EMC of ginger slices.
Pre-treatment Temperature (°C) Water activity (aw)
0.371 0.472 0.583 0.704 0.805 0.888 0.939
Peeled Ginger Slice (PGS) 20 4.0 7.2 9.8 11.7 13.3 18.4 23.3
30 3.3 5.3 7.5 10.2 11.4 15.4 21.5
40 3.2 4.6 6.0 7.8 10.3 13.9 20.6
50 3.2 3.8 5.7 6.4 8.7 10.7 20.0
Unpeeled Ginger Slice (UGS)
20 4.2 7.7 10.9 11.9 13.6 18.8 24.4
30 4.0 7.3 9.2 11.0 12.6 18.2 23.7
40 3.8 6.4 8.9 10.5 12.0 16.8 21.2
50 3.4 5.2 8.6 9.8 11.2 16.3 20.3
Peeled-Blanched Ginger Slice (PBS)
20 3.8 6.7 8.5 11.1 13.0 17.9 21.5
30 3.5 5.0 6.7 10.0 11.3 14.9 21.0
40 3.2 4.1 5.9 9.7 10.3 13.7 21.0
50 3.0 3.8 4.3 8.3 8.8 10.4 20.0
Unpeeled-Blanched Ginger Slices (UBS)
20 4.0 7.4 10.6 11.8 13.5 18.1 24.0
30 3.5 7.1 9.0 10.8 12.2 17.7 22.2
40 3.2 6.1 8.2 10.1 11.8 16.8 22.0
50 3.2 6.1 8.0 9.9 11.5 16.0 22.0
*EMC values are means of three replications.
Table 2. Summary of ANOVA on effect of processing methods on EMC
of ginger slices at various levels of water activity and temperature. Source of
variation
Degrees of freedom
EMC of ginger slices
5% 1%
Water activity Pre-treatment Error (a)
6 3 18
532.85** 21.05**
2.66 3.16
4.01 5.09
Temperature Interaction Error (b)
3 9 72
81.59** 2.68NS
2.744 2.024
4.094 2.688
puter package and are presented in Table 3. The high regression coefficients ranging from 0.939 to 0.990 indicate that the models are adequate for predicting experimental data for moisture adsorption of the ginger slices.
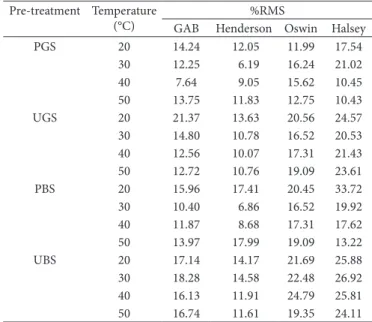
The percentage root mean square of error (%RMS) was used to evaluate the goodness-of-fit of each model (Table 4). This parameter was used in the literature to evaluate the
goodness-of-fit of different sorption models as applied to experimental data (ARIAHU; KAZE; ACHEM, 2006; MOK; HETTIARACHCHY, 1990; AGUERRE; SUAREZ; VIOLLAZ, 1989). The different models yielded different %RMS. The Henderson equation predicted the isotherms with the lowest %RMS. Therefore, this model describes better the adsorption data (WANG; BRENNAN, 1991). Other researchers such as
Figure 1. Moisture sorption isotherm for ginger slices a) 20 °C; b) 30 °C; c) 40 °C; and d) 50 °C.
0 0.2 0.4 0.6 0.1 1
Water actvity (aw) 35
30
25
20
15
10
5
0
Peeled Ginger Slice (PGS) Peeled-Blanched Ginger Slice (PBS) Unpeeled Ginger Slice (UGS) Unpeeled-Blanched Ginger Slices (UBS)
EM
C gH
2
O
.100 g
–1 s
o
lid
0 0.2 0.4 0.6 0.1 1
Water actvity (aw) 35
30
25
20
15
10
5
0
EM
C gH
2
O
.100 g
–1 s
o
lid
0 0.2 0.4 0.6 0.1 1
Water actvity (aw) 35
30
25
20
15
10
5
0
EM
C gH
2
O
.100 g
–1 s
o
lid
0 0.2 0.4 0.6 0.1 1
Water actvity (aw) 35
30
25
20
15
10
5
0
EM
C gH
2
O
.100 g
–1 s
o
lid
a
b
c
Ariahu et al. (2006), Singh and Ojha (1974) tested the validity of Henderson equation for tropical fresh water crayfish, milled nuts, and dried pepper, respectively, and good correlations were found. GAB, Oswin, and Halsey models followed the Henderson model in that order.
3.5 Monolayer moisture content
The GAB model was used to estimate the monolayer moisture content (Table 3). The monolayer moisture content represents the moisture of a material when its entire surface is covered with an unimolecular moisture layer. It is the mois-ture content for the maximum shelf stability. The monolayer moisture generally decreased with temperature for all samples. For the temperatures of 20 and 50 °C, the monolayer of PGS decreased from 5.209 gH2O.100 g–1 solid to 1.885 gH
2O.100 g –1
solid. That of PBS decreased from 6.301 gH2O.100 g–1 solid to
2.011 gH2O.100 g
–1 solid and UBS from 5.066 gH 2O.100 g
–1 solid
to 3.691 gH2O.100 g
–1 solid. The monolayer moisture content of
UGS did not show a significant decrease with temperature. The decrease in monolayer moisture with temperature observed in this work was in agreement with Ariahu et al. (2006) for fresh water crayfish, Alakali (2004) for mango slices, and Iglesias and Chirife (IGLESIAS; CHIRIFE, 1976) for some food products. According to those authors, this may be due to the reduction in the number of active sites for water binding because of the physical and chemical changes in the product induced by temperature. Also according to Palipane and Driscoll (1992), another possibility could be because with an increase in the temperature the water molecules get activated, due to increase in their energy level, causing them to become less stable and to break away from the water binding sites of the food material thus decreasing the monolayer moisture content. These obser-vations imply that the optimum moisture for shelf stability of ginger slices will be determined in relation to the anticipated temperature of storage.
3.6 Sorption thermodynamics
The net heat of adsorption indicates the building energy or the intermolecular forces between the molecules of water and the surface of the sorbent. The net isosteric heat estimates the minimum amount of heat required to remove or add a given amount of water (RIZVI, 1995; AGUERRE; SUAREZ; VIOLLAZ, 1989).
From the Clausius-Clapeyron Equation 6, an increase in tem-perature will decrease the sorbed moisture ( DIOSADY et al., 1996). The relationship between ln(aw) and inverse absolute temperature
(1/T) at constant moisture content is presented in Figure 2. The isosteres were straight lines in agreement with Ariahu et al. (2006)
Table 4. Percent root mean square of error (%RMS) of sorption
iso-therm models for ginger slices. Pre-treatment Temperature
(°C)
%RMS
GAB Henderson Oswin Halsey
PGS 20 14.24 12.05 11.99 17.54
30 12.25 6.19 16.24 21.02
40 7.64 9.05 15.62 10.45
50 13.75 11.83 12.75 10.43
UGS 20 21.37 13.63 20.56 24.57
30 14.80 10.78 16.52 20.53
40 12.56 10.07 17.31 21.43
50 12.72 10.76 19.09 23.61
PBS 20 15.96 17.41 20.45 33.72
30 10.40 6.86 16.52 19.92
40 11.87 8.68 17.31 17.62
50 13.97 17.99 19.09 13.22
UBS 20 17.14 14.17 21.69 25.88
30 18.28 14.58 22.48 26.92
40 16.13 11.91 24.79 25.81
50 16.74 11.61 19.35 24.11
Table 3. Isotherm model parameters and derivatives for ginger slices*.
Pre-treatment Temperature (°C) GAB model parameters Henderson model parameters
Oswin model parameters
Halsey model parameters
G K Mo R2 A B R2 A B R2 A B R2
PGS 20 5.276 0.834 5.207 0.977 14.90 1.19 0.98 7.53 0.42 0.97 51.48 2.12 0.96
30 6.022 0.879 3.779 0.979 8.59 1.05 0.98 5.92 0.47 0.98 20.69 1.88 0.98 40 26.950 0.928 2.608 0.993 5.52 0.92 0.98 4.78 0.53 0.99 10.26 1.68 0.99 50 22.940 0.962 1.885 0.957 3.81 0.81 0.92 3.69 0.60 0.96 5.22 1.51 0.96
UGS 20 3.042 0.874 4.318 0.960 16.60 1.21 0.97 7.91 0.41 0.97 59.69 2.13 0.96
30 11.830 0.876 4.226 0.978 12.28 1.13 0.98 7.13 0.44 0.98 37.25 2.00 0.98 40 6.003 0.842 4.557 0.979 13.03 1.19 0.98 6.81 0.42 0.98 40.70 2.10 0.97 50 4.364 0.844 4.404 0.976 10.48 1.13 0.98 6.24 0.44 0.97 29.02 2.02 0.96
PBS 20 2.400 0.789 6.301 0.984 12.71 1.16 0.99 6.98 0.43 0.96 41.53 2.08 0.95
30 5.103 0.880 3.691 0.982 7.78 1.02 0.99 5.64 0.48 0.98 17.77 1.86 0.98 40 7.706 0.914 2.938 0.969 5.85 0.93 0.97 4.94 0.52 0.98 11.04 1.70 0.97 50 7.861 0.950 2.011 0.939 4.29 0.87 0.92 3.94 0.57 0.95 6.35 1.58 0.95
UBS 20 6.795 0.841 5.066 0.963 15.84 1.21 0.97 7.70 0.42 0.97 55.02 2.18 0.96
30 7.287 0.856 4.416 0.971 12.64 1.16 0.97 6.92 0.41 0.97 38.41 2.86 0.96 40 5.904 0.875 4.033 0.982 9.32 1.06 0.98 6.28 0.47 0.98 24.10 1.70 0.97 50 8.685 0.886 3.691 0.978 9.06 1.06 0.98 6.11 0.47 0.94 22.47 1.58 0.98
Figure 2. Plot of ln(aw) versus 1/T for a) peeled ginger slides; b) peeled-blanched ginger slides; c) unpeeled ginger slides; and d) unpeeled-blanched ginger slides.
and Moschair and Fardin (1986). The regression parameters by least square linear analysis are presented in Table 5 with high R2
values. The high R2 values indicate the validity of the
Clausius-Clapeyron equation in describing the adsorption data of ginger slices. The net isosteric heats were derived from the slope of the plots of ln(aw) versus 1/T.
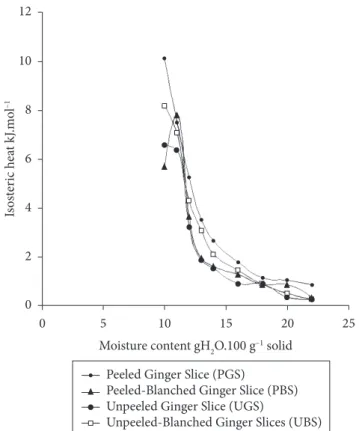
The variation of the net isosteric heat with the moisture content of the ginger slices is presented in Figure 3. Figure 3 shows that the isosteric heat decreased with moisture content approaching the asymptotic value or the latent heat of vapor-ization of pure water (ΔHst = 0). This trend was observed by
Ariahu et al. (2006) and Labuza et al. (1985). Therefore, the heat evolved during adsorption of the first few layers of the water molecules was substantially higher than the heat of condensation of pure water. This is probably due to strong bonds between the
water molecules and the hydrophilic group of food solid. The decrease in the isosteric heat with sorbed water can be quanti-tatively explained by considering that initially sorption occurs at the most active available sites giving rise to high interaction energy. As these sites become more occupied, sorption occurs at the less available sites, giving rise to lower heat of sorption (ARIAHU; KAZE; ACHEM, 2006; IGLESIAS; CHIRIFE, 1982). According to McLaren and Rowen (1951), the chemisorption polar group could be responsible for the higher sorption heat at very low moisture content. Kapsalis (1981) observed that since thermodynamic quantities are derived from the application of Clausius-Clapeyron equation, anything that affects the sorption isotherms such as the sample prehistory (various pretreatments, blanching, freezing, and drying) would affect them. Conse-quently, the isosteric heat of PGS was higher, followed by PBS, UGS, and UBS in that order (Figure 3).
0.0003096 0.0031949 0.0033003 0.003413 1/T
–0.6 –0.3 0
In (a
w)
10% mc 13% mc 16% mc 20% mc 11% mc 14% mc 18% mc 22% mc 22% mc a
0.0003096 0.0031949 0.0033003 0.003413 1/T
–0.6 –0.3 0
In (a
w)
b
0.0003096 0.0031949 0.0033003 0.003413 1/T
–0.6 –0.3 0
In (a
w)
c
0.0003096 0.0031949 0.0033003 0.003413 1/T
–0.6 –0.3 0
In (a
w)
mi et al. (1990) Equation (7), is presented in Table 6. This Table shows that the isosteric heat of the first molecule (Ho) of the unpeeled samples were generally higher than the peeled ones. This result indicates that drying peeled ginger is relatively easier drying unpeeled ginger. This finding is in agreement with the report of Alakali and Satimehin (2004) for the drying of ginger slices. On the contrary, the characteristic moisture content (Mch)
of the peeled samples was generally higher than the unpeeled ones. This further reveals that less energy would be needed to dry the peeled than the unpeeled ginger slices.
The entropy of sorption was determined from the inter-cept of the linearized form of Equation 10, and it is shown in Figure 4. It increased with moisture content. In the moisture content range of 10 to 22 g H2O.100 g–1 solid, the entropy
of sorption increased from –0.03 to –0.0023 gH2O.100 g –1
solid for PGS, –0.018 to –0.001 gH2O.100 g
–1 solid for UGS,
–0.023 to –0.0002 gH2O.100 g
–1 solid for PBS, and –0.018 to
–0.0002 gH2O.100 g–1 solid for UBS. This trend was reported by
Bethelhiem et al. (1970), Loong et al. (1995), and Ariahu et al. (2006) for swelling biopolymers, freeze dried blueberries, and tropical fresh water crayfish respectively. According to the authors, as moisture content increases, the material swells up opening up new higher energy sites for water to bind. The water molecules also become more mobile with higher degree of free-dom leading to higher entropy of sorption. At lower moisture contents, however, the water molecules become more tightly bound by physical and chemosorption forces leading to loss of degree of freedom and decreased entropy.
Peeled Ginger Slice (PGS)
Peeled-Blanched Ginger Slice (PBS) Unpeeled Ginger Slice (UGS)
Unpeeled-Blanched Ginger Slices (UBS) Moisture content gH2O.100 g–1 solid
0 0
5 10 15 20 25
2 4 6 8 10 12
Is
os
ter
ic h
ea
t kJ
.m
o
l
–1
Figure 3. Isosteric heat versus moisture content for ginger slices.
Table 5. Regression parameters of the relationship between ln (aw) versus 1/T.
Pre-treatment Regression parameters
Moisture content (g H2O.100 g–1 solid)
10 11 12 13 14 16 18 20 22
PGS n 4 4 4 4 4 4 4 4 4
R2 0.995 0.928 0.957 0.964 0.945 0.961 0.973 0.814 0.863
A 3.656 2.694 1.858 1.230 0.900 0.584 0.350 0.328 0.271
B –1216.6 –901.9 –631.7 –425.01 –319.27 –213.8 –136.8 –124.8 –102.4
ΔHst 10.113 7.498 5.252 3.533 2.654 1.778 1.137 1.038 0.851
UGS n 4 4 4 4 4 4 4 4 4
R2 0.937 0.948 0.896 0.999 0.985 0.979 0.999 0.999 0.799
A 2.196 2.695 1.167 0.549 0.451 0.356 0.233 0.247 0.055
B –807.2 –935.8 –437.0 –233.7 –193.3 –152.2 –105.7 –103.4 –40.9
ΔHst 6.711 7.780 3.633 1.939 1.607 1.265 0.876 0.860 0.340
PBS n 4 4 4 4 4 4 4 4 4
R2 0.973 0.939 0.967 0.964 0.930 0.779 0.999 0.670 0.626
A 2.910 2.500 1.498 1.046 0.687 0.453 0.240 0.113 0.027
B –984.6 –844.2 –516.0 –369.4 –253.5 –173.6 –104.5 –61.70 –31.34
ΔHst 8.186 7.019 4.290 3.071 2.108 1.443 0.869 0.513 0.261
UBS n 4 4 4 4 4 4 4 4 4
R2 0.919 0.929 0.789 0.882 0.924 0.999 0.999 0.799 0.626
A 2.140 2.139 1.016 1.527 0.419 0.218 0.233 0.046 0.027
B –790.6 –764.5 –386.5 –224.1 –182.7 –108.1 –105.7 –41.33 –31.34
ΔHst 6.573 6.356 3.213 1.863 1.519 0.904 0.878 0.344 0.261
n = number of observations; R2 = regression coefficients; A = intercept; B = gradient; ΔH
st = isosteric heat of sorption. Latent heat of vaporization/condensation of pure
water = 4.2 KJ.
Tsa-References
Agricultural Extension, Research Liaison and Training – AERLS.
Ginger production. Umudike, Nigeria: National Root Crop
Research Institute - NRCRI, 1987. p. 1-5. (Bulletin).
AGUERRE, R. J.; SUAREZ, C.; VIOLLAZ, P. E. New BET type multilayer sorption isotherms. Part II. Modelling water sorption in foods. Aguerre R. J.; Suarez C.; Viollaz P. E. New BET type multilayer sorption isotherms. Part II: Modelling water sorption in foods. Lebensmittel-Wissenschaft und Technologie, v. 22, p. 192-195, 1989.
ALAKALI, J. S.; SATIMEHIN A. A. Drying kinetics of ginger. Nigerian
Food Journal, v. 22, p. 105-111, 2004.
ARIAHU, C. C.; KAZE, S. A.; ACHEM, C. D. Moisture sorption characteristics of tropical fresh water crayfish (Procambarus clarkia).
Journal of Food Engineering, v. 75, p. 355-363, 2006.
BETHELHIEM, F. A.; BLOCK, A.; KAUFMANN, I. J. Heat of water vapour sorption in biopolymers. Biopolymers, v. 9, n. 3, p. 1531 -1538, 1970.
BIZOT, H. Using the GAB model to construct sorption isotherms. In: JOWITT et al (Eds.) Physical properties of foods. New York: [s.n], 1983. p. 43-54.
CENKOWSKI, S.; JAYAS, D. S.; HAO, D. Latent heat of vaporization for selected foods and crops. Canadian Agricultural Engineering, v. 34, n. 3, p. 281-284, 1992.
CHEN, C.; LAI, C. The study on the application equation for the vaporization heat of water in agricultural products. Journal of
Agricultural Research, v. 39, n. 1, p. 377-389, 1990.
DIOSADY, L. C. et al. Moisture sorption isotherms of canola meals and application to packaging. Journal of Food Science, v. 61, n. 2, p. 204-208, 1996.
EZEIKE, G. O. I. Hygroscopic characteristics of unshelled egusi (melon) seeds. International Journal of Food Science and
Technology, v. 23, n. 3, p. 511-519, 1988.
GALLAGHER, G. L. A method of determining latent heat of agricultural crops. Agricultural Engineering, v. 32, n. 3, p. 34-38, 1951. HALSEY, G. Physical adsorption on non uniform surface. Journal of
Chemical Physics, v. 16, p. 931-937, 1948.
HENDERSON, S. M. Basic concepts of equilibrium moisture.
Agricultural Engineering, v. 33, n. 3, p. 29-33, 1952.
IGLESIAS, H. A.; CHIRIFE, J. S. C. On the local isotherm concept and models of moisture binding in food products. Journal of
Agriculture and Food Chemistry, v. 24, n. 6, p. 77, 1976.
IGLESIAS, H. A.; CHIRIFE, J. S. C. On the local isotherm concept and models of moisture binding in food products. Journal of
Agriculture and Food Chemistry, v. 24, n. 6, p. 77-82, 1982.
KAPSALIS, J. G. Moisture sorption hystereses. In: ROCKLAND, L. B.; STEWART, G. F. (Eds.). Water influence on food quality. NewYork: Academic Press, 1981. p. 143-177.
KIRANOUDIS, C. T. et al. Equilibrium moisture content and heat of desorption of some vegetable. Journal of Food Engineering, v. 20, n. 6, p. 55-74, 1993.
KOCHHAR, A. Tropical crops. A textbook of economic botany. London: McMillan Press, 1981. p. 268-270.
LABUZA, T. P.; KAANENE, A.; CHEN, J. Y. Effect of temperature on the moisture sorption and water activity shift of two dehydrated foods. Journal of Food Science, v. 50, n. 11, p. 382-391, 1985.
4 Conclusions
The following conclusions can be drawn from the study:
a) The equilibrium moisture content of the dried ginger slices increased directly proportionally to water activity and inversely proportionally to temperature;
b) Henderson model made more accurate predictions about the sorption data;
c) Unpeeled ginger slices were less hygroscopic than the peeled ones;
d) Blanched ginger slices had the lowest EMC and therefore are more shelf stable; and
e) The isosteric heat of sorption decreased while the entropy of sorption increased with an increase in moisture con-tent.
Table 6. Parameters of the Tsami equation for ginger slices.
Parameters PGS UGS PBS UBS
N 9 9 9 9
R2 0.940 0.882 0.896 0.9544
Intercept 4.1366 4.2455 4.1256 4.4583
ΔHo 62.589 69.791 61.905 86.360
Gradient –0.2090 –0.2395 –0.2232 –0.2707
Mch 4.785 4.175 4.480 3.694
n = number of observations; R2 = regression coefficients; ΔH
o = isosteric heat of the first
molecule of water; and Mch = characteristic moisture content.
0.01
0.0
–0.01
–0.02
–0.03
–0.04 0
En
tr
o
p
y o
f s
o
rp
tio
n kJ
.m
o
l
–1 (°C)
5 10 15 20 25
Moisture content gH2O.100 g–1 solid
Peeled Ginger Slice (PGS)
Peeled-Blanched Ginger Slice (PBS) Unpeeled Ginger Slice (UGS)
Unpeeled-Blanched Ginger Slices (UBS)
ROCKLAND, L. B. Water activity and storage. Food Technology, v. 23, p. 1241-1251, 1969.
SATIMEHIN, A. A.; EZEIKE, G. O. I. Moisture desorption characteristics of gelatinized white yam (Dioscorea rotundata, Poir).
Nigerian Food Journal, v. 20, p. 58-64, 2002.
SINGH, R. S.; OJHA, T. P. Equilibrium moisture content on groundnut and chilies. Journal of Science of Food and Agriculture, v. 25, n. 5, p. 455-459, 1974.
SPIESS, W. C. T.; WOLF, W. Critical evaluation of methods to determine moisture sorption isotherms. In: ROCKLAND, L. B. (Ed.). Water
activity. N.Y.: [s.n], 1986. p. 123.
TSAMI, E. et al. Heat of sorption of water in dried fruits. International
Journal of Food Science and Technology, v. 25, n. 6, p. 350-359,
1990.
Van DEN BERG, C. Development of BET like model for sorption of water on foods, theory and relevance. In: SIMATOS, D.; MULTON, J. L. (Ed.). Properties of water in foods. Dordrechts, The Netherlands: Martinus Nijhoff Publishers, 1985. p. 119-131.
WANG, N.; BRENNAN, J. G. Moisture sorption characteristics of potatoes at four temperatures. Journal of Food Engineering, v. 14, n. 7, p. 269-287, 1991.
WEAST, R. C.; ASTLE, M. I. CRC Handbook of Chemistry and
Physics. Boca Raton, Florida: CRC Press Inc., 1989. p. 44.
LOONG, T. L.; JUMING, T.; JIANSHAN, H. Moisture sorption characteristics of freeze dried blueberries. Journal of Food Science, v. 6, n. 4, p. 810-819, 1995.
MCLAREN, A. D.; ROWEN, J. W. Sorption of water by proteins and polymers, a review. Journal of Polymer Science, v. 57, p. 289-324, 1951.
MENKOV, M. D.; DURAKOVA, A. G.; KRASTEVA, A. Moisture sorption isotherms of common bean powders at several temperatures. Electronic Journal of Environmental, Agricultural
and Food Chemistry, v. 4, n. 2, p. 892-898, 2005.
MOK, C.; HETTIARACHCHY, N. S. Moisture sorption characteristics of ground sunflower nutmeal and its products. Journal of Food
Science, v. 55, n. 2, p.786-789, 1990.
MOSCHAIR, S. M.; FARDIN, J. W. Sorption properties of raw huke muscles. Journal of Food Technology, v. 21, n. 4, p. 95-102, 1986. OSWIN, C. R. The kinetics of packaged life III. The isotherm. Journal
of Chemical Industry, v. 65, p. 419-423, 1946.
PALIPANE, K. B.; DRISCOLL, R. H. Moisture sorption characteristics of moshell macadamia nuts. Journal of Food Engineering, v. 18, p. 63-76, 1992.