DOI: 10.1002/xrs.3019
S P E C I A L I S S U E A R T I C L E
Diagram, valence-to-core, and hypersatellite K
𝛽 X-ray
transitions in metallic chromium
Faisal Zeeshan
1Joanna Hoszowska
1Jean-Claude Dousse
1Dimosthenis Sokaras
2Tsu-Chien Weng
2Roberto Alonso-Mori
3Matjaz Kavˇciˇc
4Mauro Guerra
5Jorge Miguel Sampaio
6Fernando Parente
5,8Paul Indelicato
8José Pires Marques
7José Paulo Santos
51Department of Physics, University of Fribourg, Fribourg, Switzerland 2Stanford Synchrotron Radiation Lightsource, SLAC National Accelerator Laboratory, Menlo Park, USA
3Linac Coherent National Accelerator Laboratory, SLAC National Accelerator Laboratory, Menlo Park, USA
4Jožef Stefan Institute, Department of Low and Medium Energy Physics, Ljubljana, Slovenia
5Laboratório de Instrumentação, Engenharia Biomédica e Física da Radiação (LIBPhys-UNL), Departamento de Física, Faculdade de Ciências e Tecnologia, FCT, Universidade Nova de Lisboa, Caparica, Portugal
6Space Radiation Environments, LIP-Laboratório de Instrumentação e Física Experimental de Partículas, Lisboa, Portugal
7BioISI-Biosystems and Integrative Sciences Institute, Faculdade de Ciências da Universidade de Lisboa, Lisboa, Portugal
8Laboratoire Kastler Brossel, Ecole Normale Supérieure, CNRS, Sorbonne Universités, UPMC Univ. Paris 06, Paris, France
Correspondence
Joanna Hoszowska, Department of Physics, University of Fribourg, Chemin du Musée 3, Fribourg CH-1700, Switzerland.
Email: joanna.hoszowska@unifr.ch
We report on measurements of the K𝛽 diagram, valence-to-core (VtC), and hypersatellite X-ray spectra induced in metallic Cr by photon single and double K-shell ionization. The experiment was carried out at the Stanford Synchrotron Radiation Lightsource using the seven-crystal Johann-type hard X-ray spectrom-eter of the beamline 6-2. For the K𝛽 diagram and VtC transitions, the present study confirms the line shape features observed in previous works, whereas the Kh𝛽 hypersatellite transition was found to exhibit a complex spectral line shape and a characteristic low-energy shoulder. The energy shift of the hypersatellite relative to the parent diagram line was deduced from the measurements and compared with the result of extensive multiconfiguration Dirac–Fock (MCDF) calculations. A very good agreement between experiment and theory was found. The MCDF calculations were also used to compute the theoretical line shape of the hypersatellite. A satisfactory agreement was obtained between the overall shapes of the experimental and theoretical spectra, but deviations were observed on the low- and high-energy flanks of the hypersatellite line. The discrepancies were explained by chemical effects, which were not considered in the MCDF calculations performed for isolated atoms.
. . . . This is an open access article under the terms of the Creative Commons Attribution-NonCommercial-NoDerivs License, which permits use and distribution in any medium, provided the original work is properly cited, the use is non-commercial and no modifications or adaptations are made.
© 2019 The Authors X-Ray Spectrometry Published by John Wiley & Sons Ltd.
Funding information
Swiss National Science Foundation, Grant/Award Number: 2000020-146739 ; Faculdade de Ciências e Tecnologia, Universidade Nova de Lisboa, Grant/Award Number:
PTDC/FIS-AQM/31969/2017 and SFRH/BPD/92455/2013 ;
FCT/MCTES/PIDDAC , Grant/Award Number: UID/FIS/04559/2013 and UID/MULTI/04046/2013
1
I N T RO D U CT I O N
X-ray emission spectroscopy of inner-core and valence-to-core (VtC) transitions in resonant and non-resonant excitation conditions is a powerful technique to probe the atomic structure of matter.[1–5] For 3d tran-sition metals, K𝛽 X-ray emission spectroscopy spectra provide information on the electronic structure of the samples as well as on their oxidation state and spin state. The solid and chemical effects on the K𝛽1,3diagram and the K𝛽2,5VtC transitions are well known, and numerous measurements of the K𝛽 X-ray emission spectra of 3d tran-sition metals and their chemical compounds have been performed using photons from X-ray tubes[6,7] and syn-chrotron radiation,[1,3,5,8] electrons,[9] and protons[10–12] for the targets excitation. In these experiments, the energy shifts, intensity ratios, relative positions, and widths of the
K𝛽 transitions were investigated.
In contrast, high-energy resolution data for photoin-duced Kh𝛽1,3 hypersatellite transitions are scarse (see Figure 4 in Section 5) because of the low-double-K-shell photoionization cross sections,[13–15] and transition yields (e.g., for Cr the intensity ratio of the Kh𝛽 hypersatellite to the strongest diagram transition, K𝛼 is only about 5×10⁻⁵). Actually, only two high-resolution measurements of the
Kh𝛽1,3hypersatellite transitions induced by photon impact have been published so far, those of Diamant et al.[16]for elemental Fe and of Huotari et al.[17]for Ti metal.
High-energy resolution and high-collection efficiency are prerequisites in order to measure X-ray line energy shifts of few eV or less, as well as to evince small variations in X-ray line intensities and spectral shapes. Efficient collection of X-rays with high energy resolution can be achieved by using curved-crystal X-ray spec-trometers. Various hard X-ray spectrometers based on Bragg reflections from single or multiple perfect crystals have been developed.[18–23]Nowadays, several synchrotron facilities offer hard X-ray beam lines, which are equipped with high resolution multicrystal spectrometers.[24–27]
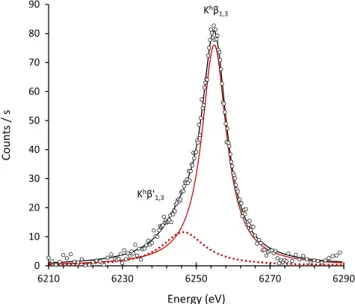
FIGURE 1 (color online) (a) Fit of the K𝛽1,3spectrum of Cr measured at Stanford Synchrotron Radiation Lightsource (SSRL). Shown are the background subtracted experimental spectrum (open circles), the total fit (black curve) together with the four individual Voigt components of the fit: The red solid and red dotted lines for the main K𝛽1,3transition, the green dotted line for the K𝛽xtransition,
and the blue line for the K𝛽′transition. (b) Same as (a) but for the
K𝛽1,3spectrum measured in Fribourg. In the latter measurement, the energy range was extended to include the K𝛽2,5transition
The Kh𝛽 hypersatellite transitions result from the radia-tive decay of double K-shell vacancy states through the
M-shell. The Kh𝛽 1 ( 1s−2→ 1s−13p−1 3∕2 ) and Kh𝛽 3 (1s−2 → 1s−13p−1
transitions. The Kh𝛽
3hypersatellite is allowed in both the LS and jj coupling schemes, while the Kh𝛽
1hypersatellite corresponds to the spin-flip1S
0 →3 P1transition, which is forbidden by the E1 selection rules in the LS coupling scheme. For low Z elements for which the LS coupling scheme prevails, the Kh𝛽
1transition is thus not observable, and the I(Kh𝛽1)/I(Kh𝛽3) yield ratio reflects the degree of intermediacy of the coupling.[28,29]
The objective of this work was to investigate the
Kh𝛽
1,3 hypersatellite spectrum of elemental Cr induced by single-photon double K-shell ionization. A particular aim was to compare the experimentally determined energy shift of the hypersatellite with respect to its parent diagram line and the hypersatellite line shape to theoretical pre-dictions based on multiconfiguration Dirac–Fock (MCDF) calculations. Furthermore, in view of a future project aim-ing to compare the chemical sensitivity of the Kh𝛽 hyper-satellite transitions of 3d transition elements with the one of the VtC transitions, the K𝛽2,5X-ray line of metallic Cr was also measured.
2
E X P E R I M E N T
The experiment was performed at the Beamline 6–2 of the Stanford Synchrotron Radiation Lightsource (SSRL). The Beamline 6–2 is equipped with two liquid nitro-gen cooled Si(111) and Si(311) crystal monochromators, and the incident X-ray beam is provided by a 0.9 T 56-pole wiggler. The high flux and monochromaticity of the photon beam and the wide solid angle of detection allow studying weak atomic processes even for relatively low-density samples. Rh-coated mirrors were positioned before and after the monochromators for focusing and collimation of the beam. A beam size of about 170-𝜇m ver-tical and 400-𝜇m horizontal was delivered at the sample position. The incident beam flux was typically 1-2×10¹³ photons/s. For the measurements of the Cr K𝛽 spectra (K𝛽1,3 and K𝛽2,5 transitions), the photon beam energy was set to 6.1 keV, whereas for the Kh𝛽
1,3 hypersatellite a beam energy of 13.7 keV close to the maximum of the double K-shell photoionization cross section for Cr was chosen.
For the measurements of the X-ray emission spectra, the seven-crystal Johann-type hard X-ray spectrometer[23] installed at the Beamline 6–2 was employed. The Johann geometry is semifocusing in which the crystal planes are bent to a radius 2R, where R is the radius of the Rowland circle but the crystal inner surface is not grounded. In order to reduce the geometrical effects,[30] the Rowland circle is placed on a vertical plane as the vertical beam size is smaller. The analyzer crystals are spherically bent to a radius of 1 m with a projected diameter of 100 mm. All crystal modules are placed on a common plate that
can be moved vertically with the help of stepping motors. Each crystal module can move along its normal direction so that the crystals can follow the exact Rowland circle as the spectrometer is scanned. The spectrometer sustends a backscattering Bragg angular range of 88◦to 74◦.
In the present experiment, five Ge(440) analyzer crys-tals for the Cr K𝛽 spectra and seven Si(333) crystals for the Kh𝛽
1,3transitions were employed. The Bragg angle for the Cr K𝛽1,3was 85.9◦and for the Kh𝛽
1,3lines 82.3◦. The diffracted X-rays from all crystals were recorded simulta-neously with a silicon drift detector detector placed on the vertical axis. The full width at half maximum (FWHM) energy resolution of the silicon drift detector was about 150 eV at 5.9 keV. As the spectrometer was operated at atmospheric pressure, a helium filled bag was placed between the crystal analyzers and the detector to mini-mize the attenuation and the diffuse scattering of X-rays. For each energy point, the incident photon beam inten-sity was monitored with ionization chambers. The photon beam energy was calibrated using the K-edge energies of Cr and Mn as references. The energy resolution and the energy calibration of the spectrometer were determined from the elastically scattered peaks in the photon energy domain of interest. For the Cr K𝛽 transitions, the experi-mental resolution (FWHM) was 0.47 eV and for the Kh𝛽1,3 lines 0.49 eV. For the K𝛽1,3diagram and K𝛽2,5VtC transi-tions, the data were collected in two successive scans with an acquisition time of 1 s per point, whereas for the Kh𝛽
1,3 hypersatellite transition six scans with a collection time of 5 s per point were performed.
3
DATA A NA LY S I S
The spectra were fitted by means of a least squares fit-ting program using the software package PeakFit®. Voigt functions were employed because they correspond to the convolution of the Gaussian and Lorentzian functions,[31] which represent the instrumental response of the spec-trometer and the natural line shape of the transitions, respectively. Prior to fitting, each spectrum was normal-ized with the photon beam intensity and the total acquisi-tion time.
3.1
K
𝛽 diagram and VtC transitions
The electronic configuration of Cr in the ground state is [Ar] 3d54s1, with five unpaired electrons in the 3d subshell. The K𝛽1,3line is generated in the 3p → 1s transition and is the strongest among the K𝛽 X-ray lines. The unpaired electron in the 3p−1 state is strongly coupled with the unpaired electrons in the partially filled 3d subshell. Due to the 3p3d exchange interaction, two transitions are possible depending on the spin orientation of the unpaired electron in the 3p−1 state with respect to that of the 3d electrons.
According to the dipole selection rules, if the spins are parallel the K𝛽1,3, transition line will occur, and if the spins are antiparallel, then the K𝛽′ satellite line of lower energy will originate. A shoulder on the low-energy side of the main K𝛽1,3line arises when a 3d electron flips its spin and is denoted as K𝛽x.[32]The K𝛽5transition is dipole forbidden in free atoms. In solids, the K𝛽2,5line reflects the valence band and corresponds to transitions from the 3d or 4p state to the 1s state.[33]
FIGURE 2 (color online) Fit of the K𝛽2,5spectrum measured at Stanford Synchrotron Radiation Lightsource (SSRL). Shown are the measured spectrum (open circles) and the total fit (black curve). The red solid and dotted lines represent the individual Voigt components
FIGURE 3 (color online) Fit of the Kh𝛽
1,3hypersatellite spectrum showing the measured spectrum (open circles) and the total fit (black curve). The fitted Kh𝛽
1,3component is depicted by the red solid line and the Kh𝛽′
1,3asymmetry by the red dotted line
In Figure 1a, we present the K𝛽1,3X-ray emission spec-trum of metallic Cr measured at SSRL. The specspec-trum was fitted with four Voigtians. Two Voigt functions were used for the K𝛽1,3main component and one for the K𝛽xand K𝛽′ components, keeping the instrumental response function width fixed and all other parameters free. Since the lim-ited angular range of the X-ray spectrometer does not allow for Bragg angles higher than 88◦, the K𝛽′ transition could not be measured with the Ge(440) crystal. For a reliable fit of the main K𝛽1,3line, the K𝛽′ transition should be, how-ever, included. The fitting parameters for the K𝛽′transition were therefore determined from the Cr K𝛽1,3 spectrum collected in-house with the von Hamos spectrometer of Fribourg,[34]using an X-ray tube for the production of the target fluorescence. The fit of this spectrum is shown in Figure 1b. To obtain the values for the energy, width, and intensity of the K𝛽′ line, the spectrum was analyzed using the fitting parameters reported by G. Hölzer et al.[6]
In Figure 2 shown is the fitted Cr VtC X-ray emission spectrum. The asymmetric K𝛽2,5 line was fitted with five Voigtians. The energies, intensities, and Lorentzian widths were free fitting parameters, whereas the instrumental width was kept fixed. The fitted linear background was subtracted beforehand in the presented X-ray spectrum.
3.2
K
h𝛽 Hypersatellite transition
In Figure 3, we present the Kh𝛽1,3 X-ray emission spectrum. The latter was fitted with two Voigtians, one corresponding to the highest peak assigned to the Kh𝛽1,3 hypersatellite transition and the second to the low energy asymmetry denoted as Kh𝛽′
1,3. From the fit, an energy difference of 8.39(28) eV between the two components and a relative intensity I(Kh𝛽′
1,3∕I(Kh𝛽1,3)=0.27(1) were obtained. Only one Voigtian was used for the main line because the Kh𝛽
1 and Kh𝛽3 hypersatellite transitions are highly overlapping due to the small expected separation (≤ 2 eV)[28]and large lifetime widths,[16]and because the
Kh𝛽
1to Kh𝛽3intensity ratios reported by Chen et al.[29]and Costa et al.[28]are only 8% and 11%, respectively. The inten-sities, energies, and the Lorentzian widths of the Voigtians and the parameters of the linear background were used as free fitting parameters, whereas the instrumental response of the spectrometer was kept fixed in the fit.
4
T H EO RY
Wave functions and binding energy values were calculated within the MCDF approach using the relativistic general purpose MCDF and general matrix elements code devel-oped by Desclaux and Indelicato.[35,36]The electronic wave functions and energies are evaluated in the Coulomb field of the nucleus and the spherically averaged electronic field. The Breit interaction and the vacuum polarization terms
are also included in the self-consistent field calculation, and the self-energy is included as perturbation. A detailed description of the Hamiltonian and wave functions can be obtained in the previous studies.[37–41]
Having in view the calculation of the radiative decays, which were obtained using the relativistic expressions implemented in the MCDF general matrix elements code,[42–44] the so-called optimized levels (OL) method was followed to calculate the wave functions and ener-gies of the levels involved in all possible transitions, using full relaxation of both initial and final states. Since the spin-orbitals of the initial and final levels were optimized separately, they are not orthogonal. To deal with the non-orthogonality of the wave functions, the code uses the formalism described by Löwdin.[45]The length gauge was used for all radiative transition probabilities.
Initial-state wave functions for the Kh𝛽 hypersatellite transitions were generated for configurations that contain two initial inner-shell vacancies in the K-shell, whereas final state wave functions were generated for configura-tions that contain one vacancy in the K-shell and another one in an higher shell. Due to the very high number of levels and consequently of radiative transitions, multicon-figuration wave functions beyond intermediate coupling were not employed in the calculation.
For the simulation of the Kh𝛽 hypersatellite spectrum, we have used the calculated transition rates, energies and the specific level degeneracy. Since the initial state for both the Kh𝛽
1 and Kh𝛽3 lines is the same, and the final line intensity is normalized to the experimental spectrum, the fluorescence yield of the initial two-hole level is not needed for the simulation. Each of the 179,712 radiative transi-tions calculated in this work were turned into individual Voigtian distributions with a Gaussian width value equal to the spectrometer energy broadening, following a similar procedure as in the study of Guerra et al.[46]. The final syn-thesized spectrum is the sum of all the individual Voigtian components, without any fits to the experimental spec-trum other than an energy offset due to the Auger shift, which was not calculated in this work.
5
R E S U LT S A N D D I S C U S S I O N
5.1
Energies and energy shifts
The energies of the K𝛽 hypersatellite and diagram transi-tions obtained in the present work are listed in Table 1. The energies of the Kh𝛽
1,3 hypersatellite line and Kh𝛽1′,3 hypersatellite asymmetry component as well as the cen-ter of gravity energy of these two lines are listed. The peak energies of the K𝛽1,3 diagram and K𝛽2,5 VtC transitions (Voigtians represented by solid lines in Figures 1 and 2, respectively) as well as the center of gravity energies of the K𝛽1,3and K𝛽2,5transitions are also presented. For the center of gravity energy ̄E(K𝛽1,3), the K𝛽′ component (see Figure 1) was not considered.
Present energy differences between the K𝛽2,5 VtC and
K𝛽1,3 diagram transitions amount to 39.73(7) eV if one considers the peak energies and to 39.57(16) eV if one considers the center of gravity energies. Both results are consistent with the experimental values of 39.5(3) eV and 40.1(3) eV obtained with synchrotron radiation beams by Tirao et al.[47]and Deluigi et al.,[8]respectively, whereas the shift of 37.88 eV obtained by Iihara[48]with an X-ray tube and the one of 43.9(1.4) eV determined by Uřsǐc et al.[10] with protons are significantly smaller, respectively, bigger, than the values found in this work.
The energy shift ΔE = E(Kh𝛽1,3)- ̄E(K𝛽1,3)of the hyper-satellite with respect to its parent diagram line is presented in Table 2 where it is compared with the theoretical shift obtained in the present work and to the one calculated by Costa et al.[28]If one assumes that the accuracy of the theoretical results is about 1 eV, our experimental value agrees with the theoretical one and with the prediction of Costa. To our best knowledge, no other experimental value is available in the literature for Cr, but there is an accu-rate value for Fe of 336.0(5) eV,[16] which is well in line with the theoretical prediction of Costa and three older and less precise values for Mn,[49]Ge, and In[50]of 345(35) eV, 390(20) eV, and 830(60) eV, respectively. The theoretical energy shifts calculated by Costa are plotted as a function of the atomic number Z in Figure 4 together with the exper-imental and theoretical results obtained in this work for Cr and the above mentioned other existing experimental data. TABLE 1 Energies of the Kh𝛽
1,3hypersatellite and Kh𝛽′1,3asymmetry component and the
center of gravity energy ̄E(Kh𝛽
1,3)of these two lines. The peak energies of the K𝛽1,3and K𝛽2,5 transitions and the center of gravity energies ̄E(K𝛽1,3)and ̄E(K𝛽2,5)are also listed
E(Kh𝛃1,3) E(Kh𝛃′1,3) ̄E(Kh𝛃1,3) E(K𝜷1,3) ̄E(K𝛃1,3) E(K𝜷2,5) ̄E(K𝛃2,5) 6254.88(3) 6246.49(28) 6253.14(6) 5946.42(2) 5945.09(3) 5986.15(7) 5984.66(16) Note. All values are given in eV. The quoted uncertainties correspond to 1𝜎 statistical errors from the fits.
5.2
Spectral shapes and line widths
The measured spectral shapes of the K𝛽1,3 diagram line, and Kh𝛽1,3 hypersatellite are plotted in Figures 1 and 3. The plots clearly show that the spectral profiles of both transitions exhibit complex line shapes with characteris-tic low energy asymmetries. For the K𝛽 diagram transi-tion, the 3p3d exchange interactransi-tion, that depends on the number of unpaired 3d electrons, gives rise to predom-inantly low-spin (K𝛽1,3 main line), high-spin, (K𝛽′) and spin-flip (K𝛽x) satellite transitions. In a simplified picture, the spin-orbit splitting and the 3p3d exchange interaction are the main factors determining the spectral shapes of the K𝛽1,3diagram line. Regarding the Kh𝛽1,3hypersatellite spectrum, the overall shape shows a spread in the multi-plet structure over a larger energy as compared with theK𝛽1,3 diagram transition. The shorter lifetime of the ini-tial double core-hole state results in a broadening of the spectral features and merging of components into each other. This is reflected in the bigger line width of the Kh𝛽
1,3 hypersatellite transition.
The FWHM and the Lorentzian widths of the K𝛽1,3main line and Kh𝛽
1,3hypersatellite obtained in this experiment
FIGURE 4 (color online) Energy shift ΔE of the Kh𝛽
hypersatellite relative to the K𝛽 diagram transition as a function of the atomic number Z. As shown, existing experimental data are scarce. Error bars of our result and the one of Diamant et al.[16]are to small to be seen
TABLE 2 Energy shift ΔE between the Kh𝛽
1,3hypersatellite and its
K𝛽1,3parent diagram line
Present (Exp.) Present (Theo.) Costa et al.[28]
309.79(4) 310.8 309.49a
310.85(6)
Note. The second present value for the shift corresponds to the difference of the center of gravity energies of all spectral components of the hypersatellite and diagram spectra. Our experimental results are compared with theoretical predictions.
aLinear interpolation of the values quoted for V and Fe.
are presented in Table 3. For the K𝛽1,3diagram transition, other existing experimental values are also presented. It is noteworthy that the Kh𝛽
1,3 hypersatellite line width is larger than the value Γ(Kh𝛽1,3) ≅ 3 · ΓK+ΓM2,3 expected
from the sum of the initial state natural width ΓKK≅ 2 · ΓK, where ΓKstands for the 1s level width, and the natural width ΓK+ΓM2,3 of the final states 1s
−13p−1
1∕2,3∕2. Using for the atomic level widths the values recommended by Camp-bell and Papp,[51]the line width derived from the above for-mula yields a value of 4.3 eV, which is about a factor of two smaller than the measured line width. For the Kh𝛼 hyper-satellite lines, in particular, in the case of 3d transition metals, such discrepancies have been already observed (see, e.g.,the studies of Hoszowska et al. and Diamant et al.[14,15]). From the reported Kh𝛽
1,3hypersatellite spec-tra plots for Sc,[52]Ti,[17]and Fe,[16]one can derive FWHM widths of about 7, 8, and 15 eV, respectively. The FWHM of Sc (Z=21) and Ti (Z=22) are comparable with the FWHM of 8.8 eV obtained in this work for Cr (Z=24), whereas the value found for Fe (Z=26) seems to be unexpectedly high as compared with those of the three lighter elements. In Figure 5b one can see the comparison of the simulated and experimental spectrum. The agreement is satisfactory but the structures on the low-energy flank are not observed in the experimental spectrum, and the asymmetry on the high energy side of the measured spectrum is not repro-duced by the calculations. The FWHM of the synthetized hypersatellite line amounts to 11.2 eV, whereas the mea-sured FWHM is 8.8 eV. The main reason for the discrep-ancies is, very likely, that the calculations were performed for isolated atoms while the experiment was carried out with a bulk metallic sample. As pointed out before, the chemical environment of the target atoms in the exper-imental sample cannot be neglected, specially for atoms whose electronic structures are as complex as Cr, with a 3d half-filled shell. The molecular bonds of the bulk sam-ple can significantly change the line shape due to changes made to selection rules for radiative transitions, as well as the change in orbital energies, which alone can enable new Auger channels which might be closed in isolated TABLE 3 The full widths at half maximum (FWHM) and the natural line widths of the K𝛽1,3main diagram line and Kh𝛽1,3 hypersatellite
FWHM Line width
Line Present Other (Exp.) Present Other (Exp.)
K𝛽1,3 2.7 2.53[6] 1.47(7) 1.78(8)[8] 2.68(5)[55] 1.80[55] Kh𝛽 1,3 8.8 - 8.14(6) -Kh𝛽′ 1,3 - - 14.0(5)
-Note. For the diagram line, present results, and available experimental data from the literature are given. All widths are quoted in eV.
FIGURE 5 (color online) (a) Theoretical stick spectrum of the
Kh𝛽
1,3transition. The positions of the sticks correspond to the energies of the different hypersatellite components and their heights to the transition probabilities of the latter. (b) Comparison between the simulated Kh𝛽
1,3hypersatellite spectrum (blue solid line) with the experimental one (open circles). The theoretical spectrum was obtained by summing all Voigtians attached to the components of the stick spectrum
atoms.[53,54]The calculated spin-orbit splitting appears to be narrower than in the experimental spectrum, as can be seen by the high energy tail, which is missing in the theoretical simulation. Nevertheless, the very good double Voigt fit of the experimental spectrum leads us to conclude that in fact, the chemical environment of the solid sam-ple contributes to the narrowing of the spin-orbit splitting, which makes the Kh𝛽1and Kh𝛽3lines more symmetric.
6
S U M M A RY A N D CO N C LU D I N G
R E M A R K S
In this work, we have investigated the energy, shape and line width of the Kh𝛽
1,3hypersatellite X-ray line of metallic
Cr. For comparison, the K𝛽1,3 diagram line and the K𝛽2,5 VtC lines were also measured. The experiment was car-ried out at the SSRL using the seven-crystal Johann-type hard X-ray spectrometer. The high-energy resolution and high-collection efficiency of the X-ray spectrometer com-bined with a photon beam intensity of about 1013 pho-tons/s allowed to measure the weak Kh𝛽1,3hypersatellite with high precision. To the best of our knowledge, the
Kh𝛽1,3hypersatellite transition of Cr was measured for the first time.
The energies, energy shifts, line shapes, and line widths obtained in this work for the K𝛽1,3diagram line and K𝛽2,5 VtC transitions were found to be in good agreement with the experimental and theoretical data available in the liter-ature. For the Kh𝛽
1,3hypersatellite transition the obtained energy shift of 310.85(7) eV between the centroids of the hypersatellite and the K𝛽1,3diagram transitions is in excel-lent agreement with the value of 310.8 eV predicted by the present MCDF calculations and also consistent with the value of 309.49 eV calculated earlier by Costa. For the FWHM of the Kh𝛽
1,3hypersatellite, a result of 8.8 eV was found, while the Lorentzian width of the main hypersatel-lite component deduced from the fit amounts to 8.14(6) eV, a result which is about a factor of two larger than the value expected from the sum of the widths of the initial and final states. The measured Kh𝛽
1,3 hypersatellite spectrum was found to exhibit a complex spectral line shape with a spread in the multiplet structure over a larger energy range compared with the diagram transition. Two components, a main peak and a low energy shoulder, are characteristic of the Kh𝛽1,3hypersatellite spectral shape. The latter was also determined from extensive MCDF calculations. A sat-isfactory agreement is obtained between the overall shapes of the experimental and theoretical spectra, but deviations are observed on the low- and high-energy flanks of the hypersatellite line. The discrepancies were explained by chemical effects which were not considered in the MCDF calculations.
AC K N OW L E D G E M E N T S
The financial support of the Swiss National Sci-ence Foundation (Grant No. 200020-146739) is acknowledged by F. Z., J. H., and J.-Cl. D. M. G. acknowledges the support of the FCT, under the Contract No. SFRH/BPD/92455/2013 and the project PTDC/FIS-AQM/31969/2017, “Ultra-high-accuracy X-ray spectroscopy of transition metal oxides and rare earths.” This work was also partly supported by the research cen-ter grants nos. UID/FIS/04559/2013 to LIBPhys-UNL, and UID/MULTI/04046/2013 to BioISI, from the FCT/MCTES/PIDDAC. Parts of this work have been car-ried out in the framework of the SPARC collaboration. We
are also thankful to the Standford Synchrotron Radiation Lightsource, which is a National User Facility operated by Standford University on behalf of the U.S. Department of Energy, Office of Basic Energy Sciences.
O RC I D
Joanna Hoszowska https://orcid.org/ 0000-0003-4075-343X
José Pires Marques https://orcid.org/ 0000-0002-3797-3880
R E F E R E N C E S
[1] P. Glatzel, U. Bergmann, Coord. Chem. Rev. 2005, 249, 65. [2] G Vankó, T. Neisius, G. Molnár, F. Renz, S. Kárpáti, A. Shukla,
F. de Groot, J. Phys. Chem. B 2006, 110, 11647.
[3] V. A. Safonov, L. N. Vykhodtseva, Y. M. Polukarov, O. V. Safonova, G. Smolentsev, M. Sikora, S. G. Eeckhout, P. Glatzel,
J. Phys. Chem. B2006, 110, 23192.
[4] G. Smolentsev, A. V. Soldatov, J. Messinger, K. Merz, T. Wey-hermüller, U. Bergmann, Y. Pushkar, J. Yano, V. K. Yachandra, P. Glatzel, J. Am. Chem. Soc. 2009, 131, 13161.
[5] N. Lee, T. Petrenko, U. Bergmann, F. Neese, S. DeBeer, J. Am.
Chem. Soc.2010, 132(28), 9715.
[6] G. Hölzer, M. Fritsch, M. Deutsch, J. Härtwig, E. Förster, Phys.
Rev. A1997, 56, 4554.
[7] K. Tsutsumi, H. Nakamori, K. Ichikawa, Phys. Rev. B 1976, 13, 929.
[8] M. T. Deluigi, G. Tirao, G. Stutz, C. Cusatis, J. Riveros, Chem.
Phys.2006, 325, 477.
[9] S. P. Limandri, A. C. Carreras, R. D. Bonetto, J. C. Trincavelli,
Phys. Rev. A2010, 81, 012504.
[10] M. Uršiˇc, M. Kavˇciˇc, M. Budnar, Nucl. Instr. and Meth. B 2003,
211, 7.
[11] S. Fazini ´c, M. Jakši ´c, L. Mandi ´c, J. Dobrini ´c, Phys. Rev. A 2006,
74, 062501.
[12] S. Fazini ´c, L. Mandi ´c, M. Kavˇciˇc, I. Božiˇcevi ´c, Spectrochim. Acta
Part B2011, 66, 461.
[13] J. Hoszowska, A. K. Kheifets, J.-Cl. Dousse, M. Berset, I. Bray, W. Cao, K. Fennane, Y. Kayser, M. Kavˇciˇc, J. Szlachetko, M. Szlachetko, Phys. Rev. Lett. 2009, 102, 073006.
[14] J. Hoszowska, J.-Cl. Dousse, W. Cao, K. Fennane, Y. Kayser, M. Szlachetko, J. Szlachetko, M. Kavˇciˇc, Phys. Rev. A 2010, 82, 063408.
[15] R. Diamant, S. Huotari, K. Hämäläinen, R. Sharon, C. C. Kao, M. Deutsch, Phys. Rev. A 2009, 79, 062511.
[16] R. Diamant, S. Huotari, K. Hämäläinen, R. Sharon, C. C. Kao, M. Deutsch, Phys. Rev. Lett. 2003, 91, 193001.
[17] S. Huotari, K. Hämäläinen, R. Diamant, R. Sharon, C.-C. Kao, M. Deutsch, J. Electron Spectrosc. Relat. Phenom. 2004, 137, 293. [18] R. Alonso-Mori, J. Kern, R. J. Gildea, D. Sokaras, T.-C. Weng, B. Lassalle-Kaiser, R. Tran, J. Hattne, H. Laksmono, J. Hellmich, C. Glöckner, N. Echols, R. G. Sierra, D. W. Schafer, J. Sell-berg, C. Kenney, R. Herbst, J. Pines, P. Hart, S. Herrmann, R. W. Grosse-Kunstleve, M. J. Latimer, A. R. Fry, M. M. Messer-schmidt, A. Miahnahri, M. M. Seibert, P. H. Zwart, W. E. White, P. D. Adams, M. J. Bogan, S. Boutet, G. J. Williams, A. Zouni, J. Messinger, P. Glatzel, N. K. Sauter, V. K. Yachandra, J. Yano, U. Bergmann, Proc. Natl. Acad. Sci. U.S.A. 2012, 109, 19103.
[19] M. Kavˇciˇc, M. Budnar, A. Mühleisen, F. Gasser, M. Žitnik, K. Buˇcar, R. Bohinc, Rev. Sci. Instrum. 2012, 83, 033113.
[20] J. Hoszowska, J.-Cl. Dousse, J. Electron Spectrosc. Relat.
Phe-nom.2004, 137-140, 687.
[21] J. Szlachetko, M. Nachtegaal, E. de Boni, M. Willimann, O. Safonova, J. Sa, G. Smolentsev, M. Szlachetko, J. A. van Bokhoven, J.-Cl. Dousse, J. Hoszowska, Y. Kayser, P. Jagodzin-ski, A. Bergamaschi, B. Schmitt, C. David, A. Lücke, Rev. Sci.
Instrum.2012, 83, 103105.
[22] E. Kleymenov, J. A. van Bokhoven, C. David, P. Glatzel, M. Janousch, R. A. Mori, M. Studer, M. Willimann, A. Bergam-aschi, B. Henrich, M. Nachtegaal, Rev. Sci. Instrum. 2011, 82, 065107.
[23] D. Sokaras, T.-C. Weng, D. Nordlund, R. A. Mori, P. Velikov, D. Wenger, A. Garachtchenko, M. George, V. Borzenets, B. John-son, T. Rabedeau, U. Bergmann, Rev. Sci. Instrum. 2013, 84, 053102.
[24] H. Hayashi, M. Kawata, R. Takeda, Y. Udagawa, Y. Watanabe, T. Takano, S. Nanao, N. Kawamurac, J. Electron Spectrosc. Relat.
Phenom.2004, 136(1-2), 191.
[25] B. Dickinson, G. T. Seidler, Z. W. Webb, J. A. Bradley, K. P. Nagle, S. M. Heald, R. A. Gordon, I. M. Chou, Rev. Sci. Instrum. 2008, 79, 123112.
[26] J.-L. Hazemann, O. Proux, V. Nassif, H. Palancher, E. Lahera, C. Da Silva, A. Braillard, D. Testemale, M.-A. Diot, I. Alliot, W. Del Net, A. Manceau, F. Gélébart, M. Morand, Q. Dermigny, A. Shukla, J. Synchrotron Rad. 2009, 16, 283.
[27] L. Journel, L. E. Khoury, T. Marin, R. Guillemin, S. Carniato, A. Avila, R. Delaunay, C. F. Hague, M. Simon, Rev. Sci. Instrum. 2009, 80, 093105.
[28] A. M. Costa, M. C. Martins, J. P. Santos, F. Parente, P. Indelicato,
J. Phys. B: At. Mol. Opt. Phys.2006, 39, 2355.
[29] M. H. Chen, B. Crasemann, H. Mark, Phys. Rev. A 1982, 25, 391. [30] U. Bergmann, S. P. Cramer, Proc. SPIE 1998, 3448, 198. [31] G. K. Wertheim, M. A. Butler, K. W. West, D. N. E. Buchanan,
Rev. Sci. Instrum.1974, 45, 11.
[32] G. Peng, F. M. F. deGroot, K. Haemaelaeinen, J. A. Moore, X. Wang, M. M. Grush, J. B. Hastings, D. P. Siddons, W. H. Arm-strong, O. C. Mullins, S. P. Cramer, J. Am. Chem. Soc. 1994, 116, 2914.
[33] U. Bergmann, C. R. Horne, T. J. Collins, J. M. Workman, S. P. Cramer, Chem. Phys. Lett. 1999, 302(1-2), 119.
[34] J. Hoszowska, J.-Cl. Dousse, J. Kern, C. Rhêmem, Nucl. Instr.
and Methods Phys. Res. A1996, 376, 129.
[35] J. P. Desclaux, Comput. Phys. Commun. 1975, 9, 31.
[36] P. Indelicato, J. Desclaux, MCDFGME, a multiconfiguration Dirac Fock and general matrix elements program, 2007 ; URL http.//dirac.spectro.jussieu.fr/mcdf.
[37] P. Indelicato, J. P. Desclaux, Phys. Rev. A 1990, 42, 5139. [38] P. Indelicato, Phys. Rev. A 1995, 51, 1132.
[39] P. Indelicato, Phys. Rev. Lett. 1996, 77, 3323.
[40] J. P. Santos, G. C. Rodrigues, J. P. Marques, F. Parente, J. P. Desclaux, P. Indelicato, Eur. Phys. J. D 2006, 37, 201.
[41] M. C. Martins, A. M. Costa, J. P. Santos, F. Parente, P. Indelicato,
J. Phys. B: At. Mol. Phys.2004, 37, 3785.
[42] P. Indelicato, O. Gorveix, J. P. Desclaux, J. Phys. B 1987, 20, 651. [43] O. Gorceix, P. Indelicato, J. P. Desclaux, J. Phys. B 1987, 20, 639. [44] P. Indelicato, Nucl. Instr. Methods Phys. Res. A 1988, 31, 14. [45] P.-O. Löwdin, Phys. Rev. 1955, 97, 1474.
[46] M. Guerra, J. M. Sampaio, T. I. Madeira, F. Parente, P. Indel-icato, J. P. Marques, J. P. Santos, J. Hoszowska, J.-Cl. Dousse, L. Loperetti, F. Zeeshan, M. Müller, R. Unterumsberger, B. Beckhoff, Phys. Rev. A 2015, 92, 022507.
[47] G. Tirao, S. Ceppi, A. L. Cappelletti, E. P. Miner, J. Phys. Chem.
Solids2010, 71, 199.
[48] J. Iihara, T. Omori, K. Yoshihara, K. Ishii, Nucl. Instrum.
Meth-ods B1993, 75, 32.
[49] J. P. Briand, P. Chevalier, A. Johmson, J. P. Rozet, M. Tavernier, A. Touati, Phys. Lett. A 1974, 49, 51.
[50] J. P. Briand, A. Touati, M. Frilley, P. Chevallier, A. Johnson, J. P. Rozet, M. Tavernier, S. Shafroth, M. O. Krause, J. Phys. B 1976,
9, 1055.
[51] J. L. Campbell, T. Papp, At. Data Nucl. Data Tables 2001, 77, 1. [52] F. Zeeshan, J.-Cl. Dousse, J. Hoszowska, J. Electron Spectrosc.
Relat. Phenom2019, (in press).
[53] M. Guerra, J. M. Sampaio, F. Parente, P. Indelicato, P. Hönicke, M. Müller, B. Beckhoff, J. P. Marques, J. P. Santos, Phys. Rev. A 2018, 97, 042501.
[54] Y. Ito, T. Tochio, M. Yamashita, S. Fukushima, A. M. Vlaicu, L. Syrocki, K. Slabkowska, E. Weder, M. Polasik, K. Sawicka, P. Indelicato, J. P. Marques, J. M. Sampaio, M. Guerra, J. P. Santos, F. Parente, Phys. Rev. A 2018, 97, 052505.
[55] H. Sorum, O. Weng, J. Bremer, Phys. Status Solidi B 1982, 109, 335.
How to cite this article: Zeeshan F, Hoszowska
J, Dousse J-C, et al. Diagram, valence-to-core and hypersatellite K𝛽 X-ray transitions in metal-lic chromium. X-Ray Spectrometry. 2019;1–9.