[ 1 ]
databases: the case of Sado Estuary management
M. Painho*; R. Sena*; S. Caeiro**; F. Martins***; M.H. Costa****; R. Neves*****
* ISEGI/UNL, Travessa Estêvão Pinto, 1070 Lisboa([email protected]), ([email protected])
**IMAR-Universidade Aberta, R. Escola Politécnica, 1200 Lisboa ([email protected]) *** EST, Universidade do Algarve, Campus da Penha, 8000 Faro ([email protected]) **** IMAR - FCT/UNL, Quinta da Torre, 2825-114 Monte da Caparica
*****IST/UTL, Av. Rovisco Pais, 1049 – 001 Lisboa ([email protected])
Abstract Geographic information systems (GIS) are now widely applied in coastal resource management. Their ability to organise and interface information from a large range of public and private data sources, and their ability to combine this information, using management criteria, to develop a comprehensive picture of the system explains the success of GIS in this area. The use of numerical models as a tool to improve coastal management is also
widespread. Less usual is a GIS-based management tool implementing a comprehensive management model and integrating a numerical modelling system into itself. In this paper such a methodology is proposed. A GIS-based management tool based on the DPSIR model is presented. An overview of the MOHID numerical modelling system is given and the method of integrating this model in the management tool is described. This system is applied to the Sado Estuary (Portugal). Some preliminary results of the integration are presented, demonstrating the capabilities of the management system.
Keywords numerical models, GIS, estuary management, DPSIR model
1. Introduction
It is always a challenge to find the best methodology to manage complex and transition ecosystems like estuaries where the pressure of development is high.
The implementation of data management frameworks in coastal zones can be very useful in the start-up phase of management initiatives. The DPSIR methodology, developed by the European Environmental Agency, provides a framework for data synthesis and links environmental information using indicators. This model is being used with success in several programs (EEA, 1999a; EEA, 1999b), as well as other studies applied to oceans (Antunes and Santos, 1999), and coastal zones (e.g. Turner, 2000; Turner and Salomons, 1999).
GIS is being widely applied in coastal resource management. The need for some means of organising and interfacing information from a large range of public and private data sources to develop a comprehensive picture of what is happening in the coastal zone has been recognised by resource managers (Ricketts 1992).
The importance of hydrodynamic, transport and ecological models as decision-making tools has long been recognized. For an efficient management procedure it is essential to identify the current state of the system, to understand the basic mechanisms and interrelations between the different state variables, and to be able to predict the trends as a function of the management actions. A numerical modelling system can help to satisfy all these
requirements. Data produced by the model must, however, be used within the framework of the management policy being implemented. This data must therefore be linked and crossed with data from a multitude of other sources. Data from a number of different sources is also needed to run the numerical model. This data is needed in the form of initial conditions, forcing functions, calibration and validation sets. External data, not relevant to the simulation itself, is also needed to understand the results and to interpret the processes. Traditionally these modelling systems run as independent units. The disadvantages of this approach are evident: the fluxes of information between the modelling system and the management tool are complex, due to their lack of compatibility. The need for special training in its interpretation will be a barrier to the information and lead to misjudgements. In this paper the 3D hydrodynamic and ecological modelling system MOHID is integrated into a management
tool and applied to the Sado Estuary. The management tool is based on the DPSIR
framework, implemented using a GIS. The modelling results will be integrated with the other data in the management tool, enabeling comparison and cross referencing of the whole data. A prototype of the integration of the transport model into the GIS management tool is demonstrated.
2. Study area
The Sado Estuary is the second largest estuary in Portugal with an area of approximately 24,000 hectares. It is located on the west coast of Portugal, 45 kms south of Lisbon. Most of the estuary is classified as a nature reserve. Exception is made for the city of Setúbal, its port, and a considerable part of its surrounding area. The Sado Estuary basin is subject to intensive land-use practices and plays an important role in the local and national economy. Most of the activities in the estuary (e.g. industry, shipping, intensive farming, tourism and urban development) have negative effects on water, sediment and biotic communities (Caeiro et al., 1999). The difficulties of the reserve authorities in managing urban growth are reflected in the higher urban growth rate inside the protected area boundary in comparison to its surroundings (Painho et al., 1999). This is probably due to the fact that numerous official bodies are responsible for land-use planning in the reserve area, causing, at times, management deadlock.
3. Dynamic and ecological model
The Mohid modelling system is composed of a number of modules simulating hydrodynamic, sediment transport, water quality and ecological processes. The models are integrated using an object-oriented methodology (Miranda et al., 2000).
The hydrodynamic model solves the three-dimensional incompressible primitive equations (Martins et al., 1998). Hydrostatic equilibrium is assumed as well as Boussinesq approximation. The specific mass is calculated as a function of temperature and salinity by a simplified equation of state. The model uses a finite volume approach. This method makes the solution independent of the mesh geometry, allowing the use of a generic vertical mesh. The horizontal mesh is the Arakawa-C staggered grid. The temporal discretization is carried out by means of a semi-implicit (ADI) algorithm with two time levels per iteration. The vertical eddy viscosity is calculated using the GOTM closures. The model also solves a transport equation for salinity and temperature in order to compute the specific mass. The Eulerian transport module used to transport these properties is based on the same finite volume method of the hydrodynamic model and is independent of the property transported.
modules to transport different conservative and non-conservative properties. The sediment transport model simulates cohesive and non-cohesive sediments using an Eulerian approach. The falling velocity is computed by the Dyer (1986) formulation and the bottom exchanges are computed by different formulations (Partheniades, 1965; Odd and Cooper, 1989).
The ecological model uses a zero-dimension formulation that enables the use of the same model with both the Lagrangian and the Eulerian transport models. With this method the model equations are implemented in the form of sources and sinks in the transport models. Those terms are written in a generic form and can be applied both to Eulerian cells and to Lagrangian particles. The ecological model simulates the nitrogen cycle, the dissolved oxygen concentration, the biochemical oxygen demand, and the zooplankton and phytoplankton concentrations (Pina, 2001). The nitrogen species include the three main inorganic forms: ammonia, nitrate and nitrite and also three organic fractions: the dissolved refractory fraction, dissolved non-refractory fraction and particulate fraction.
4. Dynamic, environmental management of the Sado Estuary
4.1 Method description
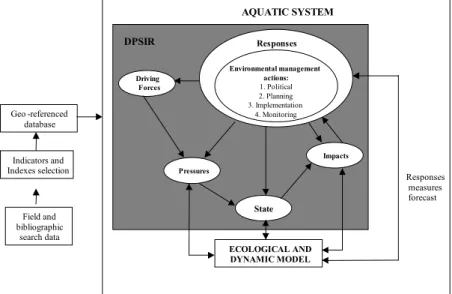
The management methodology is based on the DPSIR model and is developed within the context of a GIS (Fig. 4.1). This framework organizes information in five different categories, as follows. Driving forces are the underlying causes of environmental problems. They refer to the needs of individuals and institutions, which lead to activities that exert pressures on the environment. These pressures modify the state of the environment (e.g. change in water quality and fish populations) and, in turn, these modifications may have an impact on ecosystems and on human well-being. Undesirable impacts lead to a response from society that results in the formulation of an environmental policy. The policy responses lead to changes in the DPSIR chain. Depending on the results achieved, further responses are
formulated (Antunes and Santos, 1999)
.
Respostas Driving Forces Pressures State Impacts AQUATIC SYSTEM Geo -referenced database ECOLOGICAL AND DYNAMIC MODEL Responses measures forecast Field and bibliographic search data Indicators and Indexes selection Environmental management actions: 1. Political 2. Planning 3. Implementation 4. Monitoring Responses DPSIR
The identification and assessment of problems related to coastal zone environmental management therefore requires the definition of a set of indicators aimed at the different parts of the DPSIR framework. To permit its application to the Sado Estuary an appropriate set of indicators for each compartment were defined. This set was obtained by comparing optimal indicator selection, concepts and criteria against an extensive data search on the environmental characterization of the Sado Estuary. (Caeiro et al., 1999).
In the proposed model, the state of the estuary is mostly evaluated through the sediment and benthos compartment. Sediment is a compartment where contaminants tend to accumulate first and suffer variations for short periods reflecting the average conditions of months. (e.g Wilson, 1988; Eliot and McManus, 1989; LUOMA, 1990). Also macrobenthic organisms are a primary means of assessing ecosystem response (Mucha and Costa, 1999). Studying the state of the estuary on the basis of the sediment and benthos compartment alone (not including the water compartment), also makes this methodology less expensive, easier to deal with and more economical in terms of resources. These are essential factors in efficient environmental management.
This management tool is also based on identifying and characterizing a series of environmentally homogeneous sediment areas. The boundary definition of each area was based on sediment general characterization parameters (fine fraction, redox potential and organic matter), strongly related to the composition and distribution of benthic organisms and contaminant mobility/accumulation. This data was collected in a campaign carried out from November 2000 to January 2001. 153 sites were sampled using a systematic unaligned sampling method (Webster 1999) of a 500 x 750 m cell-size (Fig. 4.2c) (Caeiro et al., 2002). The boundaries of each homogeneous area were computed from data of the sediment parameters referred to above and were defined through indicator kriging of cluster analysis based on the dissimilarity matrix function of geographical separation.
The environmental quality assessment of the estuary is performed by characterising the indicators of the DPSIR categories in each homogeneous area. The Sado Estuary environmental management area diagnosis is developed through different exploratory analyses, namely aggregation of indicators into different indices and statistical treatment. GIS will allow overlying the five different categories of the DPSIR model.
The integration of the ecological and dynamic model in the DPSIR framework allows useful outputs with this management tool. The sediment transport model calculates which estuary area will suffer an effect and resulting impact due to a certain pressure indicator.
‘Responses’ action forecast will also be possible using the ecological and dynamic model. These ‘Responses’ measures will change the quantitative pressure indicator and resulting state and impact (Fig. 4.1).
In summary, the dynamic modelling system will be introduced into this management tool in two ways: i) the management tool will be used as data input to the model and will be linked to one specific interface to run the model; ii) the model results will be integrated into the GIS database for analysis along with other information.
The integration between dynamic environmental and social economical data in the GIS allows the construction of a management support interface to end-users like the administration, the Nature Reserve, local authorities or private consultants. This management and planning tool is essential for the rehabilitation and recovery of the Sado Estuary zones already contaminated and for assuring the conservation and biodiversity of the protected areas.
4.2. Integration of the numeric model into the geographic database
The final objective of this work is to obtain a management tool able to drive the MOHID modelling system by itself. At that stage the management tool will be used to create the data needed by the modelling system and will be able to import the modelling results and merge them into its own structures for analysis. A step-by-step methodology is used to implement the integration. In the first step, reported in this paper, the model is driven outside the management tool. Only the model outputs are integrated.
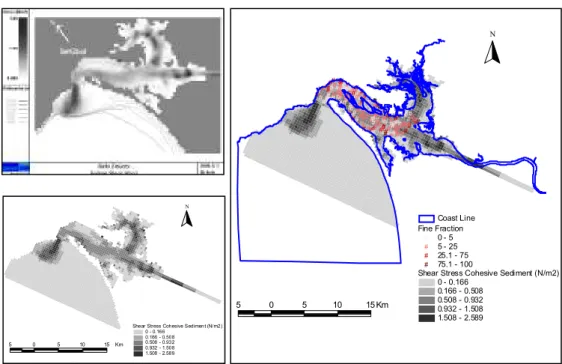
Fig. 4.2 Bottom shear stress model results a) outside the GIS; b) inside the GIS; c) integrated with Sado estuary digitised boundaries and sediment fine fraction in 153 sampling sites.
The model results are produced in the Hierarchical Data Format (HDF) format. HDF was created at the National Center for Supercomputing Applications in the University of Illinois at Urban-Champaign, and is a multiobject file format for sharing scientific data in a distributed environment. HDF satisfies several requirements: support for types of data and metadata commonly used, efficient storage of and access to large data sets, platform independence and extensibility for future enhancements and compatibility with other standard formats.
At the first step of integration, several automatic procedures were developed to get information from the HDF files and produce files in a GIS format. The GIS file format adopted is the ESRI shapefile. These routines allow fast and easy integration of the files produced by the model in the management tool. The first routine extracts the matrix defined in the HDF file and creates a corresponding georeferenced layer. This process involves the shift of the original data to a new origin of coordinates and, after that, the rotation of the resulting layer. With these procedures a new georeferenced matrix is produced.
N
Shear Stress Cohesive Sedimen t (N/m2) 0 - 0.166 0.166 - 0.508 0.508 - 0.932 0.932 - 1.508 1.508 - 2.589 5 0 5 10 15Km # # # # # # # # # ## # #### # # # # # # # # # # # ## # ## # ##### # ## ## # ### ### # # # # # # # # # ## #### # ### ## # # # # # # # # # ### #### # # # ### # #### # # # # # # # # # # # # # # # # # ## # # # # # ## ## # # # # ## # # # # # # # # ### # ## # # # # ## # N 5 0 5 10 15 Km
Shear Stress Cohesive Sediment (N/m2) 0 - 0.166 0.166 - 0.508 0.508 - 0.932 0.932 - 1.508 1.508 - 2.589 Fine Fraction # 0 - 5 # 5 - 25 # 25.1 - 75 # 75.1 - 100 Coast Line
For each of the cells of the matrix we have a measure of a certain variable. The other routines get the variable values of the cells that are stored in the original HDF files and associating them to the corresponding cell in the georeferenced matrix.
An integration example of a transport model output into the GIS is shown in figure 4.2. The integrated analysis of model results and field data in the GIS system is very powerful. In this example the correlation between higher shear stress areas and lower fine fraction sites are easily identified.
The next step of the integration will allow the management tool direct access to the modelling system engine, eliminating the need for file format conversion and promoting full interaction between the modelling and management systems.
5. Conclusions
In this paper a method for integrating a 3D hydrodynamic and ecological model into a GIS estuary management tool was described. The prototype for the transport model integration into the GIS management tool shows how useful the interaction between this two systems is. This is specially true when combining model results with information from other different sources., which is essential for Sado Estuary management. Only first results were presented in this work. In the future the modelling system and the DPSIR management tool will be directly integrated into the GIS system.
References
ANTUNES, P. and SANTOS, R. 1999. Integrated Environmental Management of the Oceans. Ecological Economics. 31: 215-226.
CAEIRO, S.; GOOVAERTS, P.; PAINHO, M.; COSTA, M. H. and SOUSA, S. 2002. Optimal spatial design for mapping estuarine sediment management areas. Abstract proceedings of 5th AGILE Conference on Geographic Information Science. Palma Mallorca, Spain.
CAEIRO, S., RAMOS, T. B., COSTA, M. H. and PAINHO, M. 1999. Gestão de informação ambiental do estuário do Sado: aplicação do Modelo DPSIR. Ed. Santana, F., Vasconcelos, L., Partidáro, M. R., Seixas, M. J., and Sobral, M. P. Proceedings 6º Conferência Nacional sobre a Qualidade do Ambiente. 3: 685 – 696.
DYER, K., 1986. Coastal and Estuarine Sediment Dynamics. John Wiley & Sons, 342 pp.
EEA. 1999a. Environment in the European Union at the turn of the Century. European Environment Agency.
EEA. 1999b. State and Pressures of the Marine and Coastal Mediterranean Environment. Environmental Assessment Series. European Environment Agency.
ELLIOT, M. and MCMANUS, J. 1989. Advances and Future Direction in Marine and Estuarine Studies. Ed. McManus, J. and Elliot, M. Proceedings of EBSA 17 Symposium: 1 – 6.
LUOMA, S. N. 1990. Processes affecting metal concentrations in estuarine and coastal marine sediments. Heavy Metals in the Marine Environment. CRC Press, Boca Raton, Florida: 51-66. MARTINS, F., NEVES, R. and LEITÃO, P. 1998. A three-dimensional hydrodynamic model with
generic vertical coordinate. Hydroinformatics 98, Vol. 2, pp. 1403-1410, Ed. V. Babovic & L. C. Larsen, Balkema, Rotterdam.
MARTINS, F., LEITÃO, P. , SILVA, A. and NEVES, R.. 2001. 3D modelling in the Sado estuary using a new generic vertical discretization approach. Oceanologica Acta 24: S51 - S62.
MIRANDA, R., BRAUNSCHWEIG, F., LEITÃO, P., NEVES, R., MARTINS, F. and SANTOS, A. 2000. MOHID 2000 - A coastal integrated object oriented model. Hydraulic Engineering Software VIII, Ed. W.R. Blain & C.A. Brebbia. WITpress: 393-401.
ODD, N.and COOPER, A. 1989. A two-dimensional model of the movement of fluid mud in a high energy turbid estuary. J. Coastal Research, Special Issue No.5:185-194.
MUCHA, A. P. and COSTA, M. H. 1999. Biosedimentary dynamics on the intertidal (omission?) of the Sado Estuary. Acta Oecologica, 20 (4): 363-376.
PAINHO, M., VASCONCELOS, L. T. and. FARRAL, H. 1999. Tendências evolutivas territoriais em gestão ambiental: o caso do Estuário do Sado. Ed. Santana, F., Vasconcelos, L., Partidáro, M. R., Seixas, M. J. and Sobral M. P. 6ª Conferência Nacional sobre a Qualidade do Ambiente. 3: 637 – 646.
PARTHENIADES, E. 1965. Erosion and deposition of cohesive soils. J. Hydr. Div., ASCE, 91, No. HY1: 105-139
PINA, P. 2001. An Integrated Approach to Study the Tagus Estuary Water Quality. MSc Thesis, Universidade Técnica de Lisboa, Instituto Superior Técnico.
RICKETTS, P. J. 1992. Current Approaches in Geographic Information Systems for Coastal Management. Marine Pollution Bulletin. 25: 82-87.
RODRIGUES, A. M. and V. M. S. QUINTINO. 1993. Horizontal Biosedimentary Gradients across the Sado Estuary, W. Portugal. Netherlands Journal of Aquatic Ecology. 27: 449-464.
TURNER, R. K. 2000. Integrating natural and socio-economic science in coastal management. Journal of Marien Systems. 25: 447-460.
TURNER, R. K. and W. SALOMONS 1999. Introduction and Overview. In: Perspectives on Integrated Coastal Zone Management. Springer. 1-9.
WEBSTER, R. 1999. Sampling, Estimating and Understanding Soil Pollution. GeoEnvII 98 - Geostatistics for Environmental Applications. Quantitative Geology and Geostatistics. Kluwer Academic Publishers. 25-37.