TECHICAL UNIVERSITY OF LISBON FACULTY OF HUMAN KINETICS
Associations of Physical Activity and Maturity with
Adolescents’ Body Composition
Thesis submitted in order to obtain the Master´s Degree in the field of Human Kinetics, specialization in Exercise and Health
Mentor: Professor Maria Filomena Soares Vieira, PhD
Co-mentor: Professor Maria Filomena Araújo da Costa Cruz Carnide, PhD
Jury Commitee:
President: Professor Pedro Jorge do Amaral de Melo Teixeira, PhD
Members: Professor Maria de Fátima Marcelina Baptista, PhD
Professor Maria Filomena Soares Vieira, PhD
Professor Maria Filomena Araújo da Costa Cruz Carnide, PhD
Sofia Alexandra Camelo da Silva 2012
Acknowledgments
I wish to gratefully acknowledge the contributions of many individuals.
Filomena Vieira and Filomena Carnide for the unconditional support, knowledge and availability.
To Filomena Vieira for the essential contribution in the areas of growth and maturation and for the graphical support and to Filomena Carnide for the vital contribution in the biostatistics area.
I also would like to thank to Ana Vasco, for the support in data processing, to Ana Assunção and José Araújo for their availability in the field data collection and processing.
A special thank to Bruno Pereira for his English review and friendship.
And lastly an acknowledgment to those that supported me during the development of this study, particularly in my absent moments. For them I am truly and deeply in debt.
To someone that is no longer among us, although always present in my heart as well as in everything I do.
Resumo Introdução:
Durante a adolescência as diferenças na atividade física (AF) e composição corporal (CC) entre géneros é evidente, contudo as associações da maturidade nessas diferenças têm sido pouco estudados.
Objectivo:
Estudar as associações da AF e maturidade na CC de adolescentes.
Métodos:
Foram avaliados 180 adolescentes (97 rapazes e 83 raparigas com idade média de 13,8 anos). As medições antropométricas utilizadas foram obtidas de acordo com os procedimentos do International Society for the Advancement of Kinanthropometry (ISAK), à excepção do diâmetro abdominal-sagital (DAS). A massa gorda (MG) foi determinada a partir das equações de Slaughter et al. e a idade óssea através do método TW3 (raio-X). A AF foi avaliada através de questionário e acelerometria (Actigraph® GT1M). A análise estatística utilizada foi a regressão linear multifactorial (método stepwise), com o software PASW 18.0.
Resultados:
Nos rapazes a maturidade explica 22% a 66% da variabilidade do índice de massa corporal (IMC), 13% da variabilidade do índice cintura-anca (ICA) e 16% a 59% da variabilidade do DAS. Os comportamentos activos e a AF muito vigorosa (AFMV) conjuntamente com a maturidade explicam 16% e 70% da variabilidade da DAS, respectivamente. 14% da variabilidade da massa gorda (MG) nos rapazes é explicada pela AF leve. Relativamente às raparigas nenhum dos fatores determinantes (AF ou maturidade) foram preditores da MG e ICA, contudo a variabilidade do IMC foi explicada pela AF moderada (AFM) (24%), comportamentos sedentários (28%) e por ambos (31%). A AFM também explicou 31% da variabilidade do DAS.
Conclusões:
Os resultados parecem indicar que existem diferenças de género para as determinantes da CC durante a adolescência. Os principais fatores preditores nos rapazes foram a maturidade, os comportamentos ativos e a AFMV e, nas raparigas, foram os comportamentos sedentários e a AFM.
Abstract
Background:
During adolescence the differences in physical activity (PA) and body composition (BC) between genders become evident, nevertheless the associations of maturity in these differences have been scarcely studied.
Objectives:
To examine the associations of PA and maturity on adolescents' BC.
Methods:
The evaluation comprised 180 adolescents (97 boys and 83 girls, with an average age of 13,8 years). All anthropometric measures were obtained according to the International Society for the Advancement of Kinanthropometry (ISAK) procedures, with exception of the Sagittal Abdominal Diameter (SAD). Fat mass (FM) was determined by Slaughter et al. equations and skeletal age through the TW3 method (X-ray). PA was assessed through questionnaire and accelerometry (Actigraph® GT1M). Data analysis was performed using multifactorial linear regression analysis (stepwise method) with PASW 18.0 software.
Results:
In boys, the maturity explains 22% to 66% of the variability of body mass index (BMI), 13% of the variability of waist-to-hip ratio (WHR) and 16% to 59% of SAD’s variability. The active behaviours and very vigorous PA (VVPA) along with maturity explains 16% and 70% of the variability of the SAD, respectively. 14% of the variability of fat mass (FM) in boys was explained by light PA. Regarding girls none of the determinant factors (PA or maturity) predict the FM and WHR, although the BMI’s variability was explained by moderate PA (MPA) (24%), sedentary behaviours (28%) and both (31%). The MPA also explains 31% of SAD’s variability.
Conclusions:
The results seem to indicate that there are gender differences for BC determinants during adolescence. The main predictive factors for BC in boys were maturity, active behaviours and VVPA and for girls these were sedentary behaviours and MPA.
General Index
Abbreviations 9
Introduction 10
Chapter 1 - Literature review 11
Chapter 2 - Objectives and hypotheses 24
2.1 - General objective 24
2.2 - Specific objectives 24
2.3 - Hypotheses 24
Chapter 3 - Methods and procedures 26
3.1 - Study design 26
3.1.1 - Variables operationalization 26
3.1.2 - Study phases 27
3.2 - Study sample 28
3.3 - Instruments and procedures 28
3.3.1 - Maturity assessment methods 28
3.3.2 - Body composition assessment methods 28
3.3.3 - Physical activity assessment methods 29
3.3.3.1 - QAPACE questionnaire 29
3.3.3.2 - Accelerometry 31
3.4 - Statistical analysis 32
Chapter 4 - Results 33
4.1 - Maturity variables characterization 34
4.2 - Body composition variables characterization 35
4.3 - Physical activity variables characterization (per questionnaire) 36
4.4 - Physical activity variables characterization (per accelerometry) 40
4.6 - Multifactorial linear regression 48
Chapter 5 - Discussion 52
5.1 - Results discussion 52
5.2 - Study limitations 57
5.3 - Considerations and recommendations 58
Chapter 6 - Conclusions 60
Chapter 7 - Bibliography 62
Appendix 1 - Informed consent 69
Tables Content
Table 1 - Operationalization plan 27
Table 2 - Study phases 27
Table 3 - Sample general description by gender and grade level 33
Table 4 - Group variables description by gender and grade level 33
Table 5 - Maturity variables as mean, median, standard deviation and the corresponding 95% confidence interval of the 7th grade 34
Table 6 - Maturity variables as mean, median, standard deviation and the corresponding 95% confidence interval of the 8th grade 34
Table 7 - Maturity variables as mean, median, standard deviation and the corresponding 95% confidence interval of the 9th grade 34
Table 8 - Body composition variables as mean, median, standard deviation and the corresponding 95% confidence interval of the 7th grade 35
Table 9 - Body composition variables as mean, median, standard deviation and the corresponding 95% confidence interval of the 8th grade 36
Table 10 - Body composition variables as mean, median, standard deviation and the corresponding 95% confidence interval of the 9th grade 36
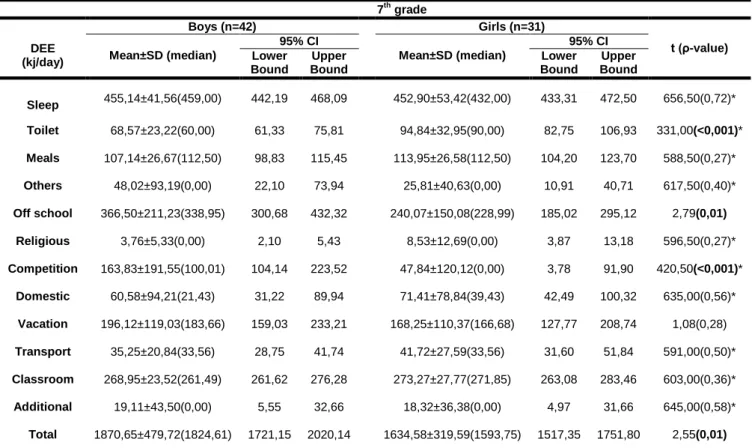
Table 11 - Physical activity (questionnaire) as mean, median, standard deviation and the corresponding 95% confidence interval of the 7th grade 37
Table 12 - Physical activity (questionnaire) as mean, median, standard deviation and the corresponding 95% confidence interval of the 8th grade 37
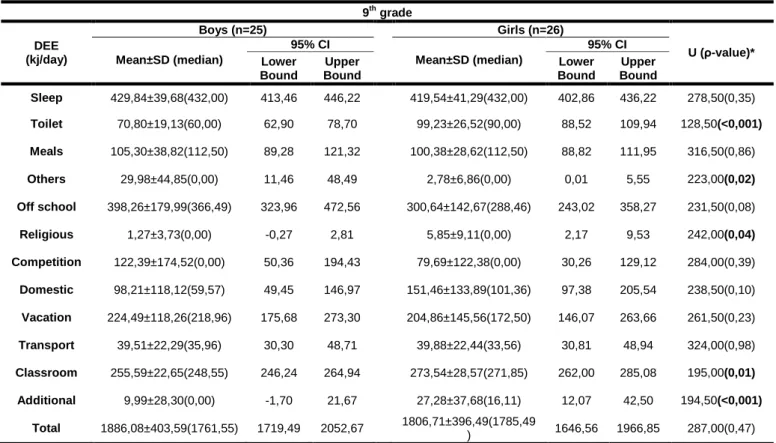
Table 13 - Physical activity (questionnaire) as mean, median, standard deviation and the corresponding 95% confidence interval of the 9th grade 38
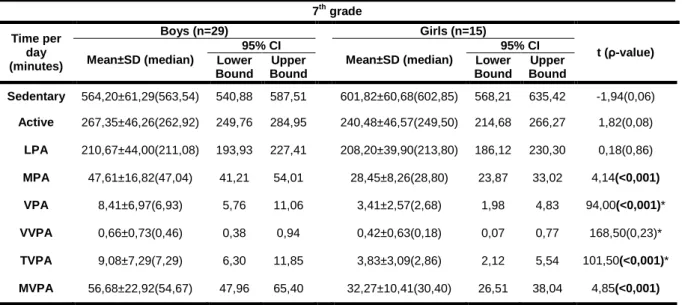
Table 14 - Physical activity (accelerometry) as mean, median, standard deviation and the corresponding 95% confidence interval of the 7th grade 40
Table 15 - Physical activity (accelerometry) as mean, median, standard deviation and the corresponding 95% confidence interval of the 8th grade 40
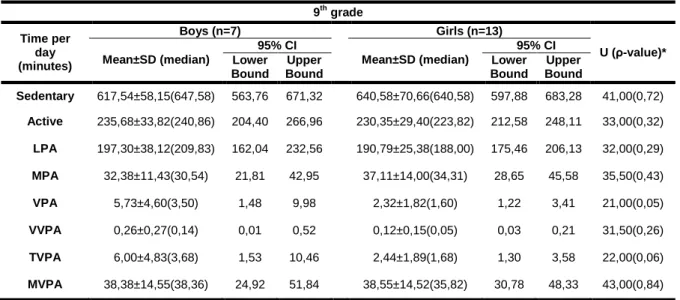
Table 16 - Physical activity (accelerometry) as mean, median, standard deviation and the corresponding 95% confidence interval of the 9th grade 41
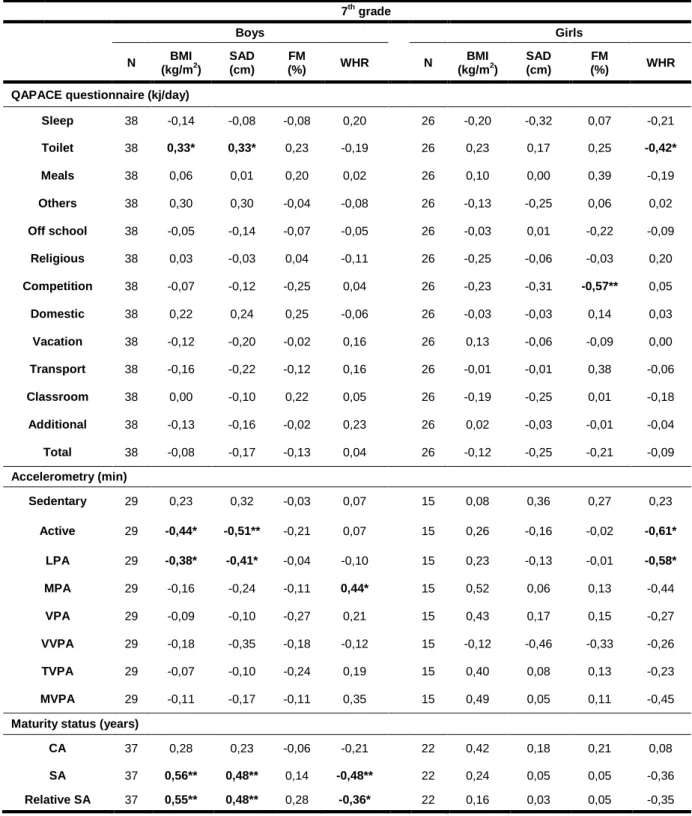
Table 17 - Spearman’s correlation coefficient between physical activity and maturity variables and body composition variables in the 7th grade 43
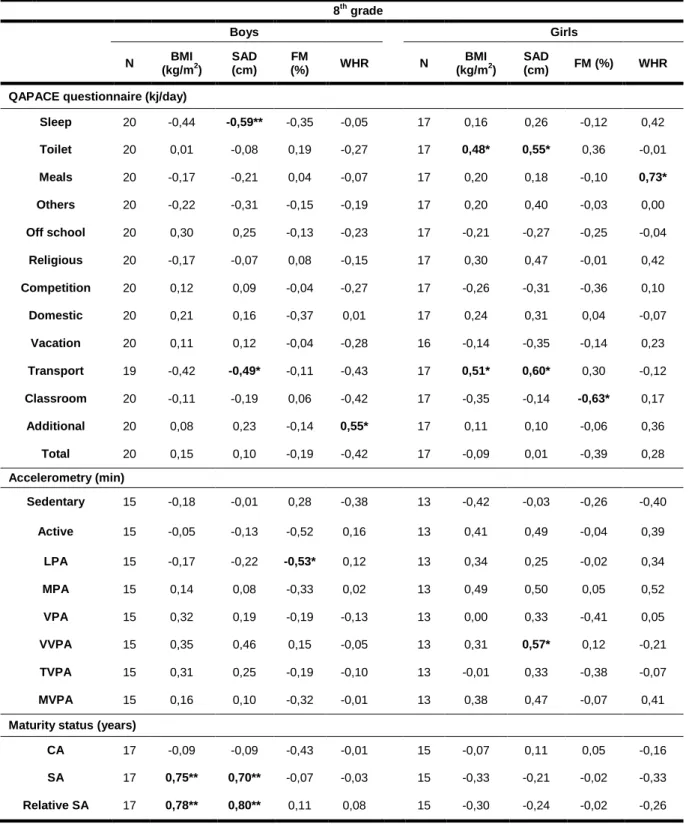
Table 18 - Spearman’s correlation coefficient between physical activity and maturity variables and body composition variables in the 8th grade 45
Table 19 - Spearman’s correlation coefficient between physical activity and maturity variables and body composition variables in the 9th grade 47
Table 20 - β coefficients from the multifactorial linear regression models between physical activity, maturity and body composition (7th grade) 49
Table 21 - β coefficients from the multifactorial linear regression models between physical activity, maturity and body composition (8th grade) 50
Abbreviations
Contributing to a less exhaustful reading, some abbreviations will be used instead of the most repeated words and as a replacement for most extensive nomenclature. Thus, abbreviations following are said abbreviations sorted by subject.
Physical activity abbreviations: DEE – Daily Energy Expenditure LPA – Light Physical Activity MPA – Moderate Physical Activity
MVPA – Moderate-to-Vigorous Physical Activity (MPA + TVPA) PA – Physical Activity
QAPACE – Quantification de l’Activité Physique en Altitude Chez les Enfants TVPA – Total Vigorous (VPA + VVPA)
VPA – Vigorous Physical Activity
VVPA – Very Vigorous Physical Activity
Body composition abbreviations: BMI – Body Mass Index
BC - Body Composition
FM – Fat Mass
SAD – Sagittal Abdominal Diameter WHR - Waist-to-Hip Ratio
Maturity level abbreviations: BA – Biologic Age
CA – Chronological Age SA - Skeletal Age
Introduction
Obesity has revealed itself as an epidemic during the XXI century, its treatment imperative and early age prevention vital. This requires a multidisciplinary approach of professionals in health and education areas, considering the influence of family, environment and socio-cultural factors.
It is recognized that physical activity has a preponderant role in body composition modifications and obesity prevention. Furthermore, most children take part in adequate amounts of physical activity however these tend to decrease from adolescence to adulthood fore both genders. Thus, this stage is an important milestone for the intervention of the above mentioned professionals in order to reduce the prevalence and incidence of overweight, obesity and the associated comorbidities, such as cardiovascular diseases and musculoskeletal disorders.
In order to understand if the Portuguese children/adolescents reach the daily recommendations of physical activity, is essential to determine their baseline levels, consequently tracing an adequate intervention plan. However, the adolescence for itself comprises several changes in somatic, hormonal and sexual systems and to understand the associations of physical activity on the adolescents’ body composition should been taking into account the maturity status.
This thesis has a cross-sectional design and was drawn to assess the associations of physical activity and maturity status on adolescents’ body composition. To attain this purpose the literature review will approach issues of the mentioned areas. For the assessment of physical activity objective and subjective methods were used, accelerometry to attain time spent in physical activity and a questionnaire to attain the daily energy expenditure. To assess body composition anthropometric measurements were used, comprising body mass index, fat mass, waist-to-hip ratio and sagittal abdominal diameter. The maturity status was assessed by skeletal age through a hand-wrist X-ray.
The results and its discussion will be presented by grade level and a comparison will be made between genders and among grades. Subsequently the study limitations as well as considerations and recommendations for future research and professional intervention will be analyzed. Finally, the conclusions will be presented, as an answer to the formulated hypotheses.
CHAPTER 1. LITERATURE REVIEW
Body composition and Obesity
The end of the past century revealed obesity as a major health issue. It is estimated that it will become one of the largest problems of the XXI century, translating into an increased risk of morbidity and mortality (Carmo, Camolas, & Vieira, 2008).
The definition of overweight and obesity is closely related to the chosen cut-off values. The Centers for Disease Control and Prevention (CDC), based on third National Health and Nutrition Examination Survey (NHANES III), and the International Obesity Task Force (IOTF) defined different BMI cut-off values for children and adolescents based on different study samples. The CDC’s study sample is solely American (Kuckmarski et al., 2000) while IOTF’s international (Cole, Belizzi, & Dietz, 2000). Furthermore, analyzing the studies on overweight/obesity of Portuguese children/adolescents, it becomes clear that Cole’s cut-off values is the main reference (Ekelund et al., 2004a; Padez, Mourão, Moreira, & Rosado, 2005; Moreira, 2007). In fact, the prevalence of overweight/obesity in Portuguese children and adolescents aged 10 to 18 is 21,6% for girls and 23,5% for boys according to the IOTF but present higher values according to the WHO (World Health Organization): 32,7% for girls and 30,7% for boys, i.e. 1/3 of Portuguese children and adolescents are at risk (Sardinha et al., 2010). A meta-analysis of Portuguese children and adolescents, ranging between two and fifteen years old, had similar results in Portugal mainland and its archipelagos (Moreira, 2007). When compared to other European countries, Portuguese children aged seven to nine years old, show higher prevalence of overweight/obesity (31,6%) (Padez et al., 2005).
Additionally, in a study sample composed by Scottish children, the prevalence of overweight was similar for both genders whereas the prevalence of obesity was higher between boys than girls (Veugelers & Fitzgerald, 2005).
Regarding this worldwide health problem and its possible causes, several issues were raised and many studies have been developed to help understand it. The primary causes of obesity in children/adolescents seem to be related to low activity levels and inadequate nutrition (Sothern & Gordon, 2003, as cited in Moreira, 2007). Padez et al. (2005) found that there was no significant difference in the time spent on Physical Activity (PA) and overweight/obesity in Portuguese children as well as mean energy intake, although the
assessment method was a parents’ questionnaire. Parental obesity, low educational level, number of siblings and sedentary behaviours (e.g.: watching TV) are some of risk factors for childhood obesity. Otherwise, sleep hours may provide a protective role in this matter (Padez et al., 2005; Veugelers et al., 2005).
The body composition changes as of obesity consequence affects the children’s growth. The obese children/adolescents reported musculoskeletal pain, particularly in lower extremities, and alterations of their structure and function (Wearing, Hennig, Byrne, Steele, & Hills, 2006; Stovitz, Pardee, Vasquez, Duval, & Schwimmer, 2008; Grau et al., 2009; Krul, Wouden, Schellevis, Suijlekom-Smit, & Koes, 2009). A study that covered the Akwesasne Mohawk people, a Native American community, concluded that environmental forces (e.g.: pollutants) might affect human growth and development, with obvious health consequences leading to leading to the problems related with overweight/obesity (Schell, Gallo, & Ravenscroft, 2009).
Veugelers & Fitzgerald (2005) verified that the participation in PA more than seven times a week was associated with a decreased risk of overweight in children. To achieve the various components of health-related fitness, school-age youth should participate daily in 60 minutes or more of moderate to vigorous PA (MVPA) (Strong et al., 2005). Baptista et al. (2011) found that only 36% of the Portuguese children (aged ten to eleven) and Portuguese adolescents (aged sixteen to seventeen) fulfilled these guidelines.
Body composition assessment
The available methods for body composition assessment include: anthropometry, densitometry (e.g.: hydrodensitometry), isotope dilution (e.g.: deuterium oxide), bioelectric (e.g.: bioelectrical impedance analyzers), potassium-40, absorptiometry (e.g.: dual X-ray absorptiometry), neutron activation and computerized axial tomography (Zemel, 2002). Therefore, each method needs to be evaluated in the context of the study, in order to choose the method that best fits its purpose.
On an anthropometric characteristics analysis a variation between genders is observable, for example Jürimäe & Jürimäe (2000) observed that before puberty the body fat is maintained in boys and slightly increases in girls. Thus, as the subcutaneous fat is higher in prepubertal girls they have higher values for skinfolds in comparison to prepubertal boys. Taylor, Jones, Williams, & Goulding (2000) reported that the waist circumference is
an anthropometric of regional fat distribution indicator better than ratios, once it is highly age dependent (Power et al., as cited in Taylor et al., 2000) and the differences in skeletal structure may confound the results (Ley et al., 1992 as cited in Taylor et al., 2000). The lower body circumferences tend to be similar between genders during prepuberty, however the trunk circumferences tend to varies between genders, since the robustness is higher in prepubertal boys than girls (Jürimäe & Jürimäe, 2000).
Physical Activity Assessment
The assessing of PA can be accomplished by subjective or/and objective methods. The subjective methods most commonly used in youth are questionnaires, activity diaries (logs), interviews and direct observation. For objective measurements, the most commonly methods used are pedometers, accelerometers and heart rate monitors (Corder, Ekelund, Steele, Wareham, & Brage, 2008).
Among the subjective methods, the interview-administered produced higher validity than the questionnaires and direct observation, but the investigators can opt to undertake questionnaires monitored by an adult to check their completion (Corder et al., 2008). For adolescents the most widely accepted questionnaires are the “Health Behaviour in Schoolchildren” from the World Health Organization (WHO-HBSC) and the “International Physical Activity Questionnaire” (IPAQ), both validated to an age range between 13 to 18 (Rangul, Holmen, Kurtze, Cuypers, & Midthjell, 2008). These authors also concluded that none of the questionnaires seems to be a valid instrument for the PA assessment in adolescents. Hereupon, another questionnaire that assesses the PA patterns in children and adolescents aged 8 to 16 years and proved to be a valid and reliable instrument is the QAPACE questionnaire (Quantification de l’Activité en Altitude chez les Enfants), that covers all the possible activities conducted by youth during the school and vacation periods (Barbosa et al., 2007).
The accuracy of the subjective methods is lower than the objective methods, as it is dependent of the ability to recall certain details retrospectively (Corder et al., 2008; Freedson, Melanson, & Sirard, 1998) and this ability is obviously lower in children/adolescents than in adults (Corder et al., 2008), thus it is crucial that the questionnaires composed by specific closed questions includes all the available PA patterns (Freedson et al., 1998).
The estimation of energy expenditure (EE) in adults based on self-reports uses the MET (metabolic equivalent) as the ratio of work metabolic rate to a standard resting metabolic rate (1 MET/4,2 kj•kg-1•h-1/1 kcal•kg-1•h-1) obtained during quiet sitting (Ridley & Olds, 2008; Ainsworth et al., 2010). On this matter, a Compendium of Physical Activities for adults (1993) was developed and posteriorly updated in 2010, aiming to facilitate the coding of physical activities obtained from subjective methods, and to promote its comparison (Ainsworth et al., 2010). The estimated METs for adults can be used (if no others evaluations available) to assign the childrens energy costs in most activities (Ridley & Olds, 2008). However the children have higher values in resting and activity EE compared to adults, which leads to an inaccuracy in the estimate of EE in children, at least up girls reaches fifteen years and boys reaches seventeen years (Harrell et al., 2003). The same author asserts that the Compendium of Physical Activities can be used in children but the corrected values must to be used when available.
Among objective methods to assess PA, the pedometers are usually used in large samples but as the output is expressed in steps per day, this method might be a potential confounder in certain types of activities. In activities as cycling or hill walking, the use of heart rate monitor can be considered, once accelerometers have lower accuracy. However, comparing with others objective methods for free-living conditions, the accelerometers have some advantages: are not invasive, have moderate dimensions, and it can assess the total daily PA, their intensity, frequency and duration, therefore is the most commonly used method to assess PA in youth (Corder et al., 2008).
The accelerometers are small devices with light weight and relatively low cost (Trost et al, 1998). These are feasible alternatives to the traditional self-report methods in moderately sized surveillance studies (Trost et al., 2002), evaluating both quantity as quality in physical activity. They also have large memory storage, and the small size it makes them particularly appealing for use in children (Freedson, Pober, & Janz, 2005).
The Computer Science Actigraph (CSA) monitors measures the movement in the vertical plane and were validated as an objective measure for assessing PA in children and adolescents (Trost et al., 1998; Freedson et al., 1998). The CSA monitors proved to be highly correlated with indirect calorimetry and exhibited a high degree inter-instrument reliability, making them a valid and reliable device for quantifying the walking and running patterns in a treadmill, in children aged ten to fourteen years old (Trost et al., 1998). The Mini-Mitter Actiwatch and the CSA monitors have proved to be valid and useful instruments for the assessment of children’s PA, given the high correlations between them
and the activity EE measured by more accurate methods (Puyau, Adolph, Vohra, & Butte, 2002).
However, before using these devices, the investigative team has to analyze some issues (Trost, Mciver, & Pate, 2005) such as: which accelerometer to choose, how many devices per child, where to place them in the body to obtain reliable values, how many days of monitoring, and the epoch length.
Analyzing the accelerometers it might be probable, at first sight, to opt for tri-axial one. Actually, these provide better evaluations, but the difference it is not so significant. A review about accelerometers validation stated that over a range of free-living activities, both uni-axial as tri-axial accelerometers provide similar information about children´s PA (Trost et al., 2005; Freedson et al., 2005). Using multiple accelerometers may slightly improve the prediction of EE during the treadmill walking and running (Trost et al., 1998) but these improvements did not exceed the burden associated of wearing multiple accelerometers (Trost et al., 1998; Trost et al., 2005).
Where to place accelerometers to reach reliable values? Placing them in the center of the body seems to be an optimal choice (Puyau et al., 2002). Typically they are worn on the wrist, lower leg or hip, where they are attached to a belt or band (Freedson et al. 2005). The hip and lower back proved to be the better choices (Trost et al., 2005) however, with CSA monitors the hip is the most suitable choice (Trost et al., 1998; Puyau et al., 2002).
Concerning the days of monitoring in children and adolescents, it requires ranges from four to nine days, being seven days a more reasonable choice (Trost et al., 2005), but the adherence to the protocol tends to decrease when increases the days of use and it is more feasible to opt for four days including one weekend day (Riddoch et al., 2004; Corder et al., 2008), with a minimum of six hundred minutes of recording per day or ten hours (Corder et al., 2008).
Due to the short duration of some activities the epoch length should be as short as possible, since data can be reintegrated into a longer timeframe but not vice versa (Corder et al., 2008) and this is especially important in prepubertal children because they typically perform intermittent activities and a one minute time interval (used in the majority of the studies) can underestimate the PA behaviours (Trost et al., 2005; Corder et al., 2008).
Self-report instruments and movement sensors are currently the more commonly used methods for the assessment of PA in epidemiological studies (Corder et al., 2008).
Physical Activity Intensities
The acknowledgment of that the PA decreases with increasing of the Chronological Age (CA) from the late childhood until adolescence in both genders and that exist differences between genders, with boys being more active than girls, are consistent with several studies to date (Mechelen, Twisk, Post, Snel, & Kemper, 2000; Trost et al., 2002; Thompson, Baxter-Jones, Mirwald, & Bailey, 2003; Riddoch et al., 2004; Ekelund, Ingve, Brage, Westerterp, & Sjöström, 2004b; Sherar, Esliger, Baxter-Jones, & Tremblay, 2007). This can be observed across all grade levels (Trost et al., 2002) and across countries (Riddoch et al., 2004). Likewise, PA assessed by VO2 showed decline with an increase in
age (Harrell et al., 2003; Baptista et al., 2011).
A study performed among Portuguese children and adolescents, aged 10 to 18 years, in which PA was evaluated by self-report method, boys showed higher values of PA than girls, however this study produced discrepant results compared with those aforementioned because the levels of PA increased with age (Seabra et al., 2008).
It is noteworthy that occurs a greater decline in PA in boys than in girls, however a closer look in the mentioned study from Mechelen et al. (2000), a longitudinal analysis that began at age 13 and ended at age 27, the decline in PA might be due to the fact that at the beginning of this study the girls were much more active than boys, providing a greater decreases in the amount and level of PA. However the effect of the gender might not be significant if the fat-free mass was considered as a co-variable (Ekelund et al., 2004a).
The PA assessed by RAPIL questionnaire (Anthropometric Re-evaluation of the Infantile Lisbon Population) revealed lowest levels of high intensity PA (less than 105 minutes) in girls than boys (Fragoso, Bronzeado, Vieira, & Barrigas, 2009). Girls spend more time in physical activities of low intensity (over 60 minutes) and has a higher daily commitment to domestic activities, while the boys spend more time in regular and non-regular PA and more frequently get involved in PA of high intensity. The total time spend on activity is similar for boys and girls (Fragoso et al., 2009).
Distinguishing the PA levels performed by children and adolescents assessed by accelerometry, it is possible to obtain some consistencies and also some discrepancies.
Relatively to sedentary behaviours, girls spend significantly more time at this level of intensity than boys and was positively correlated with the sum of five skinfold thickness
(Ekelund et al., 2004a). More than one hour per day in this intensity level was positively associated with the risk of overweight (Veugelers & Fitzgerald, 2005).
At MPA the girls showed higher results than boys (Mechelen et al., 2000), but Riddoch et al. (2004) and Rodrigues et al. (2010) obtained inverse results at this intensity level. Trost et al. (2002) did not found significantly differences between genders at this intensity level.
Independent associations were observed in the PA on body fatness variables: when body fatness was defined as BMI there was no association between PA and body fatness, suggesting that BMI may not be the best indicator in children, however when the aforementioned indicator was defined as five skinfold thickness, the Moderate-to Vigorous Physical Activity (MVPA) explained a small variation of this indicator (Ekelund et al., 2004a). Furthermore, the study location, gender and sexual maturity explained 24% of the variation in body fatness (Ekelund et al., 2004b).
The gender differences are greater in the VPA than in the MVPA (Sherar et al., 2007; Trost et al., 2002), which can be due to low participation in vigorous activities by girls (Trost et al., 2002). However, Mechelen et al. (2000) did not found gender differences at vigorous level.
For both genders, daily MVPA and VPA had an inverse relationship with grade level (Trost et al., 2002). Very Vigorous Physical Activity (VVPA) was performed by boys more than by girls until 16 years, past this age the differences did not remain (Mechelen et al., 2000).
The hours spend watching television was related to the skinfold thickness and the BMI among youth, since children who watched more television and were less likely to participate in vigorous activity tended to have a greater BMI (Andersen, Crespo, Bartlett, Cheskin, & Pratt, 1998). However it is important to highlight the fact that children who accumulated two or more hours per day, at an intensity level equivalent to walking, had significantly lower skinfold thickness than those who spent less than one hour per day at the same intensity level, suggesting that time spent in PA should be taken into consideration and not just the intensity of it (Ekelund et al., 2004b).
Growth and biological maturation
To understand the main factors that influencing development in prepubertal children is essential clarify some issues. The growth and maturation terms can be easily confounded
because both are biological activities, however they have different meanings. Growth is related to measurable changes in body composition, physique and body size, and maturation is related to somatic, endocrinological and physiological manifestations (Jürimäe & Jürimäe, 2000). Maturation and maturity has also different meanings: maturation (or biological maturation) refers to a process (relates biological time to calendar time) whereas maturity refers to a state.
However, the path to reaches the maturity varies among individuals (Mirwald, Baxter-Jones, Bailey, & Beunen, 2002). Children and adolescents with the same CA present considerable variations in biological age and the maturity individual differences affect the somatic growth, especially in adolescence (Malina, Bouchard, & Bar-Or, 2004). Thereby, since boys and girls reach maturational events at different tempos (Sherar, Baxter-Jones, & Mirwald, 2004), CA is considered a poor marker, given the disparity of characteristics among children in the same CA (Jürimäe & Jürimäe, 2000).
Maturation Assessment Methods
The assessment of biological maturation might include sexual, somatic, dental and skeletal systems (Tanner, 1962; Jürimäe & Jürimäe, 2000; Thompson et al., 2003; Malina, 2004).
To assess the sexual maturation is often used the secondary sex characteristics, in which the most commonly variables used are: pubic hair in both genders, breast development and menarche in girls, and genitals development in boys. The indicators were classified in five or six stages (Tanner, 1962). Moreover, there are others maturity indicators that can be used as: axillary hair (both genders), voice change and facial hair in boys (outward indicators) and level of sex hormones in the blood (inward indicator) (Malina et al., 2004). However, the assessment of secondary sexual characteristics is limited to pubertal phase and, in a nonclinical situation, is considered to be personally intrusive by adolescent children and their parents (Beunen et al., 1997; Mirwald et al., 2002; Malina et al., 2004).
The somatic maturity level can be assessed by growth curve for stature (if stature is available) or percentage of adult stature attained (if adult stature is available). The two main variables of the growth curve for stature were: age at takeoff (onset of the growth spurt) and age at PHV (Peak Stature Velocity). The methods used for predicting adult stature are: Bailey-Pinneau, Roche-Wainer-Thissen and Tanner-Whitehouse (Malina et
al., 2004). Furthermore, a noninvasive method was developed to predict the years from PHV by using anthropometric values, using leg length to sitting stature ratio to predict maturity status (Mirwald et al., 2002).
The dental maturity level can be assessed by X-ray, where each tooth has specific stages with a score system assigned to each stage. The indicator of dental maturity is the sum of scores.
The skeletal age (SA) assessment is considered the best maturational index, however is costly, requires specialized equipment and interpretation and incurs radiation safety issues (Beunen et al., 1997; Mirwald et al., 2002; Sherar et al., 2004; Malina et al., 2004). The left hand-wrist X-ray is the best method to assess skeletal maturity and determine biological age, because this area contains multiple bones and it’s able to characterize the skeleton maturation as a whole (Jürimäe & Jürimäe, 2000; Malina et al., 2004).
The three methods commonly used for the assessment of skeletal maturity of the left hand-wrist X-ray are: Greulich-Pyle, Tanner-Whitehouse and Fels methods (Malina et al., 2004). The methods differ in criteria for making assessments and in procedures to construct a scale of skeletal maturity (Malina et al., 2004), however the Tanner-Whitehouse method (TW3) is currently the most widely accept (Tanner, Healy, Goldstein, & Cameron, 2001). This method was revised and underwent to some modifications, including a broader reference sample (not only British children), some changes made at the scoring system and others to the scale for converting the skeletal maturity to an SA (Malina et al., 2004). The TW3 method assesses the seven carpal bones (excluding pisiform) and thirteen long bones (radius, ulna, metacarpals and phalanges of the first, third and fifth digits). A specific point score is assigned to each bone and the scores are summed to give a skeletal maturity score, which ranges 0 (immaturity) to 1 (maturity) (Malina et al., 2004). Thereafter, the SA is expressed relative to the CA, i.e., the difference between SA and CA provides how much the children/adolescent is advanced (early) or delayed (late) (Malina et al., 2004) and to avoid misunderstandings this difference can be defined as relative SA . Thus, if the relative SA is delayed by more than a year from the CA the children are classified as late maturers and if is advanced by more than one year the children is classified as early maturers (Jürimäe & Jürimäe, 2000; Malina et al., 2004).
In subjects with early maturity levels, the growth spurt occurs earlier, meaning that during a period of approximately two years, these subjects become disproportionate (short trunk and long limbs) and have generalized hypotonic and the muscles do not follow the skeletal growth (Vieira & Fragoso, 2006) and it should be pointed out that the
children/adolescents that are considered early matures have advantage in motor abilities during prepubertal years comparing with their pears late matures, however this difference vanishes in later years (Jürimäe & Jürimäe, 2000).
The percentage of adult stature calculated with Tanner-Whithouse method is an efficient maturity indicator and can be used in a variety of settings as a noninvasive substitute for skeletal maturation (Beunen et al., 1997). Sherar et al. (2004) suggest that considering the gender differences in timing and tempo during adolescence, the secondary sex characteristics was an inappropriate assessment for gender comparisons whilst assessment of somatic maturation is more feasible (e.g. age at PHV).
In summary, the variables of skeletal, sexual and somatic maturity are positively related to each other, but dental maturity tends to proceed independently (Jürimäe & Jürimäe, 2000; Malina et al., 2004).
Physical Activity and Maturation
The adolescents experience dramatic physiological changes which probably influence the participation in PA (Erlandson et al., 2011). Thus, some authors support the idea that all studies on adolescents require control for the confounding effects of maturation (Mirwald et al., 2002; Cumming, Standage, Gillison, & Malina, 2008). Aligning PA data by biological age in adolescence improve the PA tracking, especially in girls (Erlandson et al., 2011).
As aforementioned (in physical activity levels and body composition), the PA levels in children and adolescents decrease with the increasing CA and when aligned on biological age the results remains, being significant and negatively correlated with PA (Thompson et al., 2003). As in matter of fact the maturation is positively correlated with sedentary behaviour and negatively correlated with PA (Rodrigues et al., 2010) and also has been found that the exercise during early pubertal years has the greatest impact on bone accrual in girls (Völgyi et al., 2010).
An interesting finding is that children and adolescents (Estonian and Swedish sample) that sleep more than ten hours spend more time on PA (all intensities) and less time on sedentary activities than those that sleep fewer hours, however when adjusted for age and sexual maturation (Tanner stages) these associations have become non-significant (Ortega et al., 2011).
In a review across biological maturation and PA in adolescents found no differences in self-report PA among girls early, average and late maturers, similar results are accomplished between pedometers steps and maturity status and between accelerometers and breast development (Sherar, Cumming, Eisemann, Baxter-Jones, & Malina, 2010). Similarly, the participation in MVPA by girls early and late maturers did not show any differences. Early maturers girls’ in the 7th grade reported more time in
sedentary behaviours than late maturers girls, which is not seen in the 8th, 9th and 10th grades. Some authors found no association between maturity status and the self-reported VPA, while others found that early matures girls participated in less MVPA and VPA (Sherar et al., 2010). PA per day (assessed by pedometry) did not differ among boys early, average and late maturers. Self-report PA was inversely related to the time spent in MVPA and was not correlated to biological age (assessed by pubertal development). The early matures boys were associated with higher levels of self-reported VPA and also with higher levels of sedentary behaviours than the late maturers (Sherar et al., 2010).
It should also be taken into consideration the confounding effects of biological age to fully understand the gender disparities in PA, because these differences can be due to the early maturation of the girls, i.e, on average girls mature earlier than boys and when comparing PA levels between genders for the same CA, the PA levels in girls presents a higher overthrow (Sherar et al., 2007). In this matter some authors found that the significant gender disparities observed with CA were eliminated when the data were aligned with the biological age (Thompson et al., 2003; Rodrigues et al., 2010).
Analysing the light forms of PA the difference between genders is not very pronounced, what can be explained by the increased on average daily time spent in sedentary behaviours in both genders (Sherar et al., 2007; Rodrigues et al., 2010), although girls spend significantly more time in sedentary behaviours than boys, especially on weekdays (Rodrigues et al., 2010). Somatic maturation (assessed by the percentage of estimated adult stature) explained 5% of the variance in sedentary behaviours in boys and CA and the body mass explained 12% of the variance in sedentary behaviours in girls. Somatic maturation and CA explained 8% of the variance in LPA in boys however for girls any of the chosen variables explained the variance in LPA (Rodrigues et al., 2010).
Furthermore, looking to the time spent in MVPA a decrease is noted in adolescents with the increase on age in both genders and between genders the boys spent more time in MVPA than girls (as above stated in physical activity levels and body composition), although nearly all of these studies have not considered the maturity status, and if aligned
with biological age the sex differences in time spent in MVPA can disappears (Sherar et al., 2007), however Rodrigues et al. (2010) found that the CA and somatic maturation explained 30% of the MVPA in boys and the CA and body mass explained 20% of the MVPA in girls.
Analysing the maturity difference between genders on PA (assessed by questionnaire) has been proved that maturity only influences the variability of domestic activities (Fragoso et al., 2009) and the anthropometric variables are dependent on the maturity level however PA (with exception of the domestic activities and the sedentary behaviours) appears to be independent of the maturational variability (Fragoso et al., 2009).
In summary, biological maturation refers to a process with differences in timing and tempo and may contribute to the gender disparities in PA behaviors, however it is likely that this process in combination with social, psychosocial, physical and physiological changes underlie the observations rather than the maturity status per si (Rodrigues et al., 2010). The inconsistent findings between maturation and PA may be due to the assessment methods selected for both (Sherar et al., 2010).
PA and Maturation effects on Body Composition
Is expectable that PA improve the morphological characteristics in children and also contributes to a normal growth and development. Investigation to date shows that the amount of MVPA is a significant predictor of aerobic fitness in prepubertal children (Jürimäe & Jürimäe, 2000), however the interaction among anthropometric variables, PA and maturation needs a further look.
The central feature of human puberty is the maturation of the primary reproductive endocrine axis, comprising three parts: hypothalamus, pituitary gland and gonad, usually called HPG axis. This produced many modifications in individuals, namely on body composition. Significant changes in body composition occur during puberty in both genders, with boys increasing in free-fat mass percentage and girls in fat mass (FM) percentage, which is consequence of increased production of gonadal steroids. As in matter of fact the increase in gonadal estrogen production in girls leading to increases in FM percentage after menarche (Ellison, 2002). A longitudinal analysis found significant increases in FM in girls during the first year after menarche, pointing for the fact that puberty is of influence on FM (Vink et al., 2010).
In boys the increases in muscle mass that accompany puberty is due to the anabolic effects of gonadal testosterone (Ellison, 2002). A longitudinal analysis in the role of PA in the free-fat mass with maturation status controlled (Baxter-Jones, Eisenmann, Mirwald, Faulkner, & Bailey, 2008) concludes that the muscle development is driven in part by PA, however this increase is higher in boys than girls. Furthermore, positive associations (only for the lower body) were found between VPA and muscular strength on adolescent boys but not in girls, controlling for age, maturation status and free-fat mass (Moliner-Urdiales et al., 2010).
CHAPTER 2. OBJECTIVES AND HYPOTHESES
The present thesis presents a cross-sectional study designed with the main purpose of analyse the effects of maturation and PA, assessed through subjective and objective methods, on adolescents’ body composition between 12 and 16 years old.
2.1. General objective
Establish the associations of the PA in the adolescents' body composition, controlling for the maturation status.
2.2. Specific objectives
To compare the maturity status, between boys and girls, stratified by grade level;
To compare the body composition between boys and girls, stratified by grade level;
To compare the Daily Energy Expenditure (DEE) in PA, assessed by questionnaire, between boys and girls, stratified by grade level;
To compare the time spent in PA, assessed by accelerometry, between boys and girls, stratified by grade level;
Identify the associations between the body composition variables and the DEE and time spent in PA controlling for the maturity status.
2.3. Hypotheses
The maturity status is highest in the girls when compared to boys across all the grade levels;
The body composition variables are highest in girls compared to boys across all the grade levels, with the exception of the waist-to-hip ratio;
The PA levels are higher in the boys than in girls, irrespective of grade level;
The PA levels decreases with increasing age for both genders;
Adolescents with higher values of total PA are prone to lower values in the body composition variable in both genders;
Adolescents with higher values of MVPA are prone to lower values in the body composition variable in both genders;
Adolescents with an advance in maturity status present higher values in the body composition variable;
CHAPTER 3. METHODS AND PROCEDURES
3.1. Study design
A cross sectional survey was conducted involving two public schools in Lisbon’s surrounding area: Miraflores Secondary School and José Augusto Lucas Secondary School.
This study was approved by the scientific council of Faculty of Human Kinetics and by both school directors and physical education department’s coordinators.
Thereafter was scheduled a meeting with the physical education department’s coordinator and the subjects’ parents, where objectives of the study and their methodology were presented. The informed consents were distributed to parents (see appendix 1) and the study began after the commitments had been given.
Following will be described the variables operationalization and the study phases.
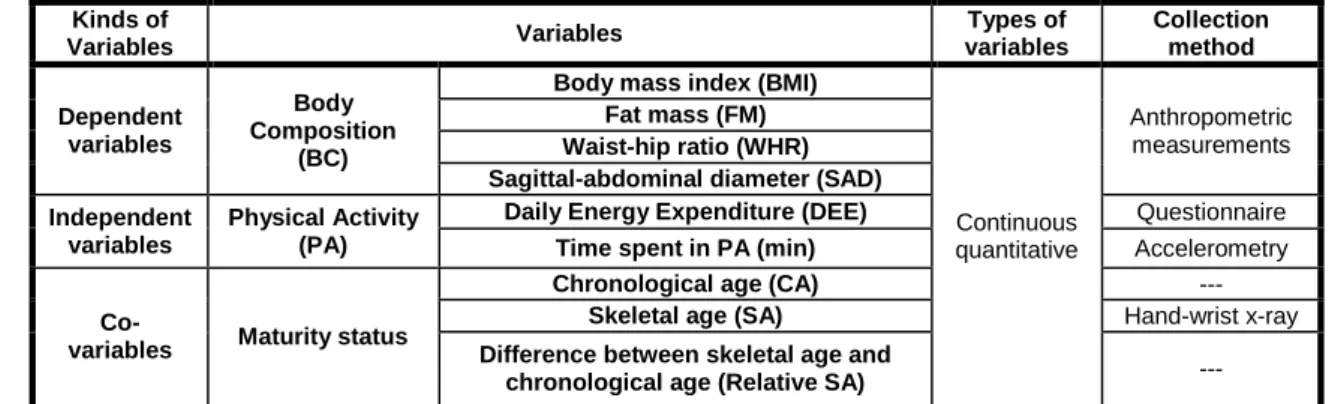
3.1.1. Variables operationalization
The variables were grouped by subject as described below:
Maturity status - Chronological Age (CA), Skeletal Age (SA), Difference between Skeletal Age and Chronological Age (Relative SA); it is important to highlight the fact that CA is not a maturity indicator, nevertheless it will be placed in this group once that it was used to estimate the SA value.
Body Composition (BC) - Body Mass Index (BMI), Fat Mass (FM), Sagittal-Abdominal Diameter (SAD), Waist-Hip Ratio (WHR).
Physical Activity (PA) - assessed per questionnaire (thirteen categories, total DEE) and per accelerometry [Sedentary / Active; Light Physical Activity (LPA); Moderate Physical Activity (MPA); Vigorous Physical Activity (VPA); Very Vigorous Physical Activity (VVPA); Moderate-to-Vigorous Physical Activity (MVPA); Total Vigorous Physical Activity (TVPA)].
Table 1: Operationalization plan Kinds of Variables Variables Types of variables Collection method Dependent variables Body Composition (BC)
Body mass index (BMI)
Continuous quantitative Anthropometric measurements Fat mass (FM) Waist-hip ratio (WHR) Sagittal-abdominal diameter (SAD) Independent
variables
Physical Activity (PA)
Daily Energy Expenditure (DEE) Questionnaire
Time spent in PA (min) Accelerometry
Co-variables Maturity status
Chronological age (CA) ---
Skeletal age (SA) Hand-wrist x-ray
Difference between skeletal age and
chronological age (Relative SA) ---
3.1.2. Study phases
The study took place in several stages. The first stage was the literature review, followed by the data collecting process that occurred between January and May of 2011 and constituted four phases of the study. The data processing was organized by the three following phases, and finally the outcome analysis and findings’ discussion were the last phases.
Table 2: Study phases
Study phases School year 2010/2011
Nov Dec Jan Feb Mar Apr May Jun Jul Aug Sep Oct Nov Theory background
Anthropometric data collection Questionnaire application Accelerometers application Hand-wrist x-ray’s data collection
Anthropometric data processing Questionnaire data processing Hand-wrist x-ray’s data processing
Outcome analysis Discussion and conclusions
3.2. Study sample
The study sample comprised adolescents of the secondary grade (7th, 8th and 9th grades) and the total sample comprised 180 students (stratified random sampling), including both boys and girls, mainly white and without disabilities.
3.3. Instruments and procedures
The methodology included subjective and objective measurements: anthropometric measurements, hand-wrist X-ray and PA assessment (per questionnaire and accelerometry). The instruments used in measurements and the performed procedures will be described in detail.
3.3.1. Maturity assessment methods
Two variables were used to ascertain adolescents’ maturity status: Skeletal Age (SA) and the Difference between SA and CA (Relative SA).
The SA was assessed through an X-ray of the left hand and wrist, with a portable X-ray equipment, model Ascot 110 and Kodak Min-R films. The SA was determinate through the TW3 method (Tanner et al., 2001).
The Chronological Age (CA) was used to calculate the Relative SA inasmuch this indicator expressed the difference between the SA and CA. However, CA is not considered a maturity indicator. All the obtained values were expressed in years.
3.3.2. Body composition assessment methods
The anthropometric measurements were obtained by certified anthropometrists according to the International Society for the Advancement of Kinanthropometry (ISAK) standard procedures (Marfell-Jones, Olds, Stewart, & Carter, 2006), with the exception of the
Sagittal-Abdominal Diameter (SAD). The measurements were taken on the right side of the body, at an acclimatized room, where adolescent’s privacy was guaranteed.
This stage ran during the physical education classes, where adolescents were divided in small groups, by gender. During measurements the participants wore shorts and t-shirt or top, all jewelry was removed as well as shoes, however socks were allowed.
The measurements used were: stature; body weight; skinfold thickness, namely triceps (TRI), subscapular (SBS), and medial calf (CALF); waist and hip girths; and sagittal-abdominal diameter.
Anthropometric variables were obtained using the DKSH (previous Siber-Hegner GPM) Kit; a Rosscraft measurement tape; a Slimguide skinfold caliper; and a Seca Vogel & Halke Balance, model 761 7019009.
The body composition variable was composed by the following variables:
1- Fat Mass (%), estimated through the Slaughter et al. (1988):
% FM = 0.735 (TRI + CALF) + 1.0 (boys)
% FM = 0.610 (TRI + SBS) + 5.1 (girls);
2- Sagittal-Abdominal Diameter (cm), that is the distance between the abdomen and the back, measured in the standing position at the iliacrest level at the end of normal expiration;
3- Body Mass Index: BMI (kg/m2) = weight (kg) / stature (m2);
4- Waist to Hip Ratio: WHR = waist girth (cm) / hip girth (cm).
3.3.3. PA assessment methods
3.3.3.1. QAPACE questionnaire
The selected questionnaire to assess PA is named QAPACE - Quantification de l’Activité Physique en Altitude Chez les Enfants, and was recently designed and validated for a range of ages between 8 and 16 years old (Barbosa et al., 2007). This questionnaire was developed in English language and aims to quantify the levels of PA covering all the daily activities within school and vacation periods. The questionnaire is composed by closed
answers, for data accuracy purposes given the range of ages. Another advantage of this questionnaire is a detailed characterization of each activity in terms of type, duration and frequency, allowing the definition of PA patterns.
The questionnaire used resulted from an adaptation for the cultural and Portuguese language (see appendix 2) and remains in validation process, thereby this process will not be presented in this document once it doesn’t match the study purpose. Furthermore, in order to properly organize the outcome analysis the categories were organized as following describes:
Category 1 – Sleep
Category 2 – Toilet
Category 3 – Meals
Category 4 - Others activities
Category 5 – Off school activities
Category 6 – Religious activities
Category 7 – Competition sports
Category 8 – Domestic activities
Category 9 – Vacation activities
Category 10 – Transportation
Category 11 – Classroom and homework
Category 12 – Mandatory physical education (PE)
Category 13 – Musical instrument, study center, scouts
(additional)
As aforementioned the questionnaire is in validation process, some items were organized to achieve this goal. The DEE calculations in the category 5 did not include all the questions presented in the questionnaire, once they have been considered in further categories. The category 11 was estimated by the summing of the total time spent in homework (presented in the category 5) and the time in classroom (presented in the schedule). The category 12 was calculated taking into account the total time of physical education classes (presented in the schedule) and the category 13 was the sum of the
Daily Activities
Additional items of the category 5 Activities performed during school period
(Schedule) School activities
Activities performed during vacation period
items (described above) that have been added to the category 5. Therefore, the categories 11, 12 and 13 do not appear in the questionnaire.
The questionnaire was self-administered, however the questions were read out loud by two team researchers that have oversaw the entire process. Their presence aimed to clarify questions, which minimized biases. The time needed to fulfill the questionnaire was 30 minutes, which it is the recommended for not exceed the mental concentration capacity of the children/adolescents (Barbosa et al., 2007). The DEE was measured summing the total of METs spent in each activity item of the questionnaire (Ainsworth et al., 2010).
3.3.3.2. Accelerometry
The PA was objectively assessed using a uniaxial accelerometer, Actigraph (GTM1 model, Fort Walton Beach, FL, USA) (Trost et al., 1998; Freedson et al., 1998), with the following dimensions: 5,3x5,1x2,2 cm. The accelerometers were initialized as described by the manufacturer (with the ActiLife Lifestyle software, version 3.2) and were distributed and collected face-to-face by the investigation team. The adolescents were instructed to use them on right hip (as close as possible to the body’s center of mass) (Puyau et al., 2002) and the PA was monitored continuously for seven consecutive days (Trost et al., 2005).
The accelerometers are not water resistant, hence it have to be removed during all aquatic activities (e.g. bathing, swimming), and also during sleep. For data accuracy and to provide information about the physical activity performed (or any other information), while the monitor was not worn, they had to register simultaneously in the non-wear activity diary, the time at which the accelerometer it was placed and removed during the seven days. After that week the accelerometers were collected and data were downloaded for a computer with the ActiLife Fifestyle software, and the Mahuffe program was used for the data analysis.
The data were considered to be valid if the adolescents had accelerometer counts for at least three weekdays, minimum of ten hours of recording (including one day in the weekend with eight hours of recording) (Trost et al., 2005; Riddoch et al., 2004; Corder et al., 2008), giving a total of 600 minutes per day. Data were saved in 15-s epoch in accordance with some authors (Trost et al., 2005; Corder et al., 2008), which corresponds
to the time interval that the accelerometer has collected information (each 15 seconds). Consecutive values of zero that lasted sixty minutes were considered as non-wearing.
The Freedson prediction equation of energy expenditure, validated in children and adolescents aged 6 to 18 years old, was used to estimate Metabolic Equivalent (METs) from the count values: MET = 2.757 + (0.0015·count·min-1) - (0.08957·age(yr)) - (0.000038·counts·min-1·age(yr)), as cited in Trost et al. (2002).
3.4. Statistical Analysis
Data were analyzed with SPSS version 18.0 (SPSS Inc., an IBM Company, Chicago). Data treatment was performed by descriptive analysis for all the variables, initially performed by absolute and relative frequencies of each group of variables and later through central tendency for each variable. The results were presented by gender and grade level, showing the mean, median and both lower and upper boundaries of a 95% confidence interval. The Shapiro-Wilk test and the Levene’s test were performed in order to ensure parametric characteristics (n<50). To compare average values was performed t-student test for parametric variables and, in alternative, Mann-Whitney and Wilcoxon test for non-parametric variables. The Spearman’s correlation coefficient was performed between the PA and maturity variables with the body composition variables. For all tests statistical significance was set at ρ<0,05.
Multifactorial linear regression models were subsequently performed to predict the value of a dependent variable (or outcome) from an independent set of variables (or predictors) (Maroco, 2010), controlling for the maturity. Stepwise method was applied for association tests, since it is the most appropriate when there are significant correlations between independent variables (Maroco, 2010). Thus, four regression model equations were developed, stratified by gender and grade level. Adjusted r2 was used to define the model adjustment quality.
CHAPTER 4. RESULTS
The sample comprised 180 adolescents, with distinct frequencies for each group of variables (valid data). Therefore, sample description is displayed in two different tables, illustrating the absolute and relative frequencies (n, %). Is presented firstly is the general sample description, stratified by gender and grade level (Table 3) followed by the group variables description (Table 4).
Table 3: Sample general description by gender and grade level
7th grade 8th grade 9th grade Total
N % n % n % n %
Boys 43 23,9 29 16,1 25 13,9 97 53,9
Girls 32 17,8 25 13,9 26 14,4 83 46,1
Total 75 41,7 54 30 51 28,3 180 100%
Table 4: Group variables description by gender and grade level (valid data)
7th grade 8th grade 9th grade
Total Boys Girls Boys Girls Boys Girls
n % N % n % n % N % n % n % Maturity status 37 86 22 68,8 17 58,6 15 60 9 36 13 50 113 62,8
Body composition 38 88,4 26 81,3 20 69 17 68 15 60 21 80,8 137 76,1
PA per questionnaire 43 100 32 100 29 100 25 100 25 100 26 100 176 100
PA per accelerometry 29 67,4 15 46,9 15 51,7 16 64 7 28 13 50 95 52,8
The sample comprised 75 students of the 7th grade (41,7%), 54 students of the 8th grade (30%) and 51 students of the 9th grade (28,3%), in a total of 180 adolescents of both genders. The average age of 7th grade students was 12,8 years, of 8th grade students was 13,8 years and of 9th grade students was 14,7 years. The percentage values showed a higher discrepancy between genders in students of the 7th grade (14,6% difference for boys), although this difference decreased in the following grades, presenting similar values in students of the 9th grade (49% of boys and 51% of girls) (table 3).
Analyzing each group of variables, it is noted that PA by questionnaire registered 100% of valid data (table 4), i.e., 51 out of 51 students of the 9th grade filled the PA questionnaire (table 3). The body composition variable showed 76,1% of valid data, followed by maturity status with a 62,8% value, finally the PA per accelerometry showed a 52,8% frequency.
4.1. Maturity variables characterization
Descriptive data of maturity status variables will be summarized next, stratified by gender and grade level. It should be pointed out that, despite the CA not being a maturity indicator, it will be included in the maturity group, thus simplifying the outcome analyses. These analyses will be presented per group of variables.
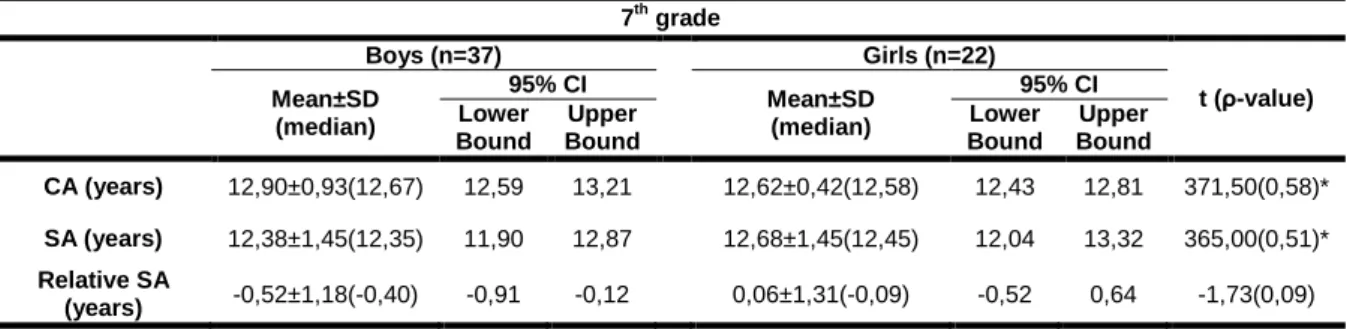
Table 5: Maturity variables as mean, median, standard deviation and the corresponding 95% CI of the 7th grade 7th grade Boys (n=37) Girls (n=22) t (ρ-value) Mean±SD (median) 95% CI Mean±SD (median) 95% CI Lower Bound Upper Bound Lower Bound Upper Bound CA (years) 12,90±0,93(12,67) 12,59 13,21 12,62±0,42(12,58) 12,43 12,81 371,50(0,58)* SA (years) 12,38±1,45(12,35) 11,90 12,87 12,68±1,45(12,45) 12,04 13,32 365,00(0,51)* Relative SA (years) -0,52±1,18(-0,40) -0,91 -0,12 0,06±1,31(-0,09) -0,52 0,64 -1,73(0,09) * Mann-Whitney test performed
Abbreviations: CA – Chronological Age; SA – Skeletal Age; Relative SA - Difference between SA and CA; SD – Standard Deviation; CI – Confidence Interval
Table 6: Maturity variables as mean, median, standard deviation and the corresponding 95% CI of the 8th grade 8th grade Boys (n=17) Girls (n=15) U (ρ-value)* Mean±SD (median) 95% CI Mean±SD (median) 95% CI Lower Bound Upper Bound Lower Bound Upper Bound CA (years) 13,74±0,62(13,50) 13,41 14,06 13,89±0,63(13,92) 13,55 14,24 101,00(0,32) SA (years) 12,62±1,75(12,96) 11,72 13,52 15,05±1,31(16,00) 14,33 15,78 32,50(<0,01) Relative SA (years) -1,11±1,72(-0,85) -2,00 -0,23 1,16±1,07(1,50) 0,57 1,75 31,00(<0,01) * Mann-Whitney test performed
Abbreviations: CA – Chronological Age; SA – Skeletal Age; Relative SA - Difference between SA and CA; SD – Standard Deviation; CI – Confidence Interval
Table 7: Maturity variables as mean, median, standard deviation and the corresponding 95% CI of the 9th grade 9th grade Boys (n=9) Girls (n=13) U (ρ-value)* Mean±SD (median) 95% CI Mean±SD (median) 95% CI Lower Bound Upper Bound Lower Bound Upper Bound CA (years) 14,76±0,78(14,50) 14,16 15,36 14,68±0,52(14,58) 14,37 14,99 51,50(0,64) SA (years) 14,94±1,18(14,81) 14,03 15,85 15,82±0,56(16,00) 15,48 16,16 37,00(0,13) Relative SA (years) 0,18±1,37(0,22) -0,88 1,24 1,14±0,70(1,42) 0,72 1,57 35,00(0,12) * Mann-Whitney test performed
Abbreviations: CA – Chronological Age; SA – Skeletal Age; Relative SA: Difference between SA and CA; SD – Standard Deviation; CI – Confidence Interval
Boys from the 7th and 9th grades registered higher average CA values than girls (tables 5,7) and girls from the 8th grade registered the highest value for the aforementioned indicator (table 6).
Average SA values were lower in boys across all grade levels (tables 5,6,7), although gender differences only showed statistical significance in the 8th grade (12,62 years vs 15,05 years, p<0,01). Similar results were obtained for the Relative SA indicator (tables 5,6,7), i.e., boys showed a delay in maturity status in comparison to girls and these differences were also statistically significant only for the 8th grade only (-1,11 years vs 1,16 years, p <0,01) (table 6). On a maturity status analysis it should be highlighted that both 7th grade boys and girls of the 7th grade revealed a maturity status within the normal range, as the Relative SA indicator showed a difference lower than one year (-0,52 years vs 0,06 years) (table 5). The 8th grade boys revealed a delayed maturity status, while girls showed an advanced maturity status (-1,11 years vs 1,16 years) (table 6), andin the 9th grade the boys presented a normal maturity status and girls an advanced maturity (0,18 years vs 1,14 years) (table 7).
4.2. Body composition variables characterization
Descriptive data of body composition variables will be summarized next, stratified by gender and grade level.
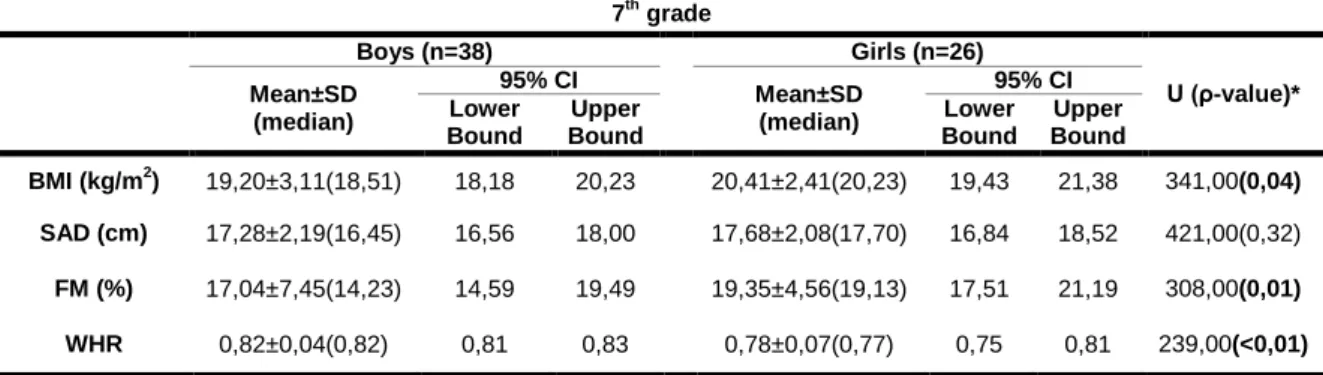
Table 8: BC variables as mean, median, standard deviation and the corresponding 95% CI of the 7th grade 7th grade Boys (n=38) Girls (n=26) U (ρ-value)* Mean±SD (median) 95% CI Mean±SD (median) 95% CI Lower Bound Upper Bound Lower Bound Upper Bound BMI (kg/m2) 19,20±3,11(18,51) 18,18 20,23 20,41±2,41(20,23) 19,43 21,38 341,00(0,04) SAD (cm) 17,28±2,19(16,45) 16,56 18,00 17,68±2,08(17,70) 16,84 18,52 421,00(0,32) FM (%) 17,04±7,45(14,23) 14,59 19,49 19,35±4,56(19,13) 17,51 21,19 308,00(0,01) WHR 0,82±0,04(0,82) 0,81 0,83 0,78±0,07(0,77) 0,75 0,81 239,00(<0,01)
* Mann-Whitney test performed
Abbreviations: BC – Body Composition; BMI – Body Mass Index; SAD – Sagittal Abdominal Diameter; FM – Fat Mass; WHR – Waist-to-Hip Ratio; SD – Standard Deviation; CI – Confidence Interval