Vol.59: e16160544, January-December 2016 http://dx.doi.org/10.1590/1678-4324-2016160544
ISSN 1678-4324 Online Edition
BRAZILIAN ARCHIVES OF BIOLOGY AND TECHNOLOGY
A N I N T E R N A T I O N A L J O U R N A L
Experimental Study on the Changing Rules of Coal Fire
Indictor Gases of the Whole Combustion Phases in Confined
Space
Baiwei Lei
1*
;
Bing Wu¹; Xuyang Wang¹.
¹Faculty of Resources and Safety Engineering, China University of Mining & Technology (Beijing), PR China
ABSTRACT
When the coal mine fire occurs, it is crucial to judge the fire combustion state by analyzing indicator gases concentration and changing trends of various gas ratios in order to formulate proper rescue measures. It’s an effective methodology to estimate the changes of combustion state in coal mine fire accurately by the trends analysis of indicator gases and gas ratios independent of the external environment disturbs, such as air leakage and inner gases injection. However, there are few experimental researches about the changing rules of indicator gases and gas ratios at different combustion phases at present. Therefore, this paper has established a small-sized coal combustion experimental platform in confined space, on which the experimental studies on variation trends about indicator gases and gas ratios of the whole combustion phases are conducted. The experiment results have shown that the coal combustion trends could be accurately estimated by analyzing the relationship between indicator gases and gas ratios among different combustion phases. In the end of this paper, the conclusions are verified by a real coal mine fire disaster relief case, and the practical results are in agreement with the experimental analysis.
Key word:coal combustion , indicator gases, gas ratios, trend analysis
*
Authors for correspondence: [email protected]
INTRODUCTION
Coal mine fire is one of the major threating disasters for mine safety management. Coal mine fire often induce occurrence of gas or dust explosion which cause the expansion of disaster. Therefore, the coal mine fire disaster relief is widely recognized as the most difficult and dangerous work in coal disaster rescuing. For example, spontaneous combustion occurred in the goaf of Babao coal mine, Jilin, 2013. The gas explosion occurred in the disaster relief process while 36 rescue workers were killed and 12 injured (Yan, 2013).
The formulation of mine fire disaster relief measures are on the basis of the analysis of fire combustion state. Therefore, it is the key factor for mine fire rescue to study on how to correctly analyze the fire combustion state. At present, the thermometric method and gas analysis method are mainly used to judge the combustion status of coal mine fire. Since the principle that temperature transmission is negatively related to the propagation distance and the observation field of measuring points is limited, it is difficult to obtain the entire combustion condition in fire area. Therefore, it is not accurate to judge fire combustion state merely by the changes of temperature. On the other hand, assume there is litter external influences roadway space and combustion gas products will not change with the increasing of distance, the gaseous products produced by mine fire in different combustion phases would show a certain regularity (including gas composition, contents, etc.). Therefore, compared with temperature the changes of gaseous products composition and concentration can reflect the fire status more effectively.
Gas analysis methods are generally divided into two categories: one is that directly estimate the combustion state in fire zone by analyzing concentration and the changing trends to some indictor gases (like CO, CO2, O2, etc.); another
deduces the combustion state by making analysis of the change characteristics of gas components (like increase rate, etc.) or the change rules among gas components (like ratio, etc.), such as Kuchta (Kuchta, J.M.,1982) put forward the method of using CO/CO2 to evaluate fire combustion state,
British scholar Graham(Graham,1921) introduced parameters △O2 and Graham's Ratio, its
corresponding composite index, to evaluate the fire developing status, India scholar Ghosh and Banerjee (Ghosh,1967) presented the method to use C/H index to judge combustion intensity. America scholar Ann G. Kim (Ann G.Kim,2004) proposed to apply hydrocarbon index to judge the developing trend of coal spontaneous combustion state. Yuan S J (Yuan S J,2006) explored fire-characteristic-curve method to judge the developing trend of the fire in closed fire zone. Currently, temperature-programmed experiments and the tunnel simulation experiments are most commonly used to study the variation of indicator gases. Among them, many scholars, such as the American scholar J.B. Stott(JB Stott,1987) New Zealand researcher X.D. Cheng(X.D.Chen,1997), Turkish scholar Fehmi (Fehmi Akgün,1994), and research team from Xi'an University of science and technology (Zhong Xiaoxing , 2009)had established successively the coal spontaneous combustion platform for the simulator investigation of coal spontaneous combustion process. K. Baris (K. Baris,2012) had conducted experiments for the 125g coal sample in 40, 60 and 90 degree Celsius respectively. China University of Mining and Technology (Zhong Xiaoxing,2009, Zhou Fubao, 2010) had also developed a small-sized programmed temperature experiment device to measure the coal samples under adiabatic conditions in order to understand the release regularity of indicator gases in different combustion phases. At the same time, researchers of United States, Britain, China, Japan and others had also studied the variation rules of t indictor gases through tunnel fire experiments (Kuchta J.,1982, Zhou, X,1996).
All the study results of indictor gases above have great reference significance for preventing coal spontaneous combustion and judging the combustion state, but they still have some problems to be solved. The flame combustion and smoldering stage combustion stage are not divided clearly in the whole experimental process, and due to the development limitation for testing instruments, there is no practices of continuous monitoring for the indictor gases of fire disaster yet. When the coal mine fire hazard occurs, rescuers often injected inert gas (N2 or CO2) into
experts all over world agree that the variation trends analysis of indicator gases should be used to analyze the combustion state, but there is very few researches on the changing tendencies rules of different indicator gases. Therefore, to solve those problems, this thesis has explored to build a coal combustion experiment platform in confined space, and a set of on-line continuous gas analyzers, cameras, thermocouple are applied to monitor and analyze the gas generation, flame surface area and coal temperature in real-time to study the variation trends about indicator gases and gas ratios in different combustion phase, which provides theoretical references to judge the coal mining fire combustion state for fire disaster reliefs.
EXPERIMENTAL METHOD
Testing system design
Since the mine fire belongs to the confined space fire, the characteristic parameters of its combustion process are distinguished from that in open space. Therefore, the experiment needs to be designed as a coal combustion experiment in the confined space. In order to shorten the experimental time, a heating rod is adopted to preheat the coal sample, then use the ignition rod to ignite the coal sample. When the flame occurs, cut off the power for heating rod while maintain the normal operation for other systems so as to make the coal independent burning by self-heating, by which the research on variation rules for indicator gases at different coal combustion phases is conducted.
At present, there exists two types of gas concentration measuring methods for coal mine fire, the sampling measurement and on-line measurement. Gas chromatograph is commonly used for the sampling measurement analysis, this method measures many kinds of gases with high accuracy, but the time it takes for analyzing a group of sample gases is relatively longer, usually as long as ten minutes or more. The on-line gas analyzer is generally used to measure the concentrations of CO2, CH4, O2 and CO by infrared analysis and electrochemical techniques. The gas ratios for spontaneous combustion judgment are based on the monitoring data about CO2, CO, O2 in all countries, and considering the time of flame combustion in small-sized experimental platform for coal combustion, which is established in this paper, is relatively shorter
(generally no more than 20 min), therefore, the on-line gas analyzer is selected in the experimental platform .
Flame characteristics is the external performance of flame combustion, the greater the flame is, the greater heat feedback and more violent combustion is, therefore, the generation rule of indicator gases at different combustion states in flame combustion period can be analyzed by the correlation between flame characteristics and indictor gases. Since the speed of heat dissipated to surrounding environment is proportional to the surface area of the flame (Philip J,2011), and
according to Orloff's ‘cylinder method’ principle (Orloff L,1981), the flame surface area isπ times to
the flame image area. Therefore, the experimental platform is designed to monitor the change of flame combustion state by flame photography in real time.
experimental device
Fig.1 shows the schematic diagram of coal combustion and extinction experiments in restricted space. The experimental system consists of the following subsystems: (1) experimental box with the burner; (2) the gas supply system; (3) temperature monitoring system; (4) the gas concentration monitoring system; (5) flame image monitoring system. The experimental box is modified by a drying oven with 550mm long, 450mm wide and 530mm high, there is a 330mm long and 230mm wide square observation window in the door, an air outlet circle with diameter of 45mm at the top of the experimental box.
Thermocouple
1 2 3 4 5 6 7 8 14
9 10
11 13
12
DV Temperature acquisition
system
PC
Float flowmeter
Desiccant Analysis
of online gas analyzer
The compressed air bottle
Figure1 - Schematic diagram of coal combustion and extinction experiments in the restricted space
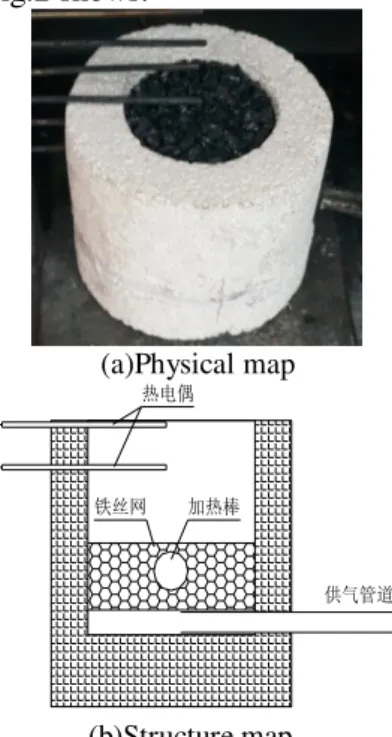
with a heating rod for coal preheating. The gas supply pipeline supplies air through the experimental box wall into the bottom of the burner as Fig.2 shows.
(a)Physical map
供气管道 加热棒
热电偶
铁丝网
(b)Structure map
Figure 2 - The burner of the experimental box
(a)Physical map
8 13
11 9
10
12
3 5 7 4 6
1 2
14
(b)Structure map
Figure 3. Schematic diagram of the temperature sensor arrangement
Thirteen sensors are arranged inside the experimental box to measure the temperature field of the box, the positions layout are shown in Fig 3. Among them, sensors No. 1~11 are K-type thermocouple, No.13 is humidity sensor, No. 14 is BMP180 temperature pressure sensor. The sensor No. 2 is arranged in the lower surface of the coal samples to measure the change of coal surface temperature. The sensor No. 1 is located 15mm under sensor No. 1, which is used to measure the internal temperature of the coal samples.
Sensors No.3 to No.7 are disposed on the central axis of the burner at 15mm intervals. The No.8 sensor is located 120mm above to the 7th at the sensor. No. 9 and 10 sensors are located 470mm to the bottom and 90mm to the left box wall. The No. 9 sensor is 120mm and the 10th sensor is 290mm to the posterior box wall. No. 11 sensor is located at the bottom of the experimental box. Arranged in the outlet is a relative humidity BMP sensor, outside the experimental box is No.12 sensor for measurement of the ambient temperature.
Gas sampling tube is positioned at the top of air outlet of the experimental box, the air concentration of mining gas production, such as O2, CH4, CO and CO2 is extracted and analyzed by
online gas analyzer through a vacuum pump. The digital camera is placed in front of the experimental observation window, which is used to record the combustion flame image in real-time.
The experimental steps
The coal sample is select from the coal mining face 3-5# coal seam in Tongxin, Shanxi Provence of China. The coal samples transported back to the lab are grinded by a jaw crusher, and then use the jaw crusher to sieve out the coal particle with size of 5~7mm. The coal industry analysis and spontaneous combustion tendency grade appraisal of the coal sample are shown in Tab.1.
Table1 -
The Industry analysis and the spontaneous combustion tendency grade appraisal
Mad(%) Ash(%) Volatile matter(%)
Sulfur( %)
True relative density
Oxygen consumption (cm3/g)
Spontaneous combustion tendency
0.4 15 37.56 0.91 1.44 0.64 Ⅱ
The experiment steps are as follows:
1. Weigh 104g coal grains by electronic scales with partial size of 5~7mm, put them in the burner,
monitoring system and gas sampling analysis system.
2. Use air compressor to supply 10L/min air into the burner, turn on the switch of heating rod, set its temperature to rise to 600℃ within 20 minutes, and then keep continuously heating for 40 minute in constant temperature.
3. Turn on the digital camera, light up the ignition rod and extend it to space above the burner though air vent. Take it out quickly after the ignition, and then turn off the heating system to ensure the coal samples combusting spontaneously.
4. After the flame is extinguished, turn off the digital camera, sustain the ventilation conditioning, temperature monitoring and gas sampling monitoring systems unchanged until the flame dies out automatically. The experiment ends when the concentration of CO drops to 100ppm.
EXPERIMENTAL
RESULTS
AND
ANALYSIS
The whole experiment process can be divided into 3 phases, preheating phase (phaseⅠ), flame combustion phase (phase Ⅱ) and non-flame phase (phase Ⅲ).
Temperature variation
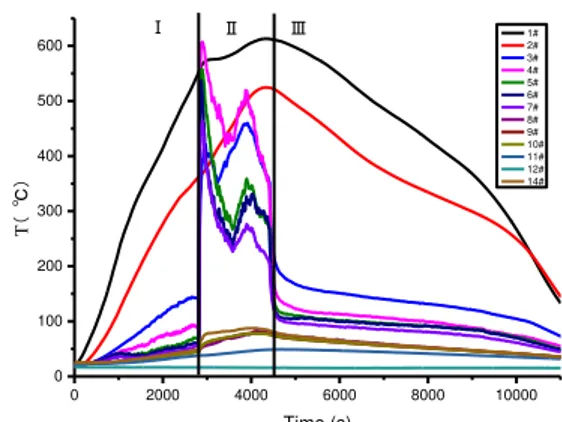
Fig.4 shows the temperature distribution diagram for the experimental box. Through analyzing Fig.4, the temperature of coal was ascending gradually under the effect of heating rod during the first phase, which leads to the temperature increase inside experiment box. During the second phase, when it comes to the coal flame combustion phase, the air temperature above the coal rises rapidly, and the coal temperature rises gradually due to the coal solid combustion and flame heat feedback, which reached the maximum at the time of flame extinguish. In the third stage, the disappearing flame makes the air temperature dropped significantly in the space above the coal, which leads to the gradual decline in temperature inside the experimental cabinet. Therefore, though experimental results, when coal combustion occurs in confined space, the temperature degradation happens very fast, the temperature fluctuation is more fierce as the distance to the flaming fire gets closer.
0 2000 4000 6000 8000 10000
0 100 200 300 400 500 600
T
(
℃)
Time (s)
1# 2# 3# 4# 5# 6# 7# 8# 9# 10# 11# 12# 14#
Ⅰ Ⅱ Ⅲ
Figure 4. Temperature distribution in experiment box
Flame Image Processing
(a) (b)
Figure 5. The flame image at 325s
In the process of image acquisition, halation phenomenon will appear if the ratio of illumination intensity of image landscape between light and dark exceeds the dynamic range of the image sensor or the human eye. Fig. 5(a) is the flame image at 325s, it can be found that there is obvious halation phenomenon in the collected images through observing Fig 5. In order to extract flame image area more accurately, we need to preprocess the collected images for eliminating background and halation interference. This paper uses Contrast Enhancement Algorithm to preprocess these images, the processing results are showed in Fig 5(b).
results of the flame superficial area changing along with time are showed in Fig. 5.
0 200 400 600 800 1000 1200 1400 1600 1800
0 100 200 300 400 500
Area
(m
m2
)
Time (s)
Figure 6. The curves of flame image area of phase Ⅱ
Fig. 6 shows the curves of flame image area in flame combustion phase (phase Ⅱ).Through Fig. 6, during the second phase the flame surface area decreases firstly, then remains stable, and finally it decreases gradually in the end. As the flame surface area represents the intensity of combustion, the reaction intensity of coal oxidation changes dramatically firstly and then tends to be stable, and finally reduces gradually.
The changes of indictor gases
0 2000 4000 6000 8000 10000
0 1000 2000 3000 4000 5000 6000
CO (p
pm
)
Time (s)
Ⅰ Ⅱ Ⅲ
0 2000 4000 6000 8000 10000
0.0 0.4 0.8 1.2 1.6
CO2 (
%)
Time (s)
Ⅰ Ⅱ Ⅲ
(a) (b)
0 2000 4000 6000 8000 10000
18.5 19.0 19.5 20.0 20.5 21.0
O2
(%)
Time (s)
Ⅰ Ⅱ Ⅲ
0 2000 4000 6000 8000 10000
0.0 0.2 0.4 0.6 0.8
CH4 (%)
Time (s)
Ⅰ Ⅱ Ⅲ
(c) (d)
Figure7. Gas concentration change curve
Fig.7 shows gas concentration change curve in the whole experimental process. By analyzing Fig. 7 (a) - (d), it can be known that coal oxidation reaction is more intense in the effect of the heating rod during the first stage of the experiment, therefore, the concentration of CH4, CO2 and CO in
the experimental box gradually increased, the concentration of O2 decreased gradually. In the second phase of the experiment, as it’s the flame
combustion period, the gas generation has changed with the intensity of coal oxidation reaction. In the early flaming combustion, the oxidation reaction of coal is more intense, and the reaction intensity turns slower in the end of the burning. Therefore, the concentration of CO2 increased gradually
through the process, and the concentration of O2
and CO firstly decreased and then increased, the
concentration of CH4 decreased gradually. In the
third stage, as the oxygen consumption decreased gradually with the decrease of coal oxidation reaction, the concentration of O2 gradually
increased, which leads to the gradual decrease in concentration of CH4 and CO2, and the
concentration of CO increased to a certain value earlier and then decreased gradually.
would not decrease since the coal amount participating in the combustion reaction is increasing.
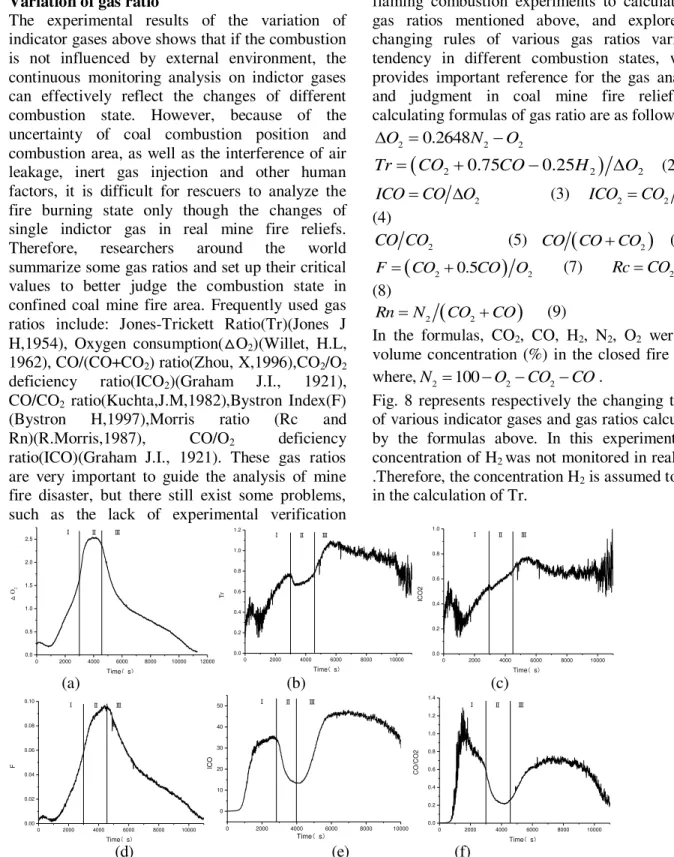
Variation of gas ratio
The experimental results of the variation of indicator gases above shows that if the combustion is not influenced by external environment, the continuous monitoring analysis on indictor gases can effectively reflect the changes of different combustion state. However, because of the uncertainty of coal combustion position and combustion area, as well as the interference of air leakage, inert gas injection and other human factors, it is difficult for rescuers to analyze the fire burning state only though the changes of single indictor gas in real mine fire reliefs. Therefore, researchers around the world summarize some gas ratios and set up their critical values to better judge the combustion state in confined coal mine fire area. Frequently used gas ratios include: Jones-Trickett Ratio(Tr)(Jones J H,1954), Oxygen consumption(△O2)(Willet, H.L,
1962), CO/(CO+CO2) ratio(Zhou, X,1996),CO2/O2
deficiency ratio(ICO2)(Graham J.I., 1921),
CO/CO2 ratio(Kuchta,J.M,1982),Bystron Index(F)
(Bystron H,1997),Morris ratio (Rc and Rn)(R.Morris,1987), CO/O2 deficiency
ratio(ICO)(Graham J.I., 1921). These gas ratios are very important to guide the analysis of mine fire disaster, but there still exist some problems, such as the lack of experimental verification
analysis about these indicator gases from a complete coal combustion cycle, and the setting of some critical values are based on the experience summary and lack in commonality. As a result, this paper uses the data collected from the coal flaming combustion experiments to calculate the gas ratios mentioned above, and explore the changing rules of various gas ratios variation tendency in different combustion states, which provides important reference for the gas analysis and judgment in coal mine fire reliefs.The calculating formulas of gas ratio are as follows:
2 0.2648 2 2
O N O
(1)
2 0.75 0.25 2
2Tr CO CO H O (2)
2
ICOCO O (3) ICO2 CO2 O2 (4)
2
CO CO (5) CO CO
CO2
(6)
2 0.5
2F CO CO O (7) RcCO CO2 (8)
2 2
RnN CO CO (9)
In the formulas, CO2, CO, H2, N2, O2 were gas
volume concentration (%) in the closed fire zone, where,N2100O2CO2CO.
Fig. 8 represents respectively the changing trends of various indicator gases and gas ratios calculated by the formulas above. In this experiment, the concentration of H2 was not monitored in real time
.Therefore, the concentration H2 is assumed to be 0
in the calculation of Tr.
0 2000 4000 6000 8000 10000 12000
0.0 0.5 1.0 1.5 2.0 2.5
△
O2
Time(s) Ⅱ
Ⅰ Ⅲ
0 2000 4000 6000 8000 10000
0.0 0.2 0.4 0.6 0.8 1.0 1.2
Tr
Time(s)
Ⅰ Ⅱ Ⅲ
0 2000 4000 6000 8000 10000
0.0 0.2 0.4 0.6 0.8 1.0
ICO2
Time(s) Ⅱ
Ⅰ Ⅲ
(a) (b) (c)
0 2000 4000 6000 8000 10000
0.00 0.02 0.04 0.06 0.08 0.10
F
Time(s) Ⅱ
Ⅰ Ⅲ
0 2000 4000 6000 8000 10000
0 10 20 30 40 50
ICO
Time(s) Ⅱ
Ⅰ Ⅲ
0 2000 4000 6000 8000 10000
0.0 0.2 0.4 0.6 0.8 1.0 1.2 1.4
CO/CO2
Time(s)
Ⅰ Ⅱ Ⅲ
0 2000 4000 6000 8000 10000 0.0
0.1 0.2 0.3 0.4 0.5 0.6
CO/(CO+
CO2)
Time(s) Ⅱ
Ⅰ Ⅲ
0 2000 4000 6000 8000 10000
0 200 400 600 800
Rc
Time(s) Ⅱ
Ⅰ Ⅲ
0 2000 4000 6000 8000 10000
0 5 10 15 20 25 30
Rc
Time(s) Ⅱ
Ⅰ Ⅲ
(g) (h) (i)
0 2000 4000 6000 8000 10000
0 500 1000 1500 2000 2500
Rn
Time(s) Ⅱ
Ⅰ Ⅲ
0 2000 4000 6000 8000 10000
0 100 200 300 400 500
Rn
Time(s) Ⅱ
Ⅰ Ⅲ
(j) (k)
Figure 8. Indicator gases and Gas ratios trends graph
Through the analysis of fig. 8(a)-(k), in the whole coal combustion process, the change trends of gas ratios shows the following regularities
(1)The variation trend of △O2 and F are basically
the same. In the first stage of coal combustion (preheating stage) and phase II (open flame burning stage), O2 and F have both gradually
increased, while in the third stage (smoldering stage), the value of △O2 and F gradually become
smaller.
(2) The variation trend of Tr and ICO2 are
basically the same. In the first stage, the second stage and the early period of third stage of coal combustion, Tr and F are both showing increasing trend; F and Tr are decreasing gradually in the end of third stage, but they are still sustaining at a relatively high level.
(3) In the first stage of coal combustion, the value of ICO has gradually increased, and then gradually decreased in the second stage, but its lowest value is still at a relative high position; at stage III, the ICO value has firstly increased and then decreased.
(4) The variation trend of CO/CO2 and
CO/(CO+CO2) are the same. At the first stage of
coal combustion , CO/CO2 and CO/ (CO+CO2)
have increased radically at first and then decreased gradually; CO/CO2 and CO/ (CO+CO2) have
gradually decreased in the beginning and then gradually increased during the second stage; at stage III, CO/CO2 and CO/(CO+CO2) have
increased firstly and then decreased gradually.
(5) In the first stage of coal combustion, Rn has decreased sharply, while Rc decreased sharply, and then maintained at a stable value; in the second stage of coal combustion, Rc has increased firstly and then decreased, and Rn remains at a minimum basically; at stage III, both Rn and Rc increases gradually.
Therefore, when the coal mine is not affected by the external environment (air leakage or man-made inert gas injection etc.), the change rules of gas ratio are the following
(1) △O2, F, Tr and ICO2 increase continuously,
while ICO, CO/CO2 and CO/ (CO+CO2) decreased
at the same time, which shows that combustion intensity of burning area gradually increased. (2) When the value of Rn and Rc are in a relatively small range, if Rc appears a slight increasing trend and Rn maintains stable at the same time, it implies that the combustion intensity of combustion area gradually increased.
By comparing the experimental results in this paper with the references from some literatures of the different gas ratios, it is shown that only the change law of ICO is quite different from the literature introduction(S K Ray, 2004). According to the process of coal oxidation, CO is the main product of incomplete reaction of coal oxidation .When the violent oxidation reaction happens, the main product of coal combustion is CO2.
will not keep rising as the combustion strengthens. At the same time, the critical values of the ICO would also change with the impact of air leakage in the coal mine fire area , inert gas injection and other external environment. Therefore, rescuers could not be determined the combustion status only by the critical value of ICO, the analysis of ICO and other gas ratio trends should be comprehensively applied to judge the mine fire combustion status.
FIELD CASE ANALYSI
S
In October 17, 2005, the coal mine fire occurred in working face E11610 in Cuijiazhai mine of Kailuan Group, China. After the failure of direct extinguishing, rescuers adopted the closure measurements. At the same time, in order to control the fire spreading and prevent explosion of CH4, amounts of N2 and CO2 (mostly N2) had
been injected into the closed fire zone from October 25 to 28. After the inert injection, the rescuers took regular daily recording of the manual gas-sampling analysis in sealed fire area to monitor the combustion state. Though the whole monitoring process, the rescuers found out several temperature fluctuation in closed fire zone after November 17th, and even heard faint sound of explosion in December 26th, so rescue workers were sure that there existed fire re-ignition phenomenon in closed fire area. They considered the air leakage from mine goaf to be the main reason of the re-ignition, so they took the measures of pressure balancing and inert gas injection to the closed fire zone at the end of December, then the combustion state tended to be stable. Fig. 9 (a) - (d) shows the changes of CO, CO2, O2 and CH4
concentration from November 1st to December 31st, where the fire re-ignition occurred, in the closed fire zone.
2005/11/1 2005/11/16 2005/12/1 2005/12/16 2005/12/31
0 50 100 150 200
CO (p
pm
)
Date
2005/11/1 2005/11/16 2005/12/1 2005/12/16 2005/12/31
0 2 4 6 8
O2
(%)
Date
(a) (b)
2005/11/1 2005/11/16 2005/12/1 2005/12/16 2005/12/31
0 1 2 3 4 5 6
CO2 (
%)
Date
2005/11/1 2005/11/16 2005/12/1 2005/12/16 2005/12/31
0.00 0.02 0.04 0.06 0.08 0.10
CH4 (%)
Date
(c) (d)
Figure 9.The curves of indictor gases change
Through the analysis of Fig. 9, due to the impact of inert gas injection and air leakage in the closed fire zone, it is difficult to judge the re-ignition tendency only by the changes of CO, CO2, O2 and
CH4 concentration. At the same time, the inert gas
injection also creates error of Oxygen consumption value in gas ratio calculation. Therefore, using merely the critical value of gas ratios, just as the practical case did, could not judge the combustion state in fire area accurately.
2005/11/1 2005/11/16 2005/12/1 2005/12/16 2005/12/31 18
20 22 24 26
△
O2
Date
2005/11/1 2005/11/16 2005/12/1 2005/12/16 2005/12/31
0.00 0.05 0.10 0.15 0.20 0.25
Tr
Date
2005/11/1 2005/11/16 2005/12/1 2005/12/16 2005/12/31
0 5 10 15 20 25 30
ICO2
Date
(a) (b) (c)
2005/11/1 2005/11/16 2005/12/1 2005/12/16 2005/12/31
0 1 2 3
F
Date
2005/11/1 2005/11/16 2005/12/1 2005/12/16 2005/12/31
0 200 400 600 800 1000
ICO
Date
2005/11/1 2005/11/16 2005/12/1 2005/12/16 2005/12/31
0 200 400 600 800 1000 1200
CO/CO2
Date
(d) (e) (f)
2005/11/1 2005/11/16 2005/12/1 2005/12/16 2005/12/31
0.00 0.03 0.06 0.09 0.12
CO/(CO+
CO2)
Date
2005/11/1 2005/11/16 2005/12/1 2005/12/16 2005/12/31
0 500 1000 1500 2000 2500 3000
Rc
Date
2005/11/1 2005/11/16 2005/12/1 2005/12/16 2005/12/31
0 300 600 900 1200
Rn
Date
(g) (h) (i)
Figure 10.The changing curves of gas ratio trends
Since large amounts of N2 and a certain amount of CO2 were injected into the mine goaf, the value of
Tr, ICO, ICO2, CO/CO2 and CO/ (CO+CO2)
becomes lower while F, Rc, O2 and Rn are higher,just as Fig. 10 shows. However, by analyzing the changing tendencies of these gas ratios, it could be condluded that Tr, ICO2 and F radically increased with fluctuation, while ICO, CO/CO2 and CO/(CO+CO2) showed a descending
trend after November 29th, and Rc presented a quick rising trend with violent fluctuations. According to the changing rule of gas ratios in coal combustion experiment summarized in this paper, the data above implied the existence of fire re-ignition in the closed fire zone, which means the conclusion in this paper consist with the practical observation results of closed fire zone in this case.
Therefore, in the process of coal mine fire relief, even though the gases in closed fire area are affected by the external environment, rescuers could still acquire the combustion state about mine fire accurately by monitoring indictor gases in the closed fire area continuously, and analyzed the
change trends of indicator gases , gas ratios and the mutual relationship between them.
CONCLUSION
This paper studies the changing rules of gas indictors during the whole process of coal fire by establishing an experimental platform for coal combustion in small-sized confined space. The results show that the production of indictor gases is closely associated with the intensity of coal oxidation reaction. In the early stage of coal spontaneous combustion and flaming combustion stage, with the increase of coal oxidation reaction, oxygen consumption increased gradually, and the production of CO2 increased gradually, while the
production of CO increased firstly and then decreased. In the smoldering extinguishing stage, oxygen consumption decreased, the production of CO2 decreased gradually, while CO increased
firstly and then decreased.
the present literature introduction, the changing principles of other gas ratios are consistent with the literatures. With the gradual aggravation of coal combustion, the value of ICO will gradually increase and then decrease, but it will not continue rising with the strengthening of combustion. In the process of coal mine fire relief, even though the gas sampling in closed fire area is influenced by the external environment, rescuers still could acquire the accurate judgment about the combustion state in coal mine fire by taking the continuous analysis of indictor gases sampling of the fire area and analyze the changing trends of gas indictors, gas ratios and the mutual relationship between them.
REFERENCES
Ann G.Kim. (2004). Locating fires in abandoned underground coal mines. International Journal of Coal Geology, 59(s1-2), 49-62.
Bystron H.(1997). State of the fire,ignition of gases during active and passive fire extinguishing . Archives of Mining Sciences, 42(1), 3-44.
Yan .(2013, July 12). Coal mine found concealing blast death toll. Xinhua News. Retrieved from
http://news.xinhuanet.com/english/china/2013-07/12/c_132533515.htm.
Fehmi Akgün, Ahmet Arisoy. (1994). Effect of particle size on the spontaneous heating of a Coal pile. Combustion and Flame, 99(1), 137-146.
Kuchta, J.M., Furno, A.L., Dalverney, L.E, et al. (1982). Diagnostics of sealed coal mine fires. U.S. Bureau of Mines.RI-8625.
Ghosh, A.K., Banerjee, D.D. (1967). Use of carbon– hydrogen ratio as an index in the investigation of explosions and underground fires. Journal of Mines, Metals and Fuels,15, 334–340.
Graham, J.I., (1921). The normal reduction of carbon monoxide in coalmines. Transaction of the Institution of Mining Engineers ,60, 222–234. JB Stott,BJ Harris,PJ Hansen. (1987). A `full-scale'
laboratory test for the spontaneous heating of coal. FUEL, 66(7), 1012-1013.
Jun Den, Yang Xiao, Qingwei Li, et al.(2015). Experimental studies of spontaneous combustion and anaerobic cooling of coal. FUEL, 157:261-269. Jones JH, Trickeet JC. (1954). Some observation on the
examination of gases resulting from explosions in collieries , Trans. Inst. Mining Engineers, 114, 768-790.
K. Baris, S. Kizgut, V. Didari. (2012).Low-temperature oxidation of some Turkish coals. Fuel, 93, 423-432. Orloff L. (1981). Simplified radiation modeling of pool
fires. Symposium (International) on Combustion, 18(1), 549-561.
Philip J. DiNenno, P. E. (2002).SFPE Handbook of Fire Protection Engineering.Massachusetts: National Fire Protection Association, Inc.
R.Morris, T.Atkinson. (1987). Sampling gases in a sealed mine fire area. Mining Science and Technology, 5(1):25-31.
S K Ray,R P Singh,N Sahay, N K Varma. (2004). Assessing the status of sealed fire in underground coal mines. Journal of Scientific & Industrial Research, 63,579-591
Willet, H.L., (1962). Sealing of fires underground, a Memorandum by Committee of the Institution of Mining Engineers. Mining Engineers, 121, 709-760. X.D.Chen, J.B.Stott. (1997). Oxidation rate of coals as measure from one-dimensional spontaneous heating. Combustion and Flame, 109, 111-114.
Yuan S J,Szlazak,Obracaj D. (2006). Assessment of sealed fire states by fire characteristic. Journal of Coal Science and Engineering, 12(1), 68-72. Zhou Fubao,Shao He,Li Jinhai, et al. (2010).
Experimental Research on Combustion Product Formation During Coal Spontaneous Combustion Under Reduced Oxygen Concentrations. Journal of China University of Mining & Technology, 39(6), 808-812.
Zhou, X., & Wu, B. (1996). Theory of mine fire rescues and applications. Beijing: Coal Mining Industry Press.
Zhong Xiaoxing, Wang Deming, QI Xuyao, et al.(2009). Research on Oxidation Kinetics Test Methods Concerning the Spontaneous Combustion of Coal. Journal of China University of Mining & Technology, 38(6), 789-793.