American Journal of Environmental Sciences 1 (2): 164-171, 2005 ISSN 1553-345X
© 2005 Science Publications
Corresponding Author: Rodríguez-Rodríguez, Miguel, Department of Environmental Sciences, Pablo de Olavide University, Seville, Spain, Postal Address: Carretera de Utrera Km. 1, Seville 41013, Spain , Telephone and Fax: 00-34-954349524; 00-34-954419151
164
High Density Groundwater Flow, Major-ion Chemistry and Field Experiments in a Closed
Basin: Fuente de Piedra Playa Lake (Spain)
1
Rodríguez-Rodríguez, Miguel,
2Benavente Herrera, José and
3Moral Martos, Francisco
1
Department of Environmental Sciences, Pablo de Olavide University, Seville, Spain
Postal Address: Carretera de Utrera Km. 1, Seville 41013, Spain
Telephone and fax: 00-34-954349524; 00-34-954419151
2
Water Research Institute, University of Granada, C/ Ramón y Cajal s/n, Granada 18071, Spain
3
Department of Environmental Sciences, Pablo de Olavide University, Seville, Spain
Abstract: This study presents the results of 10 years of field investigation in Fuente de Piedra Playa Lake located in southern Spain. These field observations along the playa’s shore revealed evidence of a forced convective flow and the existence of density interface below the playa basin. An upward flux of groundwater from underlying formations could be a considerable part of its recharge. These groundwater fluxes mostly occur during the summer when the playa is a salt-flat. On this basis, a numerical model was applied in order to examine the effects of upward fluxes on the geometry of the salinity interface. On the other hand, hydrochemical classification and stable isotope analyses were employed to determine the processes that control surface water and groundwater chemistry. Water budget results also confirm the conceptual model developed of the system.
Key words: Groundwater, Playa lake, closed basin, brine, water budget
INTRODUCTION
A recharge playa occurs when the capillary fringe’s level coincides with the playa floor[1]. Layers of evaporites (mainly halite and gypsum) are found due to evaporation. Salts are removed from the playa and are directed either to the basin by eolian transport or to the sediment by several mechanisms. It has been reported that one of these mechanisms could be diffusion into sediments[2]. More recently, it has been shown that convective flow, driven by density gradients between the lake and the pore water, may also be an important mechanism of salt transport. The hydrodynamic model that explains this hypothesis was first developed by Duffy and Al-Hassan[3] and later by Fan et al.[4] (Fig. 1).
All over the south of Spain, an area mostly characterized by a Mediterranean semiarid climate, high-salinity water appears in two different hydrogeological circumstances. The first circumstance is associated with groundwater flow through anhydrite, gypsum, halite and other evaporite sediments, typically associated with Triassic clayey materials found in this area. This case gives rise to the appearance of saline springs that can cause serious problems, being that they affect the water quality of rivers used for irrigation and/or urban supply[5,6]. The second circumstance is related to brines appearing in a series of salt lakes occupying the lower part of closed basins[7]. In these
“free brines”, concentration by evaporation is the key factor. This allows moderate-salinity water to evolve, in annual cycles, into brines, which will later cause their desiccation in the summer. In addition, “phreatic brines” linked to these seasonal salt lakes are identified by monitoring the piezometers or by groundwater pumping below the salt crust or adjacent to the lake’s borders. Hydrochemical differences among these kinds of brines must be expected, particularly when stable-isotope contents are regarded. The isotopic composition of saline springs is typically meteoric. In contrast, the effects of isotopic fractionation due to evaporation is clear, to a greater or lesser extent, in the waters of free or phreatic brines that are linked to the lakes. In any case, a common origin of these two types of brines can be established, being that the Triassic evaporites’ karstification cause either saline springs or closed basins, which host the lakes[8,9]. Groundwater flow through saline materials and concentration by evaporation may have acted together in order to generating the phreatic brines related to salt lakes.
165
Forced convective flow
Free convective flow Net recharge
Net discharge Hinge line
Playa centre Drainage divide
Fig. 1: Conceptual model of groundwater circulation in a closed basin. Some experimental devices are also represented[4]
0 2 5 Km.
Malaga
700
500
500
600 600
500
500
LEGEND
Lake Drainage basin Ephemeral stream Topography
N
IBERIAN PENINSULA
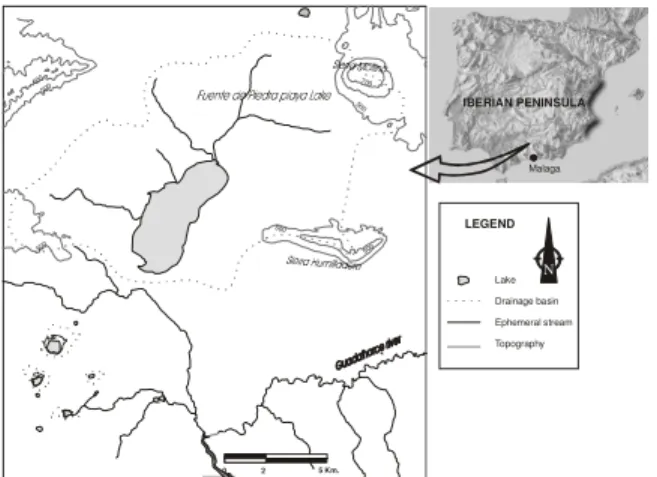
Fig. 2: Geographical sketch. The situation of the main ephemeral streams and of the major elevations
(Sierras) is shown
In addition, Fuente de Piedra Playa Lake is inhabited by an interesting group of birds, among which the pink flamingo (Phoenicopterus ruber roseus) can be considered the most significant. For this reason, Fuente de Piedra has been included in the Ramsar Agreement as a special interest area in hopes of preserving this species of bird[10]. A number of studies related to the hydrology of the system have been published[11-15]. This study is based on the results of 10 years of field monitoring and experiments done in Fuente de Piedra Playa Lake (Fig. 2). Physical, hydrogeologic and hydrochemical information from the groundwater system will be integrated and used to determine the mechanisms controlling the chemistry of surface and groundwater in the area. The main questions to be addressed in this study include: (a) the lake’s water balance; (b) the characterics of high salinity groundwater recharge produced by Triassic evaporites’ dissolution; (c) 2D numerical modelling describing the shape and position of the interface between fresh water and phreatic brines, as it has been identified experimentally along the shore of the lake; and (e) hydrochemical and isotopic classification of surface and groundwater in order to develop a conceptual hydrochemical and hydrological model of the system.
Description of the study area: The closed basin of Fuente de Piedra Playa Lake is located 75 km north of
the coastal city of Malaga (Fig. 2), between the Atlantic and the Mediterranean watershed divide. Fuente de Piedra’s aquifer is made up primarily of Upper Miocene calcareous sands and of Quaternary alluvial materials. However, karstified Jurassic carbonate materials (Mollina and Humilladero sierras) are present in the limits of the basin and are integrated in the hydrogeological system.
Present climate in the study area is Mediterranean with a semiarid trend. The precipitation averages 450 mm. Annual mean temperature ranges from 15 to 17ºC. Abundant sunshine and low humidity cause the playa’s ETP to exceed 800 mm year1, almost 50% of which is produced from June to August. Current evapotranspiration over the basin has been estimated to be about 35% of its potential evaporation. Total evaporation in Fuente de Piedra Playa Lake, measured with “class A” evaporation tanks, was 1600 mm.
MATERIALS AND METHODS
Water volume balance: Water volume balance in Fuente de Piedra Playa Lake was calculated in order to quantify the relative incidences of the different variables. The explicit water volume balance for a steady state situation associated with the conceptual model explained above can be formulated as follows; where fundamental dimensions are mass (M), length (L) and time (T). Groundwater flow, to or from the system (Qg , L3/T) was considered the incognito:
s e f r
g Q Q Q Q
Q = + − ±
Where:
Qr = average rainfall
Qf = overland runoff into the playa
Qe = evaporation
Qs = water storage
If Qg > 0, this suggests groundwater recharge and
if Qg < 0 this means that flow comes from the lake to
adjacent pervious materials. Meteorological data (precipitation, evaporation from a “class A” evaporation tank and wind speed) were collected on a daily bases from the Cerro del Palo weather station (W.S.), located on the northern shores of Fuente de Piedra Playa Lake (Fig. 3). Runoff into the playa was obtained measuring stream flows every month. Daily lake water levels were obtained from a limnigraph device installed in a well located in the playa lake (open shallow well 1, Fig. 3).
166
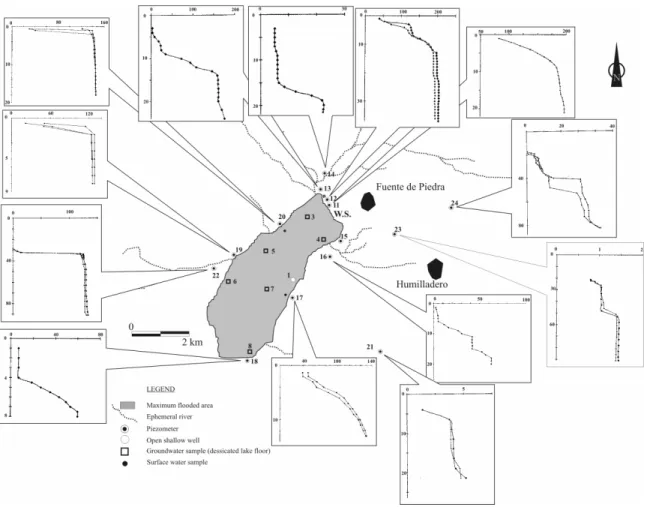
Fig. 3: The location of piezometers and sampling sites in Fuente de Piedra Playa Lake. Vertical profiles of EC (mS cm1) in several piezometers are represented (depth in m)
(Fig. 3). From these piezometers a series of ground water samples have been taken at different depths from 1991 to 2001. These samples were later analyzed in order to obtain principle ionic components, stable isotopes (D y 18O) and other parameters such as total solids, solids in suspension, chlorophyll, total phosphorus and nitrogen, ammonium, nitrites and nitrates. In addition, using these piezometers electric conductivity (EC) profiles were carried out in order to characterize the interface that was detected between superficial fresh water and subterranean phreatic brines. Profiles obtained from the different piezometers located on the lake’s borders are found in Fig. 3. Shallowly located soil pits were also placed in the lake during the study period to obtain a series of ground water samples during periods of desiccation in trays and wells of old salt flats.
Salinity interface modeling: Basin topography and substratum depth were previoulsy digitized in order to evaluate water volume (reserves) and to carry out a bi-dimensional flow model. A uniform grid (up to a total of 4,548 nodes) was created and, using this grid as a starting point, topographic height has been assigned to
each node using 1:10,000 base maps. Substratum depth has been established from the drilled piezometers and from previous data. The average depth of the substratum is around 50 m and maximum values were found in the central part of the basin. On the horizontal axis (1:12,500 scale), 77 nodes were placed at a distance of 100 m. On the vertical axis (1:500 scale), 20 nodes were placed at a distance of 5 m. In the hydrodynamic model, anisotropy (relation Kv/Kh) of
0.05 was used. Hydraulic conductivity of 2×10⁻³ m d1 has been assigned to Quaternary materials, representing the major surface deposits above the aquifer. Hydraulic conductivity of 3.6×10⁻³
m d 1 was accepted for Miocene materials, effective porosity was 35% and longitudinal dispersivity was at 0.3 m.
The model does not consider diffusion as an independent parameter, although the dispersion coefficient (hydrodynamic dispersion) is comprised of mechanic dispersion and diffusion. The ratio between transversal and longitudinal dispersion is 0.3. Boundary conditions of the hydrodynamic model are as follows: * An average depth of effective precipitation
167 * Null salinity has been assigned to precipitation
(0 g L1).
* High salinity recharge (150 g L1) has been applied in every simulation;.
* Discharge is only represented by surface evaporation.
MOC (“Two-dimensional
Method-Of-Characteristics Groundwater Flow and Transport
Model”) developed by the USGS[16,17] was employed in
the simulation, it uses interactive approaches to solve the finite-differences’ formulation of the groundwater flow equation.
Hydrochemical database and isotopic analyses:
Extensive hydrochemical data has been collected throughout the last 10 years in the Fuente de Piedra Playa Lake system (Fig. 3), including surface water and groundwater. The database used in this study is a compilation of the majority of this collected data. AquaChem (Aqueous Geochemical Data Analysis and
Plotting)[18] was employed to classify waters into
hydrochemical facies. The entire database consists of the chemical analyses of 156 surface water samples and 84 groundwater samples, including temporal series, samples collected at the same location over a period of time. Database construction procedures, analytical techniques and the data’s sources are discussed in detail in Rodríguez-Rodríguez[14]. Aqueous speciation and mineral saturation indices were performed using PHREEQC[19].
Stable isotopes of oxygen and hydrogen are the most common tracers employed in hydrogeology. The isotopes are usually indicated as the ratio R, from heavier to lighter and are relative to the standard mean ocean water (RSMOW)
SMOW SMOW
R
R
R
−
=
1000
δ
The GMWL proves the relationship between 18O and D for rain water. It has a linear function with a slope that is the result of the equilibration of ocean water’s evaporation. A local meteoric water line (LMWL) may deviate from the GMWL and, in general, the isotopically lightest precipitations take place further away from the coast, at high altitudes and latitudes[20].
RESULTS AND DISCUSSION
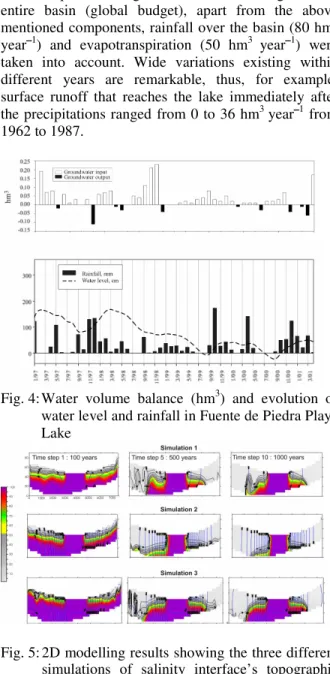
Water volume balance: In Fig. 4, water mass
balances, as seen on a monthly scale, are represented. From the obtained results it has been established that the main components of recharge (groundwater, rainfall and runoff) play a similar part in the recharge’s equilibrium. During the study period, average values
for groundwater recharge were 4.1 hm3 year1, 4.9 hm3 year1 for rainfall (Table 1) and the average runoff contribution was 4.7 hm3 year1. On a monthly scale, rainfall could reach values of more than 2 hm3 month1 and runoff more than 3.9 hm3 month1 immediately after rainfall. Groundwater inputs are not as variable due to the supposed regulation of flow through the detritic aquifer. In regards to the water budget in the entire basin (global budget), apart from the above mentioned components, rainfall over the basin (80 hm3 year1) and evapotranspiration (50 hm3 year1) were taken into account. Wide variations existing within different years are remarkable, thus, for example, surface runoff that reaches the lake immediately after the precipitations ranged from 0 to 36 hm3 year1 from 1962 to 1987.
Fig. 4: Water volume balance (hm3) and evolution of water level and rainfall in Fuente de Piedra Playa Lake
Fig. 5: 2D modelling results showing the three different simulations of salinity interface’s topographic positions. Legend shows percentage of salt content compared to brine (150 g L1). Simulation 1 appears to be the most similar to real conditions observed in the field
Fuente de piedra numerical modelling: Two-D
168 for every simulation have been represented. During the first stage, T = 100 years, all of the aquifer is considered to be saturated with phreatic brine. During the following stages, until T = 1000 years, the evolution of the interface can be observed.
The system is not stable in the second case, being that the fresh water recharge would remove the salts from the system and the interface would be placed directly under the lake. In this simulation, the deep recharge flow equals the surface recharge. The third case considers a deep recharge 10 times larger than the fresh water recharge. As a result, this simulation shows a very gentle interface placed near the surface in distal areas of the basin. This situation was not observed in the field.
In the first simulation a deep flow, five times larger than surface recharge has been observed. The position of the interface resulting from this simulation is similar to that detected during field experiments. The substratum’s heterogeneity sometimes marked local differences in the position of the interface. The result obtained in these conditions fits the experimental results obtained in the field.
The use of this model has allowed us to determine the interface position in a temporal scale (1000 years), this being enough time to confirm the stability of the situation at such a temporal scale. Furthermore, a rate of 8 hm3 year1, for groundwater recharge, is consistent with the water budget results and, therefore, the validity of the model is partially confirmed.
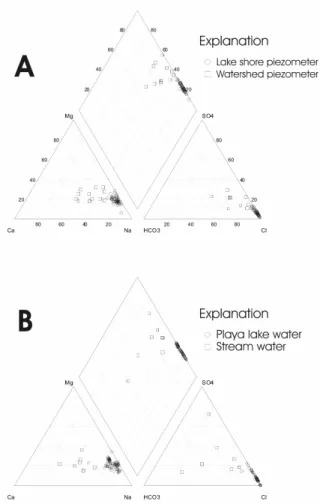
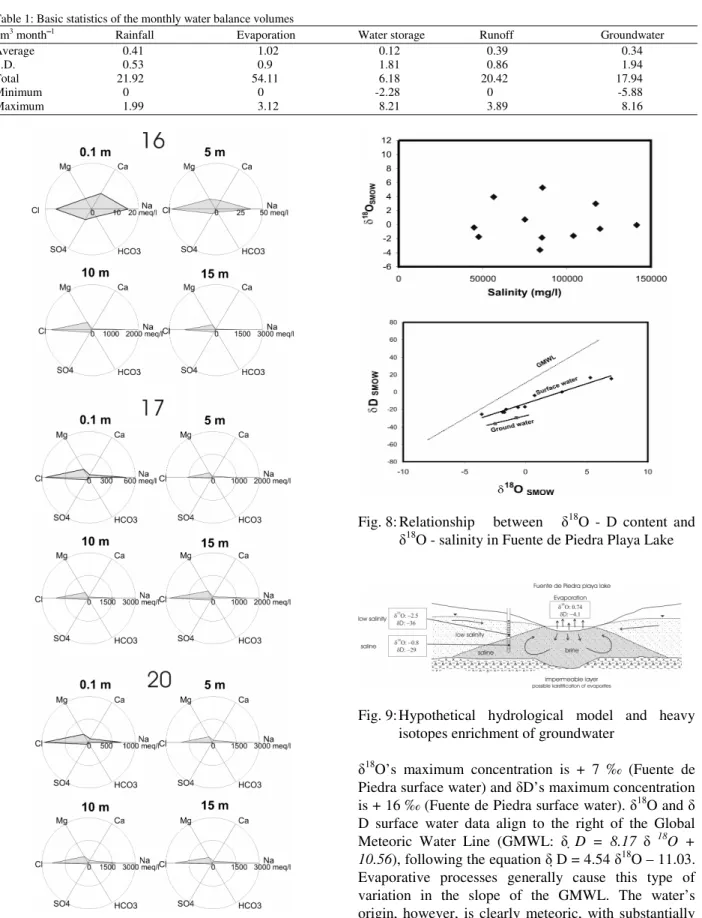
Hydrochemical facies of surface and groundwater and isotopic content:Water in the aquifer varies from moderately fresh to very saline (1 to 300 g L1), even though all samples were taken from either the central part of the basin or from the desiccated lake floor (Fig. 3). In this case, saline water is expected to appear, as changes in groundwater salinity occur along flow paths from recharge to discharge areas. Surface water and soil moisture evaporation have been found to be a dominant process in the development of groundwater’s composition. The evaporation-induced source of groundwater salinity is amplified in arid and semiarid lands, such as Fuente de Piedra. Radial plots indicating ionic composition at different depths by several piezometers are shown in Fig. 7. Increasing salinity is due mainly to the increase in concentrations of Cl- and Na+. The interface is trespassed at a certain depth, depending on the position of the piezometers in the basin. The likely origin of the reflux brine is caused by the progressive accumulation of evaporated waters that descend as their density increases and, at a certain depth, get mixed with the regional groundwater. This situation of free convection has been detected in other playa lakes[4].
Lake water composition is always Cl or Na-Mg-Cl, although concentrations (TDS) vary from 7 to 300 g L1, depending on the season (Fig. 6).
Fig. 6: Major-ion composition of (A) surface water and (B) groundwater in the Fuente de Piedra Playa Lake
Saturation indices are employed to evaluate the degree of equilibrium between water and minerals. Changes in the state of saturation are used to discriminate between the different stages of hydrochemical evolution and to find out which are the main geochemical reactions controlling water chemistry. Saturation indices for two hypothetical samples (average for the whole data-base: 93 surface and 74 ground water samples from Fuente de Piedra Lake and its aquifer) are compiled in Table 2. The results of the saturation calculations show that the groundwater sample is supersaturated in respect to dolomite. Calcite and gypsum are under saturated, suggesting that their soluble Ca2+, SO42- and CO3
2-component concentrations are not limited by mineral equilibrium. In the surface water, several minerals are supersaturated (aragonite, calcite and dolomite) making CO2's partial pressure very low (10-4). Photosynthetic
169 Table 1: Basic statistics of the monthly water balance volumes
hm3 month1 Rainfall Evaporation Water storage Runoff Groundwater
Average 0.41 1.02 0.12 0.39 0.34
S.D. 0.53 0.9 1.81 0.86 1.94
Total 21.92 54.11 6.18 20.42 17.94
Minimum 0 0 -2.28 0 -5.88
Maximum 1.99 3.12 8.21 3.89 8.16
Fig. 7: Radial plots indicating major-ion composition of ground water samples. Notice variations in hydrochemical composition as depth increases (radial scale in meq L1)
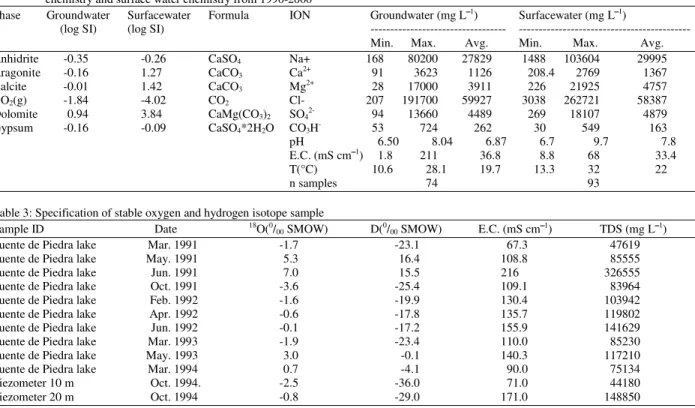
Fig. 8: Relationship between 18O - D content and
18
O - salinity in Fuente de Piedra Playa Lake
Fig. 9: Hypothetical hydrological model and heavy isotopes enrichment of groundwater
18
O’s maximum concentration is + 7 ‰ (Fuente de Piedra surface water) and D’s maximum concentration is + 16 ‰ (Fuente de Piedra surface water). 18O and D surface water data align to the right of the Global Meteoric Water Line (GMWL: D = 8.17 18O +
10.56), following the equation D = 4.54 18O – 11.03.
Evaporative processes generally cause this type of variation in the slope of the GMWL. The water’s origin, however, is clearly meteoric, with substantially lower levels of isotope content than sea water and is located close to the local meteoric water line: D =
6.66 18O + 0.67. In Fig. 8, no clear trend between
170
Table 2: Saturation indices calculated with PHREEQC for average samples of ground water and surface water. Basic statistics of ground water chemistry and surface water chemistry from 1990-2000
Phase Groundwater Surfacewater Formula ION Groundwater (mg L1) Surfacewater (mg L1)
(log SI) (log SI) --- ---
Min. Max. Avg. Min. Max. Avg.
Anhidrite -0.35 -0.26 CaSO4 Na+ 168 80200 27829 1488 103604 29995
Aragonite -0.16 1.27 CaCO3 Ca2+ 91 3623 1126 208.4 2769 1367
Calcite -0.01 1.42 CaCO3 Mg2+ 28 17000 3911 226 21925 4757
CO2(g) -1.84 -4.02 CO2 Cl- 207 191700 59927 3038 262721 58387
Dolomite 0.94 3.84 CaMg(CO3)2 SO42- 94 13660 4489 269 18107 4879
Gypsum -0.16 -0.09 CaSO4*2H2O CO3H- 53 724 262 30 549 163
pH 6.50 8.04 6.87 6.7 9.7 7.8
E.C. (mS cm1) 1.8 211 36.8 8.8 68 33.4
T(°C) 10.6 28.1 19.7 13.3 32 22
n samples 74 93
Table 3: Specification of stable oxygen and hydrogen isotope sample
Sample ID Date 18O(0/00 SMOW) D(0/00 SMOW) E.C. (mS cm1) TDS (mg L1)
Fuente de Piedra lake Mar. 1991 -1.7 -23.1 67.3 47619
Fuente de Piedra lake May. 1991 5.3 16.4 108.8 85555
Fuente de Piedra lake Jun. 1991 7.0 15.5 216 326555
Fuente de Piedra lake Oct. 1991 -3.6 -25.4 109.1 83964
Fuente de Piedra lake Feb. 1992 -1.6 -19.9 130.4 103942
Fuente de Piedra lake Apr. 1992 -0.6 -17.8 135.7 119802
Fuente de Piedra lake Jun. 1992 -0.1 -17.2 155.9 141629
Fuente de Piedra lake Mar. 1993 -1.9 -23.4 110.0 85230
Fuente de Piedra lake May. 1993 3.0 -0.1 140.3 117210
Fuente de Piedra lake Mar. 1994 0.7 -4.1 90.0 75134
Piezometer 10 m Oct. 1994. -2.5 -36.0 71.0 44180
Piezometer 20 m Oct. 1994 -0.8 -29.0 171.0 148850
observed. However, the water’s isotopic composition depends on the evaporation rates after recharge and, as well as, on the original isotopic composition. Isotopic division is produced mainly after recharge, however
18
O concentrations may be high despite the water’s salinity. As a consequence, the hypothesis of deep brine recharging the lake can be partially confirmed.
In Fuente de Piedra Playa Lake an important component of the recharge could also be the reflux brine, since evaporation rates are very high in summer and the capillary fringe coincides with the playa floor[22,23]. The isotopic composition of the reflux brine depends on the evaporation rate near the lake’s surface as well as the proportion of regional groundwater that mixes with the descending brine. The proposed hypothetical hydrological model and groundwater’s enrichment by heavy isotopes can be seen in Fig. 9.
CONCLUSION
Results from water level measurements, salinities and the inferred groundwater flux in Fuente de Piedra Lake’s aquifer revealed strong evidence of groundwater recharge (forced convective flow) into Fuente de Piedra Playa Lake. This caused by the fact that in this Playa Lake, the central part of the basin represents the base level of the aquifer and also it becomes the discharge area for fluids from the underlying layers.
The salinity profiles from a series of piezometers show the existence of an interface below the playa
floor. The interface can be found near the shore, at a shallow level. However it sinks until the interface completely weakens, this occurring far from the playa centre. This situation has been registered by piezometers situated all over the basin, this meaning that the interface somehow encircles the playa’s margins. This can be roughly compared to a coastal aquifer, even though in that situation the interface depth is greater according to the Ghyben – Hertzberg equation. Stable isotopes (O, H) indicate that the brine derives from surface water, making it that free convection should occur in the playa centre were density is higher. As reported in other closed basins, playa wetness, the sediments’ permeability and the region’s climate are key factors for the occurrence of free convections.
Isotopic content has also allowed us to distinguish the hydrologic functioning in this type of arid wetland. Groundwater recharge is a main component of the budget, this making it possible to classify the system as
mixed from a hydrological approach. Results derived
from numerical modeling partially confirm this assumption.
171
ACKNOWLEDGEMENTS
We would like thank D. Manuel Rendón, Director of the Fuente de Piedra Council, for his field assistance and accessibility. Thanks to Professor M. Van Camp from the University of Ghent for his collaboration in developing the groundwater modelling methodology applied to Fuente de Piedra Lake’s basin. M.R-R. was supported by a fellowship from the Ministry of Education and Culture.
REFERENCES
1. Yechieli, Y. and W. Wood. 2002. Hydrogeologic processes in saline systems: Playas, sabkhas and saline lakes. Earth-Sci. Rev., 58: 343-365.
2. Langbeim, W.B., 1961. Salinity and hydrology of closed lakes: A study of the long-term balance between input and loss of salts in closed lakes. USGS Professional Paper, pp: 412.
3. Duffy, Christopher J. and S. Al-Hassan, 1988. Groundwater circulation in a closed desert basin: Topographic scaling and climatic forcing. Water Resour. Res., 24: 1675-1688.
4. Fan, Y., C.J. Duffy and D.S. Oliver, 1997. Density-driven groundwater flow in a closed basin: Field investigations and numerical experiments. J. Hydrol., 196: 139-184.
5. Carrasco, F., 1986. Contribución al conocimiento de la cuenca alta del río Guadalhorce el medio físico; hidrogeoquímica. Ph. D. Thesis. University of Granada.
6. Benavente, J. and F. Carrasco, 1984. Influence of evaporite karst in the streamwater of the Guadalhorce river (Andalucía, Spain). Le Grotte d’Italia. 4 (XII) - Proc. Int. Symp. Evaporite Karst, pp: 39-48.
7. Benavente, J., C. Almécija, F. Carrasco, P. Rodríguez Jiménez and J.J. Cruz San Julián, 1992. Reconocimiento hidroquímico de zonas endorreicas del Karst evaporítico de Antequera (Málaga). Geogaceta, 12: 50-52.
8. Lhénaff, R., 1981. Recherches géomorphologiques sur les Cordillères Bétiques centro-occidentales (Espagne). Thèse Univ. Lille III, 2.
9. Durán, J.J. and J.A. Molino, 1986. Karst en yesos del Trías de Antequera (Cordilleras Béticas). Karstologia Memoires 1. Association Française de Karstologie.
10. Bernues, M., 1990. La laguna de Fuente de Piedra. In: Humedales Españoles en la lista del Convenio de Ramsar (Eds. A. Troya and M. Bernués), pp: 159-164. ICONA. Madrid.
11. Linares, L., 1990. Hidrogeología de la laguna de Fuente de Piedra (Málaga). Ph. D. Thesis. University of Granada.
12. Almécija, C., 1997. Estudio hidrológico e hidroquímico de los sistemas lagunares del norte de la provincia de Málaga. Ph. D. Thesis. University of Granada.
13. ITGE, 1998. Hidrogeología de la Reserva Natural de la laguna de Fuente de Piedra (Málaga). Ministerio de Medio Ambiente.
14. Rodríguez-Rodríguez, M., 2002. Contribución hidrogeológica y limnológica a la caracterización ambiental de zonas húmedas de Andalucía oriental. Ph. D. Thesis. University of Granada.
15. Heredia, J., L. Araguás Araguás and J.M. Ruiz Hernández, 2004. Descripción de la dinámica subterránea de la laguna de Fuente de Piedra (Málaga). Caracterización hidroquímica e isotópica. VII Symp. Spanish Hydrogeol. Soc. Proc., pp: 27-280.
16. Konikow, L.F. and J.D. Bredehoeft, 1978. Computer model of two-dimensional solute transport and dispersion in ground water. U.S. Geological Survey Techniques of Water-Resources. Investigations, Book 7, Chap. C2. 17. Goode, D.J. and L.F. Konikow, 1989. Modification
of a method-of-characteristics solute-transport model to incorporate decay and equilibrium-controlled sorption or ion exchange. U.S. Geological Survey Water-Resources Investigations Report, pp: 89-4030.
18. Calmbach, L., 1997. AquaChem for Windows 95/NT–Aqueous geochemical analysis, plotting and modelling. Hydrogeologie Inc. Waterloo. 19. Parkhurst, D.L. and C.A.J. Appelo, 1999. User’s
guide to PHREEQC. U.S. Geological Survey Water-Resources Investigation Report, pp: 80-96. 20. James I. Drever, 1988. The geochemistry of natural
waters. 2nd Edn., Prentice-Hall Inc. Englewood Cliffs, N.J.
21. Castellón, L., 1970. Sobre la sedimentación en la laguna salada de Fuente de Piedra (Málaga). Ph. D. Thesis. University of Granada.
22. Benavente, J., C. Almécija and F. Carrasco, 1996. Origin and environmental significance of saline waters in the Antequera region (southern Spain). In: Wetlands: a multiapproach perspective (Eds. J.J. Cruz San Julián and J. Benavente). University of Granada, pp: 55-68.