Luiz Moreira Coelho Junior1, José Luiz Pereira de Rezende2, Ednilson Sebastião Ávila3, Antonio Donizette de Oliveira4, Luís Antônio Coimbra Borges5
(received: June 30, 2009; accepted: March 31, 2010)
ABSTRACT: This work analyzed the Brazilian cellulose industry concentration level between 1998 and 2007, focusing on the sector’s main performance indicators. The necessary data was collected from BRACELPA’s Statistical Reports during the same period. The concentration level was determined according to the following indexes: Concentration Ratio (CR); Herfindahl-Hirschman Index (HHI); Theil’s Entropy Index (E); and the Gini Coefficient (G). The primary conclusions were that the CR(4), CR(8), HHI, and Theil’s indexes presented high figures in spite of occasional fluctuations. The inequality of the industry, as measured by the Gini coefficient, was considered high, confirming the initial hypothesis of the work.
Key words: Forest economy, concentration indexes, cellulose.
ANÁLISE DA CONCENTRAÇÃO DA INDÚSTRIA BRASILEIRA DE CELULOSE (1998 – 2007)
RESUMO: Este trabalho analisou o grau de concentração da indústria brasileira de celulose, no período de 1998 a 2007, enfatizando os principais indicadores de desempenho do setor. Os dados necessários foram extraídos no Relatório Estatístico da BRACELPA, no período de 1998 a 2007. O grau de concentração foi determinado usando-se os índices: Razão de Concentração (CR); Índice de Herfindahl-Hirschman (HHI); Índice de Entropia de Theil (E) e; o coeficiente de Gini (G). As principais conclusões obtidas foram: Os índices CR(4), CR(8), HHI e Entropia de Theil mostraram-se elevados, apesar das oscilações apresentadas em certos momentos. A desigualdade da indústria medida pelo índice de Gini foi considerada alta, reafirmando a hipótese inicial do trabalho.
Palavras-chave: Economia florestal, índices de concentração, celulose.
1Economist, Researcher in socioeconomics – Intituto Agronômico do Paraná (IAPAR) – Rodovia BR 163, KM 188 – CEP 85825-000 –
Santa Tereza do Oeste, PR – [email protected]
2Forest Engineer, Ph.D. in Forest Economy, Visiting researcher – Departamento de Ciências Florestais – Universidade Federal de Lavras –
Cx. P. 3037 – 37200-000 – Lavras, MG – [email protected]
3Economist, Gradute of the Universidade Federal de São João Del Rei – [email protected]
4Forest Engineer, Professor, Dr. in Forest Science – Departamento de Ciências Florestais – Universidade Federal de Lavras – Cx. P. 3037 –
37200-000 – Lavras, MG – [email protected]
1 INTRODUCTION
Industry concentration is one of the most important components in business competitiveness. There is an inverse relationship between concentration and competition. The higher the concentration, the lower the competitiveness among companies, which strengthens the industry’s virtual market (POSSAS, 1990).
Brazil is the world’s leading producer of white cellulose fibers (short) and this product contributes significantly to Brazilian exports, reaching US$ 2.79 bi in 2008 (ASSOCIAÇÃO BRASILEIRA DE CELULOSE E PAPEL - BRACELPA, 2009 – Brazilian Pulp & Paper Association).
The cellulose industry is capital intensive, requiring estimated investments of approximately US$ 1000.00 to 1500.00 to produce one ton of the product per year. The production of this commodity is also marked by its inherent
Leite & Santana (1998) and Montebello (2006) studied the concentration of the cellulose industry in Brazil from 1987 to 1996, and analyzed structure and performance-related aspects of the industry between 1980 and 2005. These authors concluded that the concentration in the cellulose industry stems from the high entry barriers and the vertical integration processes.
The hypothesis of this work is that the Brazilian cellulose industry is highly concentrated. The calculation of the concentration indexes provides the empirical data necessary for the analysis of the cellulose industry’s structure and demonstrates the dimension of the business competitiveness.
The general objective was to characterize the Brazilian cellulose industry and analyze its concentration level from 1998 to 2007. The following concentration indexes were studied: the Concentration Ratio (CR) with four and eight companies; the Herfindahl-Hirschman Index (HHI); Theil’s Entropy Index (E); and the Gini Coefficient (G).
2 MATERIAL AND METHODS 2.1 Data
The necessary data for measuring the Brazilian cellulose industry concentration was collected from the Brazilian Pulp and Paper Association’s (BRACELPA) Statistical Reports from 1999 to 2008.
2.2 Concentration and inequality measures
The calculation of concentration provides empirical data for the analysis of the structure of a specific industry and demonstrates the dimension of competitiveness among companies. Resende (1994) stated that the concentration summarizes a concept of multiple dimensions such as supply and demand, technological capacity, cost structure, etc., in a single indicator.
Concentration indexes can be classified into partial or summary. Partial indexes take into account only the part of the companies doing businesses in a specific industry, whereas summary indexes include data from all companies in the sector. The concentration ratios are considered the most important partial indexes, while the
Hirschman-Herfindal and Theil’s Entropy indexes best represent
summary indexes. In addition to these concentration indexes, there is the Gini Coefficient, which is a measure used to calculate inequality, especially in terms of income. It can also be used to calculate the difference between the size and the economic power of the company. The indexes used in this work are described under the following items.
2.2.1 Concentration Ratio
This index considers the market share of k (k = 1, 2..., n), the largest firms in a particular industry. The equation of the concentration ratio is as follows:
1 k
i i
CR k s
in which,
si = percent cellulose market share of firm i.
As the value of the index increases, the virtual market power of the largest companies also increases. Conventionally, the market share of the four or eight largest companies is used, respectively CR(4) and CR(8). In order to calculate the concentration ratio, the companies’ market shares were organized so as to present figures going from the highest to the lowest.
2.2.2 Herfindahl Index – Hirschman (HHI)
The Herfindahl-Hirschman index, also known as the Herfindahl index, is a tool for analyzing market concentration and was independently proposed by Herfindahl (1950) and Hirschman (1945). Hirschman (1964) published the article “The Paternity of an Index”, which claims authorship of the index.
The HHI measures the industry concentration by using the data of all firms in a particular industry in the mathematical formula below:
2 1 n
i i
HH s
in which
n = n°of companies in the cellulose market;
si = percent cellulose market share of firm i.
The HHI shows the relative weights of each company’s market share. As the market shares of the companies are squared, those with the highest results are given more weight. Resende (1994) defines that the lower limit of the index is 1/n, at which point all firms are the same size. The upper limit of the index is 1, in which case maximum concentration is reached and a monopoly arises.
' 1 1 ; 1 1
HH nHH n
n
The use of this formula results in a 0 to 1 variation interval for the HHI. Thus, the more distant from zero the index is, the higher the concentration.
2.2.3 Theil’s Entropy Index (E)
The Entropy index proposed by Theil (1967) was originally formulated to verify the content of messages exchanged by companies, given the level of surprise that they would express in the face of a particular event. The index, however, can be applied to the industrial economy to measure the industry concentration of any sector.
The Entropy is calculated with the following equation:
1
ln
n
i i
E s
in which
n = n°of companies in the cellulose market;
si = percent cellulose market share of firm i.
The Entropy index measures the exact opposite of the concentration. The lower the index value, the more concentrated the industry. A higher number of companies means a higher Entropy value, depending on how unequal companies are in terms of size. The Entropy value is equal to zero in monopolies, which means maximum concentration. The upper limit of the index is equal to ln(n), i.e., companies have the same market shares and there is minimum concentration (RESENDE & BOFF, 2002).
Parallel to what the HHI suggests, Resende (1994) proposes an adjustment to the equation for calculating the Entropy in the analyses of different periods of time:
Thus, the entropy begins to vary between 0 and 1. 2.2.4 Gini Coefficient (G)
The Gini Coefficient is a measure of inequality developed by Gini (1912) in “Variabilità e mutabilità”. This coefficient was originally formulated to measure income inequality and may also be used to measure the level of inequality of businesses. The index is an accessory
tool for the concentration coefficients, since high concentration results in higher inequality.
The entropy is calculated with the following expression:
1 1
n ij i i
s s G
n
in which
n = n° of companies in a particular market;
sij= cumulative market share in the production ordered from the lowest to the highest;
si = percent cellulose market share of firm i.
The index varies from 0 to 1; when G = 0, market inequality is zero, and when G =1, market inequality is absolute.
3 RESULTS AND DISCUSSION
3.1 Characterization of the Brazilian cellulose industry According to Bracelpa (2009), Brazil is the world’s fourth largest producer of cellulose and is ranked as the third largest exporter. In 2008, the cellulose and paper sector had 220 companies in 450 municipalities located in 17 states of the five Brazilian regions. The area planted for industrial purposes reached 1.7 billion hectares and the preserved forests occupied an area of 2.7 million hectares. Cellulose and paper exports amounted to US$ 5.8 billion and the balance was around US$ 4.1 billion.
The cellulose and paper sector created approximately 110,000 direct jobs and 500,000 indirect jobs in 2007, and the total in tax collection exceeded R$ 2.1 billion. Over the last ten years, US$ 12 billion were invested in increasing the production capacity and in building other industrial plants (BRACELPA, 2008).
The main characteristics of the Brazilian cellulose industry are the barriers to entry, which may be natural barriers given the specificity of the industry (PINDYCK & RUBINFELD, 2006).
The economies of scale represent a barrier to entering the cellulose sector. These economies allow the largest producer to offer a product at a more competitive price. 3.2 Brazilian cellulose industry concentration
The results obtained refer to the cellulose industry concentration as a whole, without considering where the production is delivered to.
'
1
1 ln
ln
n
i i
i
E s s
The data available does not allow the calculation of the concentration due to the amounts of production that each company allocates for the integration, internal, and external markets. Therefore, it is impossible to state that the concentration obtained is higher or lower, for instance, than the one based on the cellulose market parameters.
Nevertheless, authors such as Leite & Santana (1998) and Montebello (2006) also used the global cellulose production as a variable in order to calculate the concentration.
3.2.1 Concentration Ratio of the four and eight largest companies
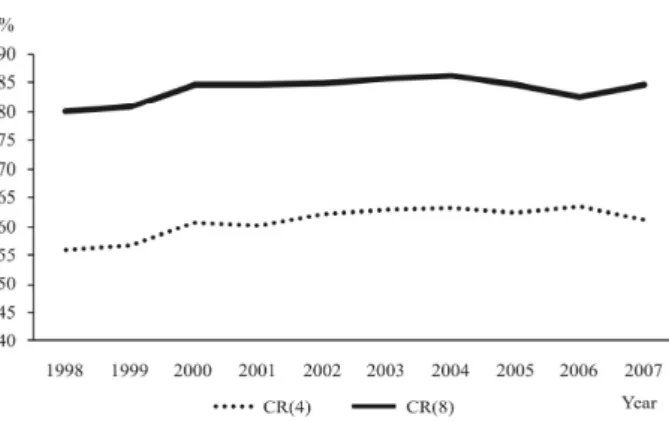
Figure 1 shows the concentration of the four largest companies, which rose during almost the entire period analyzed, except in 2001, 2005, and 2007.
Source: research results (prepared by the authors). Fonte: resultados da pesquisa (preparado pelos autores).
The increase in concentration observed in the period was due to the production expansion and, consequently, to the companies’ higher market share, as in the case of Aracruz Celulose, which launched its third production unit in 2002.
The acquisition of manufacturing plants also caused an impact on the concentration of the sector. The purchase of Riocell in 2003 by Aracruz Celulose and Bahia do Sul by Suzano Papel e Celulose in 2001 stand out.
In 2001, there was a 0.69% reduction in cellulose production, which was partially justified by international
market prices then. As a result of the price reduction, the production of the four largest companies was also lower. The decline in the production of Aracruz Celulose and Klabin reached approximately 2.5% and 1.23% respectively. The remaining companies, Suzano Papel e Celulose and Cenibra, reduced their production by about 1.3% and 3.14%. Thus the concentration of the four largest companies decreased as compared to the concentration in 2000.
In 2005, Aracruz Celulose increased its market share by 4% within the group of four companies. The production of the company was 11.55% higher than in 2004.
The remaining three companies presented a lower market share. While the total increase in cellulose production rose approximately 7.5%, the production of Votorantim Celulose e Papel, the second largest producer in 2005, decreased 0.29%.
The production growth rate of Klabin and Suzano Papel e Celulose did not follow the pace of the global Brazilian cellulose production. The production growth rate of these companies remained at 3% and 5.5% respectively. The 2005 increase in production is associated primarily with the entry of Veracel in the market, which in its first year already held 2.09% of the total production and pushed the concentration measured by the CR (4) index down.
The reduction of concentration in 2007 is due to the lower market share of three of the four largest companies. Aracruz reduced its production by 0.14%, which resulted in a 6.86% cut in the company’s market share. Similarly to what took place in 2005, two companies increased their production, although they did not follow the pace seen in the global Brazilian cellulose production. The increase in the total production reached 7.31%, whereas the increase in production of Votorantim Celulose e Papel and Klabin remained at 0.98% and 6.16%, respectively. Suzano Papel e Celulose was the only company to follow the total production pace of around 10%.
The concentration of the eight largest companies rose from 1998 to 2004. As of 2005, it fell, but picked up in 2007 in relation to 2006, although not as much as in 2004. The same reasons that increased the concentration measured in the four largest companies can be associated with the analysis of the CR (8) index. The purchase of Grupo Champion by International Paper, one of the world’s largest paper and cellulose companies, is an example of the acquisition process.
Figure 1 – Evolution of Concentration of the four and eight largest cellulose companies.
The drop of the CR(8) index can be related to a reduction in the companies’ market share, as previously mentioned. In 2005, Aracruz Celulose and Ripasa were the only two out of the eight companies to increase their share in the total production. In 2006, only three companies managed to follow the same trend.
In some cases, the CR(4) and CR(8) indexes present different trends. In 2001, the CR(4) index fell, whereas the CR(8) rose. These indexes’ opposing trends are a result of the fluctuation in production of the four and eight largest companies.
There was a decline in the production of the four largest companies in this period. Nonetheless, three out of four companies, in the universe of the eight largest, showed increased production. The production of Votorantin Celulose e Papel was around 1% higher and that of International Paper do Brasil, which was 2.92%. If, on the one hand, the production of Ripasa was 1.56% lower, on the other, the production of Jarí Celulose was approximately 12% higher.
According to Bain’s guidelines (1959), the concentration of the four largest companies during the period in question can be considered moderately high, since it remained between the interval of 50% and 65%. The concentration of the eight largest companies remained between 70% and 85%, which is also moderately high in most of the years analyzed. The concentration in 2003 and 2004 can be considered high because figures remained above 85% and below 90%.
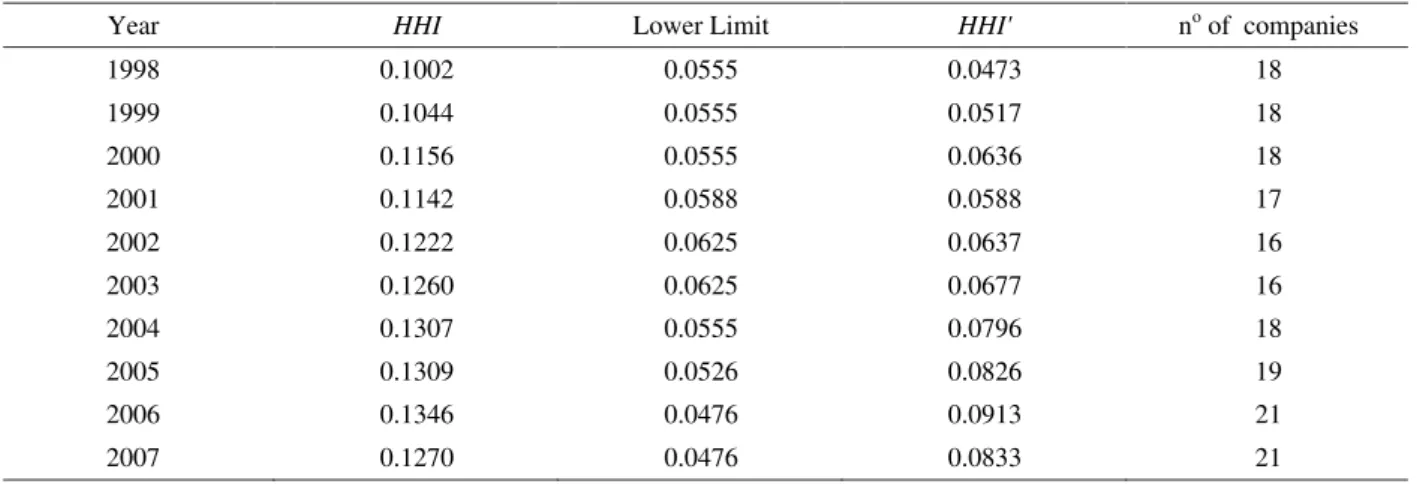
3.2.2 Concentration according to the HHI and HHI’ indexes Table 1 shows the indexes and the number of companies for the interpretation of the HHI and HHI’ index results. Companies with low market shares were not taken into account, as they were grouped under the denomination
other companies.
Table 1 shows that the concentration measured by the HHI index, with the exception of the year 2001, rose steadily until 2006 and fell only in 2007. Likewise, the HHI’ index showed the same trend.
The number of companies remained constant between 1998 and 2000, even though the concentration increased, especially because the largest companies’ market shares grew. The HHI value moved further away from a point market homogeneity and towards the lower limit. The concentration measured by the HHI’ also showed an increase in the same period. In 2001, the decline in concentration measured by both indexes is associated with the largest companies’ reduction of production and an increase in the smaller companies’ production.
The concentration continued to rise in 2002 and 2003 in spite of the reduction in the number of companies and the rise of the index’s lower limit. The market share increase of Aracruz Celulose and Votorantin Celulose e Papel boosted the concentration increase.
The concentration continued to rise from 2004 to 2006. It is important to point out that the entry of Veracel in the market in 2005 did not reduce the concentration.
Year HHI Lower Limit HHI' no of companies
1998 0.1002 0.0555 0.0473 18
1999 0.1044 0.0555 0.0517 18
2000 0.1156 0.0555 0.0636 18
2001 0.1142 0.0588 0.0588 17
2002 0.1222 0.0625 0.0637 16
2003 0.1260 0.0625 0.0677 16
2004 0.1307 0.0555 0.0796 18
2005 0.1309 0.0526 0.0826 19
2006 0.1346 0.0476 0.0913 21
2007 0.1270 0.0476 0.0833 21
Source: research results (prepared by the authors). Fonte: resultados da pesquisa (preparado pelos autores).
Table 1 – HHI index, HHI lower limit, adjusted HHI’ index and number of companies.
In 2006, the company was already ranked the seventh largest cellulose producer. The entry of Veracel caused a reduction in the HHI lower limit.
The concentration measured by the HHI and HHI’ indexes fell only in 2007, due to a lower market share of the largest companies, which were affected by a lower Aracruz Celulose production, and a higher market share of middle-sized companies such as International Paper do Brasil and Cenibra. 3.2.3 Concentration according to Theil’s Entropy Index
The market share of the companies classified as
other companies in Bracelpa’s statistical reports was not
taken into account.
Given the difficulty in verifying the variations in the concentrations through the Entropy Index when time intervals are analyzed, the adjusted Entropy calculation was developed (Table 2), as the variation in the number of companies affects both the index and its upper limit.
Both indexes showed a lower concentration in 2002, presenting a higher value in the entire series analyzed. This occurred especially because ten out of the sixteen companies analyzed reduced their market share.
The concentration measured by the indexes in 2003 was higher than in other years, even though the number of companies was lower. This increase in concentration can be associated with the increase in the production of Aracruz Celulose and Votorantin Celulose e Papel, approximately 34% and 40.6%, respectively.
The concentration went up between 1998 and 2001 as the Entropy dropped. However, the concentration falls in 2001 when the adjusted index is considered.
From 2004 to 2007, the Entropy increases, which does not mean that the concentration was necessarily reduced, since the index increases as the number of companies increases. Table 2 shows that the increase in the number of companies results in the increase of the index’s upper limit.
If the concentration increases as the Entropy moves further away from the upper limit, the concentration as of 2004 is higher than that of 2003. The difference between the Entropy and the upper limit in 2003 is equal to 0.60, whereas in 2004 the difference climbs to 0.63. In 2005, 2006, and 2007 the difference is 0.77, 0.70, and 0.69, respectively. This increase can be observed in the adjusted Entropy results of the same period.
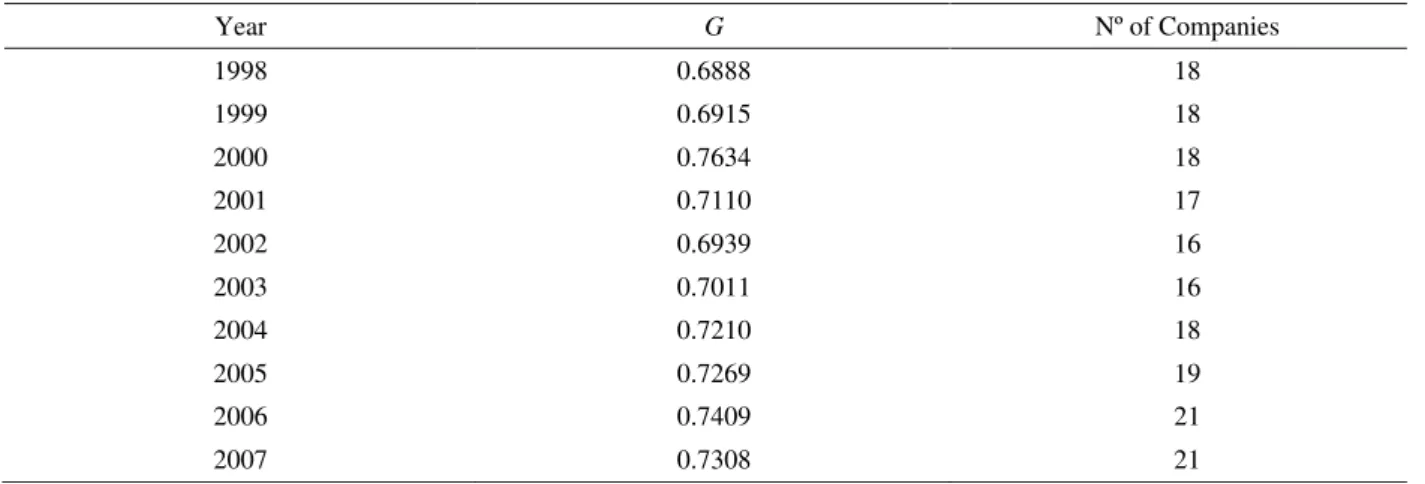
3.2.4 Industry inequality according to the Gini Coefficient The data in Table 3 shows that the inequality of the Brazilian cellulose industry increased over the period analyzed, even though it was lower in 2002 and 2007.
Inequality increased even though the number of companies remained constant between 1998 and 2000. Once again, the importance of increasing the production of companies such as Aracruz Celulose, Klabin, Suzano Papel e Celulose, and Votorantin Celulose e Papel stands out.
The reduction in the number of companies in 2001 and 2002 resulted in a lower inequality, whereas in 2003, this began to increase again. The entry of Veracel in the sector in 2005 increased the inequality even more. It only began to fall again in 2007.
Table 2– Entropy Index (E), E upper limit, Adjusted Entropy Index (E’), number of companies.
Tabela 2 – Índice de Entropia (E), limite superior de E, índice de Entropia ajustado (E’), número de empresas.
Source: research results (prepared by the authors). Fonte: resultados da pesquisa (preparado pelos autores).
Year E Upper Limit E’ nº of companies
1998 2.38 2.89 0.8234 18
1999 2.37 2.89 0.8200 18
2000 2.29 2.89 0.7923 18
2001 2.26 2.83 0.7977 17
2002 2.47 2.77 0.8909 16
2003 2.17 2.77 0.7827 16
2004 2.23 2.89 0.7715 18
2005 2.27 2.94 0.7709 19
2006 2.34 3.04 0.7686 21
Table 3 – Gini Coefficient (G) and the number of companies.
Tabela 3 – Coeficiente de Gini (G) e número de empresas.
Year G Nº of Companies
1998 0.6888 18
1999 0.6915 18
2000 0.7634 18
2001 0.7110 17
2002 0.6939 16
2003 0.7011 16
2004 0.7210 18
2005 0.7269 19
2006 0.7409 21
2007 0.7308 21
Source: research results (prepared by the authors). Fonte: resultados da pesquisa (preparado pelos autores).
The inequality can be considered medium or strong in 1998, 1999, and 2002, while in the other years it can be classified as strong or very strong. Although the objective of this work was not a study of the market structure, the results obtained indicate a low level of competitiveness in the Brazilian cellulose industry, at least in the domestic market.
4 CONCLUSIONS
The following conclusions are based on the previous analyses:
- results measured by any of the indexes show that the Brazilian cellulose industry is highly concentrated. All indexes used, CR(4), CR(8), HHI, and Theil’s Entropy
index, are high in spite of occasional fluctuations; - the inequality of the industry measured by the Gini index was considered high, confirming the initial hypothesis of the work, which is that the industry is concentrated;
- the high level of concentration observed leads to the assumption that there is a low level of competitiveness in the Brazilian cellulose industry.
5 BIBLIOGRAPHICAL REFERENCES
ASSOCIAÇÃO BRASILEIRA DE CELULOSE E PAPEL.
Relatório estatístico da BRACELPA. São Paulo, 2008.
ASSOCIAÇÃO BRASILEIRA DE CELULOSE E PAPEL. O
setor de papel e selulose: BCP-RM17/DEST, 2009. v. 2.
Disponível em: <http://www.bracelpa.org.br/bra/estatisticas/pdf/ booklet/marco2009.pdf>. Acesso em: 10 jun. 2009.
BAIN, J. Industrial organization. New York: J. Wiley, 1959. 274 p.
GINI, C. Variabilità e mutabilità 1912. In: PIZETTI, E.; SALVEMINI, T. (Eds.). Reprinted in memorie di metodologica statistica. Rome: Libreria Eredi Virgilio Veschi, 1955.
HERFINDAHL, O. C. Concentration in the steel industry.
1950. Thesis (Ph.D.) - Columbia University, Ney York, 1950.
HIRSCHMAN, A. O. National power and the structure of foreign trade. Berkley: University of California, 1945.
HIRSCHMAN, A. O. The Paternity of an Index. The American Economic Review, Pittsburgh, v. 54, n. 5, p. 761-762, Sept. 1964.
LEITE, A. L. S.; SANTANA, E. A. Índices de concentração na indústria de papel e celulose. In: ENCONTRO NACIONAL DE ENGENHARIA DE PRODUÇÃO, 18., 1998. Anais...
Disponível em: <http://www.abepro.org.br/biblioteca/ ENEGEP1998_ART158.pdf>. Acesso em: 15 set. 2008.
PINDYCK, R. S.; RUBINFELD, D. L. Microeconomia. 6. ed. São Paulo: Pearson Prentice Hall, 2006. 641 p.
POSSAS, M. L. Estruturas de mercado em oligopólio: economia e planejamento. 2. ed. São Paulo: Hucitec, 1999. 191 p. (Série Obras Didáticas).
RESENDE, M. Medidas de concentração industrial: uma resenha.
Revista Análise Econômica, Porto Alegre, v. 12, n. 21, p. 24-33, mar./set. 1994.
RESENDE, M.; BOFF, H. Concentração industrial. In: KUPFER, D.; HASENCLEVER, L. (Orgs.). Economia industrial: fundamentos teóricos e práticas no Brasil. Rio de Janeiro: Campus, 2002. p. 73-90.
REZENDE, J. L. P.; COELHO JUNIOR, L. M. BORGES, L. A. C. Madeira e derivados: oportunidades do Brasil no mercado internacional. In: OLIVEIRA, J. T. S.; FIEDLER, N. C.; NOGUEIRA, M. (Eds.). Tecnologias aplicadas ao setor madeireiro III. Jerônimo Monteiro: Suprema, 2008. p. 11-42.
REZENDE, J. L. P.; COELHO JUNIOR, L. M.; OLIVEIRA, A. D. Economia florestal mineira vis-à-vis economia florestal brasileira. In: SEMINÁRIO SÓLIDOS DE EUCALIPTO: AVANÇOS CIENTÍFICOS E TECNOLÓGICOS, 2002, Lavras.
Anais... Lavras: UFLA, 2002. CD-ROM.