Tanya Araújo & Francisco Louçã
The Seismography of Crashes in Financial Markets
WP 005/2007/DE/UECE _________________________________________________________
Departament of Economics
W
ORKINGP
APERSISSN Nº0874-4548
School of Economics and Management
The Seismography of Crashes in Financial
Markets
Tanya Ara´
ujo
∗and Francisco Lou¸c˜a
†Research Unit on Complexity in Economics (UECE)
ISEG, Universidade T´ecnica de Lisboa
January 19, 2007
Abstract
This paper investigates the dynamics of stocks in the S&P500 for the last 33 years, considering the population of all companies present in the index for the whole period. Using a stochastic geometry tech-nique and defining a robust index of the dynamics of the market struc-ture, which is able to provide information about the intensity of the crises, the paper proposes a seismographic classification of the crashes that occurred during the period. The index is used in order to inves-tigate and to classify the impact of the twelve crashes between July 1973 and March 2006 and to discuss the available evidence of change of structure after the fin de sicle.
Keywords: financial markets, stochastic geometry, complexity, market spaces, market structures.
JEL C0, G1
1
Introduction
The nature of financial crashes has been intensely discussed for long. Re-cently some new methods are being used to analyze and describe the dy-namics of changes in complex markets, based on different contributions from econophysics. This paper recurs to such methods and the available infor-mation on the trajectories of returns of dominating firms for three decades in order to propose new measures and a classification of the intensity of the crises. As a measure for these perturbations is defined, our investigation follows previous papers comparing them to ”economic earthquakes” [1, 2, 3, 4] and, in particular, the suggestion that the histogram of price changes for any stock is ”the analog of the Gutenberg-Richter histogram of earthquake magnitude” [1], developing a new strategy for the quantification and qualifi-cation of these extreme events. Inquiries into the statistical properties of this distribution suggest the existence of a hierarchical organization expressed as scale invariance over the history of the values of a control parameter [1]. Sec-tion 2 presents the method and measures, whereas SecSec-tion 3 summarize the results.
2
Method and Measures
The stochastic geometry strategy is simply stated in the following terms [5]:
1. Pick a representative set of N stocks and their historical data of re-turns over some time interval and, from the rere-turns data, using an appropriate metric, compute the matrix of distances between the N
stocks.
extract relevant information from the market, we have somehow to separate these two effects. The following stochastic geometry technique is used:
2. From the matrix of distances compute the coordinates for theN stocks in an Euclidean space of dimension smaller than N and then apply the standard analysis of reduction of the coordinates to the center of mass and compute the eigenvectors of the inertial tensor.
3. Apply the same technique to surrogate data, namely to data obtained by independent time permutation for each stock and compare these eigenvalues with those obtained in (2), in order to identify the directions for which the eigenvalues are significantly different as being the market characteristic dimensions.
In so doing, we are attempting to identify the empirically constructed variables that drive the market and the number of surviving eigenvalues is the effective dimension of this economic space.
4. From the eigenvalues of order smaller than the number of characteristic dimensions, compute the difference between eigenvalues in (2) with those in (3). The normalized sum of those differences is the index S, which measures the evolution of the distortion effect in the shape of the market space.
For both surrogate and actual data, the sorted eigenvalues, from large to small, decrease with their order. In the surrogate case, the amount of decrease is linear in the order number, proving that the directions are being extracted from a spherical configuration. The display of a uniform and smooth decrease in the values of the sorted eigenvalues is characteristic of random cases and is also experimentally observed when the market space is built from historical data corresponding to a period of business as usual.
Considering the lack of uniformity among the market effective dimensions we are able to characterize the extent to which crashes act differently on specific directions, causing changes in the shape of the market space. Looking for relevant distortions in the shape of the S&P500 market space through the last 33 years, we found that amongst the highest values of the index are those computed for some important dates, as 19th October 1987, 27th October 1997 and 11th September 2001.
r(k) = log(pt(k))−log(pt−1(k)) (1)
a normalized vector
−→ρ(k) = −→r(k)−h−→r(k)i
q
n(hr2(k)i−hr(k)i2) (2)
is defined, where n is the number of components (number of time labels) in the vector−→ρ. With this vector one defines the distance between the stocks k and l by the Euclidian distance of the normalized vectors.
dij =
p
2 (1−Cij) = k−→ρ(k)− −→ρ(l)k (3)
as proposed in [6], withCijbeing the correlation coefficient of the returns
r(i),r(j) .
The fact that is a properly defined distance gives a meaning to geometric notions and geometric tools in the study of the market. Given that set of distances between points, the question now is reduced to an embedding problem: one asks what is the smallest manifold that contains the set. If the proportion of systematic information present in correlations between stocks is small, then the corresponding manifold will be a low-dimensional entity. The following stochastic geometry technique was used for this purpose.
2.1
The stochastic geometry technique
After the distances ( dij) are calculated for the set of N stocks, they are embedded in RD, whereD < n, with coordinates −→x(k). The center of mass
− →
R is computed and coordinates reduced to the center of mass.
− →
R = Σ−k→x(k)
k (4)
−
→y(k) = −→x(k)−−→R (5)
and the inertial tensor
Tij = Σk−→yi(k)−→yj(k) (6)
The characteristic directions correspond to the eigenvalues ( λi) that are clearly different from those obtained from surrogate data. They define a reduced subspace of dimension e, which carries the systematic information related to the market correlation structure. In order to improve the decision criterion on how many eigenvalues are clearly different from those obtained from surrogate data, a normalized difference τ is computed:
τ(i) =λ(i) + 1−λ′(i) (7)
and the significantly different eigenvalues are those to which τ(i)>1/2
2.2
Index of the market structure
As market spaces can be described as low dimension objects, the geometric analysis is able to provide crucial information about their dynamics. In previous papers, we developed different applications of this technique, namely for the identification of periods of stasis and of mutation or crashes. Indeed, market spaces tend to contract during crises along their effective dimensions, but each crisis may act differently on specific dimensions. It is in order to capture that distortion, namely the lack of uniformity along the market effective dimensions, that we defined the market structure index, S [5]. Since the largest f eigenvalues define the effective dimensionality of the economic space, at time t, we compute S as:
St= Σfi=1
λt(i)−λ′t(i)
λ′
t(i) = Σ
f
i=1
λt(i)
λ′
t(i) −1 (8)
where λt(1), λt(2), ..., λt(f) are the largest f eigenvalues of the market space and λ′
t(1), λ′t(2), ..., λ′t(f) are the largest f eigenvalues obtained from surrogate data, namely from data obtained by independent time permutation of each stock. In computingS, at a given timet, bothλt andλ′tare obtained over the same time window and for the same set of stocks.
3
Results and Discussion
The set of actual data consists in 231 stocks present in S&P500 from July 1973 to March 2006, considering all the surviving firms for the whole period. Although we acknowledge that this population does not necessarily represent the behavior of the whole economy, we consider the information useful enough to provide information on trends of the dynamics of market, as it includes a large part of the winners after a long period of competition. The next section proposes a classification of these crashes according to the value of S and using an inspiration from seismography.
3.1
A seismographic classification
An approximate value of the index S for the 1987 Crash, the Black Monday (BM), is taken as the higher value of a scale from 8BM down to 1BM, or S from 40 to 5. Market perturbations measuring less than 1BM are not considered to qualify as market crashes. Although this does not suggest any comparability or similarity of causes between earthquakes and financial crises, this procedure for classification and quantification in seismography [7] suggests a way of describing perturbations in speculative markets, since both kinds of shocks tend to occur in all magnitudes and may be described according to power laws.
3.2
The dynamics of crashes
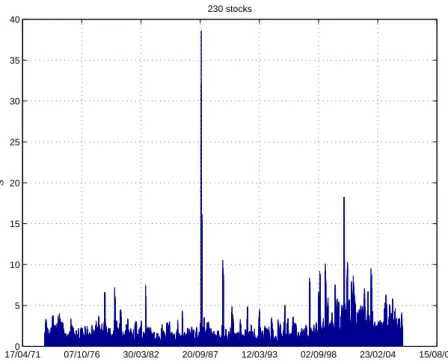
The results are presented in Fig.1, where the plot shows the daily values of
S for the 33 years period. We used a time moving window of 16 days on a market space including the 231 stocks. The highest values of S are marked on the plot.
The highest peaks are identified and correspond to the following crashes (chronological order):
1. October 1978, Iranian crisis
2. September 1979, Iranian crisis and second oil shock
3. August 1982, general recession
4. October 1987, the Black Monday
17/04/710 07/10/76 30/03/82 20/09/87 12/03/93 02/09/98 23/02/04 15/08/09 5
10 15 20 25 30 35 40
230 stocks
S
Figure 1: The evolution of the indexSmeasuring the evolution of the S&P500 structure for the surviving firms for 1973-2006
6. October 1997, the Asian crash
7. October 1998, the Russian crash
8. April 1999, the Japan crash
9. April 2000, Nasdaq
10. Dec.2000/Jan.2001, crashes in Argentina and Turkey
11. April 2001, the start of a world recession
12. September 2001, the terrorist attack against New York
13. July 2003, general recession
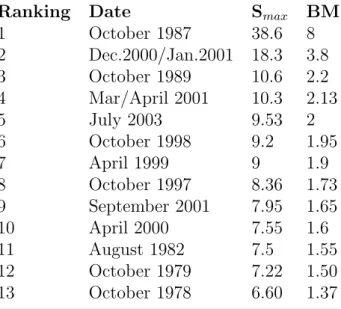
Table 1: Ranking of the crises according to Smax and BM ———————————————————–
Ranking Date Smax BM
1 October 1987 38.6 8
2 Dec.2000/Jan.2001 18.3 3.8
3 October 1989 10.6 2.2
4 Mar/April 2001 10.3 2.13
5 July 2003 9.53 2
6 October 1998 9.2 1.95
7 April 1999 9 1.9
8 October 1997 8.36 1.73
9 September 2001 7.95 1.65
10 April 2000 7.55 1.6
11 August 1982 7.5 1.55
12 October 1979 7.22 1.50
13 October 1978 6.60 1.37
———————————————————–
Along the whole period (33 years), the accumulated value of S (AS) is computed and the successive cumulative histories are presented in Table 2, the curve being drawn in Figure 2. In that figure, we measure the slope of the curve that better fitsAS for each year period, the slope quantifying each successively longer history. The following table shows the values of the slope for the histories obtained for each year.
Table 2: Slopes of the AS yearly fit ———————————————————–
Year Slope Year Slope Year Slope
1973 1.5 1974 2.1 1975 1.5
1976 1.2 1977 1.3 1978 2
1979 2 1980 1.5 1981 1.3
1982 1.7 1983 0.87 1884 1.4
1985 1.1 1986 1.3 1987 3.2
1988 1.4 1989 1.8 1990 1.7
1991 1.2 1992 1.1 1993 1.2
1994 1.1 1995 1.7 1996 1.4
1997 1.8 1998 2.5 1999 2.5
2000 4 2001 4.3 2002 3.2
2003 2.5 2004 2.6 2005 2.5
17/04/710 07/10/76 30/03/82 20/09/87 12/03/93 02/09/98 23/02/04 15/08/09 2000
4000 6000 8000 10000 12000 14000 16000
230 stocks
S
Figure 2: Accumulated values ofS and their yearly fit
3.3
Empirical evidence for the change of structure
Studying the cumulative history of the index of market structure (Figure 2), it is intuitive that a major change is occurring since around 1997, imposing a new dynamic structure. This intuition is now investigated by empirical means.
Figure 3 presents the empirical evidence for the concentration of seisms in the period after 1997.
17/04/71 07/10/76 30/03/82 20/09/87 12/03/93 02/09/98 23/02/04 15/08/09 −100
0 100 200 300 400
230 stocks
Σ S>1BM
17/04/710 07/10/76 30/03/82 20/09/87 12/03/93 02/09/98 23/02/04 15/08/09 0.2
0.4 0.6 0.8 1
S>1BM
Figure 3: Yearly fit of the slope of S (above) and Concentration of Crashes through the period (below)
described evolution suggests that the Clinton period of the ”Internet boom” corresponded to a new structure of the market or to emergence of a new phase of turbulence in the financial markets.
100 101 102 10−1
100 101 102
∆t
S(t+
∆t
)−S(t)
Hurst exponents: Time permuted(o) 1973−1997(.) 1997−2006(+)
Figure 4: Hurst exponents
References
[1] Stanley, EH, Amaral, LAN, Gopikrishnan, P, Ivanov, P, Keitt, TH, Pel-rou, V, 2000, Scale Invariance and Universality: Organizing Principles in Complex Systems, Physica A 281, 60-8
[2] Stanley, EH, Amaral, LAN, Gopikrishnan, P, Plerou, V, 2000, Scale Invariance and Universality of Economic Fluctuations, Physica A 283, 31-41
[3] Stanley, EH, Amaral, LAN, Gabaix, X, Gopikrishnan, P, Pelrou, V, 2001, Quantifying Economic Fluctuations, Physica A 302, 126-37
[4] Stanley, EH, 2003, Statistical Physics and Economic Fluctuations: Do Outliers Exist?, 2003, Physica A 318 279-92
[6] Mantegna, RN, Stanley, HE, 2000, An Introduction to Econophysics: Correlations and Complexity in Finance, Cambridge, Cambridge Uni-versity Press
[7] Gutenberg B, Richter, CF, 1954, Seismicity of the Earth and Associated Phenomenon, Princeton, Princeton university Press
[8] Mandelbrot, B, 1983, The Fractal Geometry of Nature, New York, Free-man
[9] Sornette, D, Knopoff, L, Kagan, Y, Vanneste, C, 1996, Rank-ordering Statistics of Extreme Events: Applications to the Distribution of Large Earthquakes, Journal of Geophysical Research Solid Earth 101 (B6), 13833-93
[10] Pacheco, JF, Scholz, CH, Sukes, LR, 1992, Changes in Frequency-Size Relationship from Small to Large Earthquakes, Nature 355, 71-3