Can embracing a Scrip Dividend Scheme foster individual shareholders' value? Endesa's case.
Miguel Costa Moedas
Project submitted as partial requirement for the conferral of Master in Finance
Supervisor:
Prof. Pedro Leite Inácio, Prof. Auxiliar, ISCTE Business School, Departamento de Finanças
I
Abstract
Dividend policy is the ultimate key decision that the management body has to hold. Eventually, this will have an impact on how shareholders will manage their wealth.
Until recently in Iberia, companies used an old-school approach to address this issue. Specifically, management would be the only decision-taker on whether the company would distribute its results or reinvest them in value-added projects.
With the emergence of a dividend reinvestment plan called scrip dividend, the company would get closer to their sole proprietors and would enable them to play a more important role in deciding how they want to receive their company’s earnings.
This project presents evidence on the consequences of introducing this scheme in the Spanish utility Endesa.
By letting shareholders assume command of such an important decision, management faces the risk of not being able to forecast accurately the consequences of such act, but would certainly introduce the possibility of improving the company’s financial situation by reducing th e outflows related to dividend payments.
II
Resumo
A política de dividendos é uma decisão da maior importância que a gestão tem de tomar.
Eventualmente, isto terá um impacto na maneira como os accionistas gerem a sua riqueza.
Até recentemente no mercado Ibérico, as empresas usavam um modelo antigo para abordar este assunto. Especificamente, a gestão era o único tomador de decisões no que se referia entre distribuir os resultados ou reinvesti-los em projectos de valor acrescentado.
Com o aparecimento de um plano de reinvestimento de dividendos chamado Scrip Dividend, a empresa ficaria mais próxima dos seus proprietários e dar-lhes-ia a possibilidade de terem um papel mais activo em decidirem como eles querem receber os resultados da sua empresa.
Este projecto apresenta evidência sobre as consequências da introdução deste esquema na utility espanhola Endesa.
Ao deixar os accionistas assumir comando de tão importante decisão, a gestão irá encontrar o risco de não estimar correctamente as consequências de tal acto, mas introduziria certamente a possibilidade de melhorar a situação financeira da empresa através da redução de fluxos externos relacionados com o pagamento de dividendos.
III
Acknowledgments
I am glad to thank Professor Pedro Inácio for his insights and comments. I am also grateful for the kind support of José, Deolinda and Carla.
IV Table of contents Abstract………..I Resumo……….II 1 Business Description……….1 2 Market Outlook………..4 2.1 Energy………4 2.2 Energy in Chile………..6 2.3 Energy in Peru………6 2.4 Enegry in Colombia………...6 2.5 Energy in Argentina………...7 2.6 Energy in Brazil……….7 2.7 Energy in Spain………..8 2.7.1 Demand………..8 2.7.2 Generation Mix………..8 2.7.3 Tariff Deficit………..9 3 Macroeconomics………..12 3.1 Latam………...12 3.2 Iberia………13
4 Mergers and Acquisitions: Anatomy of actions………..16
5 Comparable Valuation……….19
6 Valuation Methodology………...22
6.1 Sales and Ebitda………...22
6.2 D&A, Other Impairment, Capex and Working Capital………...23
6.3 WACC………..26
7 Risks to Valuation………30
V 7.2 Capex………...30 7.3 Tariff Deficit………30 8 Financial Analysis………31 9 Analysts’ Opinion………41 10 Scrip Dividend……….42 11 Conclusion………...46 12 References………48
VI
List of Figures
Figure 1 – Breakdown of income by region (€k)………...………3
Figure 2 – $/MWh for US generation plants starting in 2017……….………..5
Figure 3 – Generation output by source and regime………..9
Figure 4 – Peer grouping with leading valuation metrics………..………..20
Figure 5 – Balance sheet common-size………...33
Figure 6 – Income statement common-size……….34
Figure 7 – Cost of capital vs. Return on invested capital………35
Figure 8 – Du Pont decomposition………..36
Figure 9 – Enterprise value by year and region (€m)………..38
Figure 10 – Cumulative discounted cash flow (€m)………38
Figure 11 – Analyst’s most recent target prices (€)……….41
List of Equations Equation 1 –Weighted average cost of capital……….26
Equation 2 –Capital asset pricing model formula………27
Equation 3 –Beta asset……….………27
Equation 4 –Beta equity………...27
List of Tables Table 1 – Number of customers by region (m)………..1
Table 2 – Percentage of customers by region………2
Table 3 – Market shares of Endesa in Latin America for the year 2012………...7
Table 4 – Net generation in 2011 for the Continental European Union countries (TWh)……….8
Table 5 – Maximum legal caps under initial Royal Decree and its amendment (€m)……….10
Table 6 – Peer grouping with leading valuation metrics……….19
Table 7 – Tangible assets according to balance sheet (€m)……….23
Table 8 –Intangible assets according to balance sheet (€m)………24
Table 9 –Other impairment common-size………...24
VII
Table 11 –Working capital as a cash flow perspective (€m)………...25
Table 12 – Levered and unlevered betas for power generation comparables………..28
Table 13 – Forecasted income statement (€m)………31
Table 14 – Forecasted balance sheet (m€)………...32
Table 15 – Projected liquidity ratios………33
Table 16 – Projected solvency ratios………...34
Table 17 – Projected profitability ratios………..35
Table 18 – Du Pont decomposition………..36
Table 19 – SOTP DCF model………..37
Table 20 – Scenario analysis………39
Table 21 – Standard dividend policy………...44
Table 22 – Scrip dividend implementation………..44
Table 23 – SOTP with complete scrip acceptance………...45
1
1 Business Description
Founded in 1944, Endesa, which has currently 92,06% of its share capital owned by its parent company Enel, is the largest electricity player in the Iberian peninsula and the biggest private utility operating in the Latin American region as measured by installed capacity.
Considering its vast portfolio of activities jointly with its global presence, Endesa became a company with high-quality know-how that can offer investors sustainable growth and assuring at the same time the highest commitment towards society and environmental issues.
Organically, its corporate structure is divided in four areas that cover Electricity, Gas, Renewables and other activities such as Real Estate and Mining.
As competition gets fierce and global economic outlook remains poor, Endesa struggles to keep pace and achieve decent metrics. In the last five years, installed capacity stayed nearly unchanged in the 40.000MW mark. On the other hand, generation output became unstable with maximum drawdown variations of almost 13%. 2012’s output of 141.434GWh was the second highest of the last five-year period. Nevertheless, this value is quite far from the output of both 2006 and 2007 (~185.000GWh). Many of these disparities come from the natural linkage between economic environment and energy use. Hence, the global meltdown serves as a good barometer for Endesa’s results.
Even though output figures are raising red flags, Endesa still managed to add new customers at a cumulative annual growth rate of 1,8% since 2007 until 2011. Its 25 million clients are located chiefly in the Latam countries (54%) and the remaining in Portugal and Spain (46%).
Table 1 – Number of customers by region (m)
Customers (m)
2007 2008 2009 2010 2011 Cagr (2007-2011)
Iberia 11,5 11,6 11,7 11,7 11,5 0,0%
Latam 12,0 12,4 12,9 13,3 13,7 3,4%
Total 23,5 24,0 24,6 25,0 25,2 1,8%
2 Table 2 – Percentage of customers by region
Customers (Geographical Presence)
2007 2008 2009 2010 2011
Iberia 49% 48% 48% 47% 46%
Latam 51% 52% 52% 53% 54%
Source: Endesa for data and author for computations
In 2012 poor results were presented. Although revenues were up 3,8% (2,2% in Iberia/ Other and 7,5% in Latam) this figure can be misleading if analyzed separately from the overall picture.
Ebitda for the whole company dropped 3,6% to 7.005 million euros. This was something that the Board of Directors was anticipating. According to the company’s CEO during the conference call for the 2012 results presentation, both regions had individual issues that weakened end of year earnings. Specifically, in Latam, the Chilean generation Ebitda was reduced by 37% due to the ongoing major drought (the biggest of the last years). As the generation operations in Chile were the most significant of the five Latam countries in 2011, this had clear impact on the overall amount. Nevertheless, the increase in the Colombian output (21%) counterbalanced the latter drop to a certain degree. For the distribution regulated business, earnings were pretty resilient. Altogether, Latam Ebitda was 3.209 million euros, down 1% year over year (y.o.y.).
In Portugal and Spain, Ebitda plummeted 6% to 3.796 million euros and was mainly explained by the impact of 313 million euros related to the new regulatory measures approved under Royal Decree 13/2012 and 20/2012.
Although the majority of its operational earnings come from its domestic market, Latin America complements the figures with the strongest upside potential in terms of expansion. In our valuation model we believe that this profit mix will remain valid at least until the beginning of the fade period. Notwithstanding these facts, it is expected that Latam earnings will intersect the ones coming from Iberia in a near future.
Albeit net income declined 8% to 2.034 million euros, if we take into consideration that in 2011 the company had an extraordinary capital gain on the sale of Endesa Servicios of 123 million euros, net income would have only declined 2%.
3 Figure 1 – Breakdown of income by region (€k)
Source: Endesa’s Management Report 2011 and 2012 0 5000 10000 15000 20000 25000 30000 35000 40000
Revenues Ebitda Net Income Revenues Ebitda Net Income
2011 2012
Income Breakdown by Region
Latam Iberia
4
2 Market Outlook
2.1 Energy
The underlying business of Endesa is one of the most exciting and probably the one that ultimately will have the largest impact at a global scale. Energy is per se a source of well-being, job creation and safety factor. Although not directly stated under the United Nations’ Millennium Development Goals, energy affects and plays a key role in the accomplishment of at least three of them: eradicating extreme poverty and hunger, ensuring environmental sustainability and developing a global partnership for development.
According to the European Commission in its Energy Statistical Pocketbook 2012, energy production was at its all-time high in 2008 and 2009. The United States of America, China and the EU-27 were the major consumers with nearly half of total consumption. As expected China presented impressive consumption with a cumulative annual growth rate of 5,6% since 1995 until 2009.
For the world’s electricity generation mix, fossil fuels are still being used as the easiest and cheapest source. Coal alone provided 40% of total generation in 2009. On the other hand, Renewables are pretty much attached to the role local governments want to play in sustainability. Contrary to common sense, the weight of Renewables in total generation output even declined from 1995 to 2009 (20% vs. 19%, respectively).
To that respect, especially in the European Union, and thus affecting the Portuguese and Spanish business of Endesa’s portfolio, measures are being increasingly planned in order to address the renewable side of energy.
On this matter, policymakers are setting targets that by 2020, 20% of the European Union States’ energy will be produced through renewable technologies. Furthermore, this will increase reliability of the European Parliament projections that assume a reduction between 80% and 95% on the CO2 emissions by 2050.
According to the Parliament, renewable energy development will eventually contribute to increase security of supply by shrinking fossil fuel consumption, introducing no risk of scarcity and by making the volatility in energy prices smoother as commodity-related energy share diminishes.
5
According to the 2012 European Renewable Energy Network study by the European Parliament, throughout Europe different geographical regions have clear advantages on the efficient use of certain technologies. For instance, wind power suits best northern countries, while those on the Mediterranean can profit from solar. Nevertheless, as we are talking about recently adopted technologies, countries still face the challenge to combine environmental sustainability with cost-effectiveness. Some infrastructure costs still add a great economic gap when compared to ordinary energy sources.
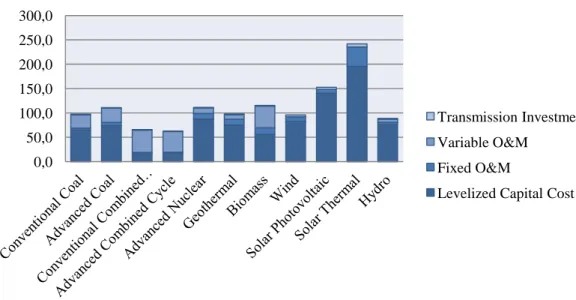
Due to country idiosyncrasies such as regulations and availability of resources, it is nearly impossible to compare overall costs of different ordinary and special-regime technologies. Nonetheless, the Energy Information Administration provides a list of expected levelized costs for new plants starting operating in 2017. Total costs are the sum of capital cost, fixed and variable operating costs, maintenance costs and investment in transmission. To this respect, Wind and Hydro present clear evidence on advantages over Solar whether it is thermal or photovoltaic.
Figure 2 – $/MWh for US generation plants starting in 2017
Source: U.S. Energy Information Administration (Levelized cost of new generation resources in the Annual Energy Outlook 2012) 0,0 50,0 100,0 150,0 200,0 250,0 300,0
$/MWh for plants starting operating in 2017
Transmission Investment Variable O&M
Fixed O&M
6 2.2 Energy in Chile
Chile has four different electricity systems that are divided according to a geographical basis. Northern Interconnected System (SING) and Central Interconnected System (SIC) are the major structures in terms of installed capacity and consequently the ones that serve the biggest portion of the population. The Aisén System and the Magallanes System had only 1% of the country’s 16.480 MW installed capacity in 2011.
Generation output (62.369Gwh) is on an upward trend with a CAGR of 3,2% from 2008-2011. According to the latest Comisión Nacional de Energía’s Informe Annual report, electricity is mainly produced by fossil fuels (42,3%) and Hydro (42,7%). The huge dependency on Hydro explains why companies’ earnings are so sensitive to weather conditions. Renewables account for less than 1%, but efforts were made to double installed capacity under the administration of former President Michelle Bachelet.
Endesa (E.Chile) has 35% of market share in the Generation business and 32% in the distribution segment (Chilectra).
2.3 Energy in Peru
Edegel is the Peruvian generation subsidiary. Edelnor is the distributor. There, Endesa has 28% market share in the generation unit and 19% in the distribution, covering over 1 million customers.
According to Osinergmin, the organism that is responsible for the supervision of the electric sector, in Peru generation state-owned companies (65%) still outnumber their private peers (35%). In total, 40 companies were operating in 2012. The system had a generation output CAGR of 6,7% since 2001 to 2011. It now stands at 35.000Gwh.
2.4 Energy in Colombia
The generation market of Colombia produced 58.628Gwh in 2011 (3% y.o.y.). According to the Ministerio de Minas y Energia in its Plan de Expansión de Referencia 2009-2030, last year’s growth rate will still lag behind the rates assumed in the two out of three best case projections. The Ministry is assuming that by 2030 electricity demand will be between 101.374Gwh and 133.812Gwh. Endesa is a privileged player to profit
7
from this situation as Emgesa currently has a 21% of market share and is the leading private player. For the distribution business, the company’s subsidiary Codensa has a market share of 25% and 2,7 million clients. It was mainly due to the strong fundamentals of the Colombian business that Endesa was able to sustain part of its Latam earnings despite the fragile Chilean Ebitda margin.
2.5 Energy in Argentina
Generation output in 2011 was 121.216Gwh, with a CAGR of 4,5% from 2002 to 2011. Last year, 61% of output was resulting from Thermo, 32% from Hydro and the remaining from other sources. From all technologies, Thermo more than doubled in the last 10 years, according to Cammesa.
Endesa has 17% market share in its generation unit and 19% in distribution. 2.6 Energy in Brazil
Endesa is a complete unknown in the huge Brazilian market. The company has 1% market share in the generation business and 5% market share in distribution. Still, Brazil is the most relevant Latam country for Endesa measured in number of clients.
According to the Ministério de Minas e Energia in its 2012 Balanço Energético
Nacional, total generation of 2011 was 531.758Gwh, representing a CAGR of 4,9%
since 2002. In the same report it is stated that 81,9% of generation comes from Hydro, making the other technologies nearly irrelevant when compared on a percentage basis.
Table 3 – Market Shares of Endesa in Latin America for the year 2012
Latam Market Shares (2012)
Distribution Generation Chile 32% 35% Peru 19% 28% Colombia 25% 21% Argentina 19% 17% Brazil 5% 1%
Source: Endesa Roadshow Presentation September 2012
8
2.7 Energy in Spain
For the last decade, the Spanish electricity system has been undergoing some important structural modifications. In point of fact, there are three key elements to focus on: demand, generation mix and tariff deficit.
2.7.1 Demand
According to the 2011 Red Eléctrica de España’s report on the Spanish electricity sector, the country’s electricity demand was the 4th largest in the European Union Continental Europe zone. Only Germany, France and Italy surpassed the Spanish demand of 254.800 GWh in 2011. Nevertheless, the Spanish demand was among the biggest drops between 2010 and 2011. Eventually, a broader picture must be presented to address this point. According to the EU Commission, generation in Spain increased at an impressive CAGR of 4% since 1995 until 2010. This represents one of the most interesting growth rates for the region during this time.
Table 4 – Net generation in 2011 for the Continental European Union countries (TWh)
Continental European Union Net Generation (2011) TWh TWh Germany 557,9 Greece 50,1 Austria 65,4 Netherlands 109 Belgium 85,1 Hungary 33,6 Bulgaria 45,1 Italy 289 Slovakia 26,5 Luxembourg 3,7 Slovenia 13,9 Poland 151,6 Spain 279,1 Portugal 48,4
France 541,9 Czech Republic 81
Romania 57
Source: REE Sistema Eléctrico Español. Author adjusted Spanish values to account for extra-peninsular generation. 2.7.2 Generation Mix
Spain has two generation regimes. The ordinary regime that is traditionally linked to the old generation technologies and the special regime that accounts for a very specific technology base such as renewables and plants under 50MW of installed capacity.
9
In 2012, under this scenario, 35% of total generation was produced by technologies operating under the special regime cap and the remaining 65% by ordinary regime plants. An interesting fact was that between 2011 and 2012 the output from ordinary regime was 2,6% lower. This was particularly true for Hydro (-30,9% y.o.y.) and Combined Cycle Gas Turbine (-22,2% y.o.y.). For the special regime, performance year over year rose 10,5% mainly due to Solar Thermo (84,4% y.o.y.) and Eolic (14,2% y.o.y.).
The generation mix has experienced tremendous advancements in a short period of time. According to the REE’s 2011 El sistema eléctrico español, output between the two regimes hadn’t been so balanced ever before. For instance, in 2007 80% of total generation was coming from ordinary regime and only 20% from special regime.
Figure 3 – Generation output by source and regime
Source: Data from REE’s Sistema Eléctrico Español 2011. Author for weights
2.7.3 Tariff Deficit
By embracing the European developments in the energy free market, the electricity system in Spain operates under a liberalized model since 2003. Yet, customers that meet capacity caps are eligible to choose to take part in the liberalized model or to have access to a regulated tariff called last resort tariff. In the past, these controlled prices were not sufficient to completely pay for the system costs and have put pressure on utilities by the accumulation of a tariff deficit. This clearly reduces earnings visibility.
14%
30% 24%
32%
Ordinary Regime Output Mix
Hydro Nuclear Coal CCGT and other 6% 45% 8% 2% 4% 35%
Special Regime Output Mix
Hydro Wind Solar PV Solar Thermo Thermo Renewable Thermo Not Renewable
10
The deficit is in its nature sporadic as the regulated tariff is calculated according to expectations. Deviations may, however, arise due to unexpected events that detach both real costs and effective paid cost. However, this does not hold completely true as it has been a structural deficit for some time and supported by different governments.
On the other hand, theoretically, some effort was done to reduce completely the tariff deficit. Royal Decree Law 6/2009 was published to legally set maximum yearly caps for the deficit amount. The law established decreasing yearly caps until 2012 and expected that no deficit would be generated 2013 onwards, meaning that tariffs would be enough to match costs. Still, the measure had minor practical application and has revealed mass discrepancies with projected outcomes. The document assumed the following tariff deficit: 3,5 thousand million euros in 2009, 3 thousand millions euros in 2010; 2 thousand million euros in 2011 and 1 thousand million euros in 2012. In reality, projections have had null credibility when compared with the real system deficit: 4,6 thousand million euros in 2009, 5,5 thousand million euros in 2010, 3,8 thousand million euros in 2011 and 4,2 thousand million in 2012.
Afterwards, a new RD 14/2010 was released, increasing the caps to 5,5 thousand millions euros in 2010, 3 thousand million in 2011 and 1,5 thousand million in 2012.
Table 5 – Maximum legal caps under initial Royal Decree and its amendment (€m)
Maximum yearly caps for Tariff Deficit
2009 2010 2011 2012 2013
RD 6/2009 3.500 3.000 2.000 1.000 0
RD 14/2010 3.500 3.000 3.000 1.500 0
Source: RD 6/2009 and RD 14/2010
In order to overcome the problem related to the receivables that are owed by the system to the utilities, it was created a specific vehicle that is regulated according to Royal Decree 437/2010. This vehicle, called FADE (Fondo de Amortizacíon del Deficit
Eléctrico), is a government backed up fund that will enable electricity companies to sell
their tariff deficit receivables and receive the capital accordingly.
Referring to the November 2012 Investor Presentation made by FADE, at 21/11/2012, there was an outstanding value to be collected by the utilities higher than 6
11
thousand million euros. From this value, Endesa held 44%, Iberdrola 35% and the remaining was spread between Gas Natural Fenosa, EDP and E.On.
12
3 Macroeconomics
3.1 Latam
Through subsidiaries, Endesa extends its operations to five Latin American countries (Argentina, Brazil, Chile, Colombia and Peru). Earnings coming from this region still lag behind the ones coming from the domestic market and it is assumed to remain that way for at least our explicit analytical period. Nevertheless, higher risks/returns in Latam are leveled by the stability of Iberian revenues. Hence, it presents the most exciting component of Endesa’s business.
From this group, every country is considered by the World Bank as being in the upper middle income bracket. This market segment has an exceptionally attractive upside potential that is currently fueled and will continue to be fueled with a strong pace by the organic driving force of population increase. According to the IMF World Economic Outlook Database in 2012, the population of these five countries was 332 million (4% higher vs. 2008). In 2017 it is estimated to surpass 348 million. Brazil, alone, will have at that time 58% of total regional population. Part of the equation comes from the improvement in overall safety and health conditions that have triggered the increase in life expectancy at birth since 1990. Chile is the country with the leading indicator which is in conformity with being also the most developed country of the group. Colombia, Brazil and Peru show very similar indicators and the smallest of the area (73 years).
Except for 2009 when the Latam countries struggled to maintain their attractiveness from a GDP increase point of view, they have performed pretty well during the ongoing global downturn. According to the most recent IMF estimates, only Brazil will have an increase lower than 2%. The remaining countries despite showing more modest rates when compared with previous years, still look like hidden gold if recalled the -1,54% of the Spanish economy. Looking as far in the future as the estimates allow us to go, Peru will lead the region with a yearly average increase of 5,97% on GDP. Colombia will show an average of 4,47%, Chile 4,57%, Brazil 4,11% and Argentina 3,79%.
13
On a more detailed view, GDP per capita is also sustained to some degree by a slight improvement on the percentage of population in working age. In 1995 the average value for the five country group was 60%. In 2010 it stood at 65,5%.
From the above mentioned figures, the working population of the five countries is split by the three main sectors according to a very close pattern. The majority works in a service-based industry (between 51,9% and 65,6%). The remaining weights are connected to country specifics. For instance, in Peru the primary sector is more relevant whether the secondary sector employs more people in Brazil, Colombia, Chile and Argentina.
Unlike Spain, where the model for work segmentation has been clear since 1995, for the Latam countries it has suffered drastic changes in the last 15 years. To this, much has contributed the prevailing efforts from improving quality and access to education. This has resulted in an average schooling years increase to 8,8 years in 2010 from 7,4 years in 1995. Eventually, this trend is likely to continue as developments progress resulting in an increase of disparities in the working segmentation model.
Despite a boosting economy, only Peru and Argentina managed to improve their unemployment rate (6,3% and 8,6% respectively in 2010). Nevertheless every country of the Latam group was able to show some decent advancement in their poverty reduction policy. To address this issue we should take a close look at the percentage of population living on 2$ or less a day. According to the World Bank data, in 2003 only Chile had a ratio under 7%. However in 2009, which is the latest year with available data for the five countries, only Colombia had a ratio above 6%.
During 2012, Chile was a key uncertainty to the Latam’s results as Ebitda margins were contracted due to a worse generation mix necessary to maintain generation output even with a strong drought affecting the country. Using the same data source from the University of East Anglia, we check that temperatures were nearly flat, but rainfall had a very pronounced drop. As in the case of Spain, Endesa has to bear the risk of using some technologies over hydro. This puts pressure in earnings quality.
3.2 Iberia
Spain is the natural market of Endesa. It is its core market and it is still its largest contributor on an Ebitda basis. Endesa refers to its European market as Spain and
14
Portugal and its organizational structure is settled to account for this fact. Nevertheless, although being the second largest operator in Portugal, the Portuguese segment is extremely narrow when compared to the whole company picture. As a matter of fact, according to the generation output of 2011, Portugal accounted for a mere 883 GWh, or 1%, of the total Iberian figure. For this fact, even though the Portuguese business is showing some interesting growth rates (17,7% in 2011), the materiality purpose of Iberia will be guaranteed by the analysis of the Spanish market solely.
Spain has been on the top of the watch list countries and a strong market opinion mover in the last years. Its weak economic data had put strong pressure in its 2011-elected government to see whether or not the country would ask for an international financial aid in order to meet its most current obligations. Although the country is not in a safe heaven by now, market attention is being transferred to the Italian similar situation.
Key economic data is very poor. IMF states that the GDP at constant prices suffered a cumulative decline of -3,45% from 2009 until 2011. Forecasts don’t bring good news either with the organization estimating a positive recovery not until 2014. Yet, Spanish GDP per capita is by far the most significant of all the markets where Endesa operates. It is estimated that GDP per capita will show a compound annual growth rate of 0,97% from 2012 to 2017.
Inflation, measured by consumer prices, is along with GDP one of the most reliable drivers of future utilities’ performance due to its obvious impacts on the overall economic forces. For Spain it is assumed to increase at an average value of 1,64% since 2013 until 2017.
The country has 46,3 million inhabitants and will probably grow at a slightly higher rate in the following 5 years than it did in the past 5 according to the IMF projections. Life expectancy at birth stands at 81,62.
Going deeper into the fundamentals, according to the World Bank the biggest portion of value added per worker is coming from the secondary sector with an estimated value of 80.812€/year for 2010. This shows an increase of nearly 16.000€ for the last fifteen years. In 2010, 23% of total population was employed in this sector. As for the tertiary sector, it is the only that showed an increase in the percentage of people
15
employed with 72,6%. This compares with 60,8% in 1995. Value added, on the other hand, has remained sufficiently stable.
The indicator of working age population has been unchanged for the last decade and stands at 68,2%. This raises some red flags when we recall that the unemployment rate is skyrocketing. The Spanish economy has long presented us astronomic unemployment indicators and the 2005 value of 9,2% looked like it had finally come to a more moderate situation. Surprisingly it was also the tipping point for an unprecedented move of more than doubling to current values.
Even though the Spanish government decreased very recently the incentives related to renewable technologies, it was one of the leaders in promoting these assets. This totally explains why it presents the 23th best rate of a total of 246 countries covered in the World Bank’s analysis of clean energy usage. Despite this, the country has the highest CO2 emissions rate of the Endesa’s portfolio with a value of 6,27 metric tons per capita in 2009.
Essential to the choice of generation mix and thus having great impact in generation margins, it is important to present some brief climate figures. According to data from the Climate Research Unit of the University of East Anglia, the average temperature has risen from 13,43º C (period 1960-1990) to 14,58ºC (period 1990-2009). Ultimately, this should be linked to the values of rainfall. From 1960-1990 the average rainfall (mm) was 63 and for the period of 1990-2009 it was 41,65, representing a drop of over 33%. Rising temperatures combined with lower precipitation volume puts tremendous pressure in hydro based technologies, increasing the need of usage of Coal or CCGT.
16
4 Mergers and Acquisitions: Anatomy of actions
Since its foundation in 1944 Endesa kept growing via merging with other companies. These modest takeovers ignited the expansion in capacity as well as improving its geographical presence. Moreover, they contributed as an easy and fast way to obtain the necessary know-how to operate newer technologies other than the initial Compostilla thermal plant.
The first decade of 2000 brought a new paradigm for shareholders. The company, after consolidating a diversified portfolio of assets, became the target of local and external competitors that were willing to enter or expand their business into the Iberian and Latam region.
In 2005, the then pre merged Gas Natural launched a takeover aiming to buy the company’s assets. The deal consisted of a direct cash offering of 7,34 euros for each share held, plus 0,569 new shares of Gas Natural. As it stood, the deal offered a premium of 19,4% as it quoted each share at 21,30 euros. Nevertheless, the Board of Directors immediately considered the offer as hostile and advised shareholders to not tender their shares. A month after, Endesa issued an investor presentation with the electrifying name of “Endesa: better project, better value”. Here, the company aimed to detail the reasons to not accept the takeover. The reasoning appointed the overall value as being insufficient as well as being paid with Gas Natural shares that were, according to financial analysts, overbought.
The rush to Endesa’s potential was only beginning. On February 2006, E.On, the German utility giant, presented the investor base with a counter-offer. The new deal would value Endesa at over 29 million euros or 27,5 euros per share, 29% higher than the first counterpart bid. If successful, the merge of the two companies would strengthen E.On position as the world biggest integrated energy company with over 50 million clients. Later the day the E.On offer was announced, Endesa’s management team released a document stating that although negotiations were on the way, the price did not accurately reflect the true intrinsic value of Endesa.
Both offers were awaiting regulatory approval by CNE. If any were to succeed, acquirers were required to sell some assets in order to overcome antitrust issues.
Later in 2006, Acciona decided to acquire a stake of 10% as a bridge to spread out to the electric sector. The price of 32 euros paid was at the time, higher than the
17
offers in place, 21,30 euros of Gas Natural and 27,5 euros of E.On. One day after, E.On decided to increase the deal price to 35 euros. In the meantime, Gas Natural cancelled its acquisition proposal which led E.On to raise once again the offer price to 38,75 euros.
The bigger picture started to become clear when Enel bought nearly 10% of Endesa at a price of 39 euros. Even though Enel took this action, a document was released and sent on the same day to the CNMV, the Spanish organism responsible to regulate the security services, making clear that Enel was not excluding the possibility of increasing its stake at Endesa, albeit keeping its venture below the one required to formulate a takeover. This statement remained true at least for two days. After this period, Enel did ask for permission to increase its position to a takeover level.
On the wake of these actions, E.On increased once again the offer to 40 euros, almost doubling the first move by Gas Natural.
It was with the partnership between Acciona and Enel that the final step was taken. An initial bid of 41 euros took the negotiations to an end.
Two years later, Enel became the solo major shareholder of Endesa with the acquisition of the 25% of the capital detained by Acciona.
Since those turbulent times are gone, there have been only minor deals, whether on the sell-side or buy-side.
Today Endesa is a company held in such a strong way by Enel that a possible acquisition seems very unlikely. This thought is led by both internal and external factors.
Internally, Enel showed strong passion towards Endesa’s assets from the beginning, making it clear firstly by the high price initially offered and ultimately by the purchase of Acciona’s stake. Synergies should be strong and a long-term commitment. This investment will not be sold unless Enel struggles to cut off debt or other potentially better priority comes on the way.
Externally, there doesn’t seem to be any likely candidate to assume compromise. Iberdrola have a very similar portfolio to Endesa’s. Besides, no interest was ever shown. Gas Natural desperately wanted to grow. This was revealed when it launched a takeover to Iberdrola, Endesa and Union Fenosa. Now, that the merge between Gas Natural and Union Fenosa led to Gas Natural Fenosa, the appetite for new acquisitions had ceased. Considering this argumentation the only potential acquirer, if any, should be a foreigner
18
one. However, looking at current macro data, Utilities are more focused in debt reducing activities and should not move out of this path.
To think that Endesa might turn to the market itself and start a new takeover wave is a rhetorical consideration. However one can argue that the company is fully spread in terms of technologies available as well as in geographic terms. The company should keep its focus on its home market and profit from the organic growth of the investments already in place in Latin America. Nevertheless, during the September’s 2012 roadshow, Endesa clearly stated that it had identified some M&A attractive targets and could take action in the short-term.
19
5 Comparable Valuation
To perform an analysis that would place Endesa relatively to its closest peers we decided to use a simple comparable approach. To do this, we decided to divide competitors according to business segment and regional presence. This peer grouping should serve as a proxy to Endesa’s business and it is presented as follows:
Domestic Peers: Gas Natural and Iberdrola. They account for the most direct competitors in the Spanish operations and also share some of the Latam risks. They should account for country specificities.
Foreign Peers: EDP, EDF, ENEL and E.On. They are some of the vertically integrated utilities operating in the nearest markets to Spain. In fact, some of them have operations in Spain as the case of E.On and EDP (HC Energia). They should account for business risks.
Network Peers: REE and Enagás. Although not being direct competitors, they share some of their underlying business characteristics with Endesa. Whether it is electricity transmission or natural gas transportation, the true nature of the transmission segment is regulated as for the case for distribution. They should account for the regulated side of Endesa’s assets.
For the multiples choice, we decided to use EV/Ebitda and P/E. They are two leading indicators and should lead to a direct valuation conclusion in terms of pricing and profitability.
Table 6 – Peer grouping with leading valuation metrics
Comparables EV/EBITDA P/E 2013 2013 Domestic Comps 6,53 10,22 Iberdrola 6,82 10,00 Gas Natural 6,24 10,44 Foreign Comps 5,89 8,52 EDF 4,62 8,38 ENEL 5,95 7,34 E.on 5,21 9,90 EDP 7,77 8,47
20 Network Comps 7,95 10,52 REE 8,38 10,71 Enagas 7,51 10,33 Comparables 6,56 9,45 Endesa 6,25 12,73 Premium to Domestic -4% 25% Premium to Foreign 6% 49% Premium to Network -21% 21% Premium to Comparables -5% 35%
Source: Bloomberg for peer data. Author for Endesa’s values and premium computations. Figure 4 – Peer grouping with leading valuation metrics
Source: Bloomberg for peer data. Author for Endesa’s values and premium computations.
EV/Ebitda and P/E yield close conclusions for end of 2013 values. More specifically, basing our analysis purely on these multiples, foreign comparables seem to be priced at discount when compared with its Spanish peers, both network and vertically integrated.
For the stock of Endesa, EV/Ebitda show mixed results, but generally in line with peer data. For the P/E stand alone analysis, Endesa seem to be a little overpriced. Being the price 12,73 times its earnings, when the average of its comparables is 9,45 might indicate that probably this values should converge in the near future. However,
4,00 5,00 6,00 7,00 8,00 9,00 10,00 11,00 12,00 13,00 14,00 4,00 5,00 6,00 7,00 8,00 9,00 P /E EV/EBITDA Iberdrola Gas Natural EDF ENEL E.on EDP REE Enagas Endesa
21
we cannot help but to speculate on this issue. The truth is that in terms of geographical presence, the comparable that most characteristics share with Endesa is Gas Natural Fenosa. Gas Natural has on a comparative basis one of the highest P/E of this peer comparing group. This might signal that companies with exposure to high potential regions (such as the Latam) should be priced at a premium in order to correctly address their risk/return profile.
Still, disregarding the fact that we are analysing a defensive sector such as the Utilities one, we are getting some pretty attractive historical metrics. For instance, Pu Shen (2000) compiled S&P500 data for 127 years and found that average P/E was 14,5.
22
6 Valuation Methodology
For our valuation model, we decided to obtain our equity value using a Discount Cash Flow approach. Specifically, in order to clearly reflect differences arising from business segments and regional presence, it was used a more detailed version of the DCF: Sum-of-the-parts.
The inputs of the units were the following: Generation, Distribution, Corporate Activities and Adjustments. These were considered both to Iberia and Latin America.
In addition, the model consists of a three-period breakdown. The analytical period runs from 2013-2015, the fade period from 2016-2025 and the perpetuity period starts in 2026. The analytical period is the most meticulous, where the FCFF is calculated using various assumptions computed on a year to year basis. The fade period assumes that for the 10-year period after 2016, FCFF will decrease at an exponential rate until it matches the growth rate assumed as a reasonable perpetuity value. Finally, perpetuity period includes all the cash flows generated at the constant rate of 0,5%. For the analytical period, we should highlight the main assumptions:
6.1 Sales and Ebitda
Utilities’ revenues are much linked to what the economy holds. This assumption was used as our base case scenario when forecasting future revenues at least in the generation business. For Latam, a more conservative approach was used since historically the GWh generated have been somewhat lagging behind the GDP growth rate adjusted for inflation. For distribution, remuneration formulas under Royal-Decree 222/2008 were used. For this, we also took into consideration the base values stated under Royal-Decree 13/2012.
Ebitda was obtained using different Ebitda margins. These margins were mainly computed using historical data and own judgment with respect to future forecasts. Recall that, for instance, weather conditions can have great impact on the technology choice and thus severely affecting Ebitda margins. This was the case for Chile in 2012 where Ebitda plummetted due to a weaker generation mix that was required during the drought period.
23
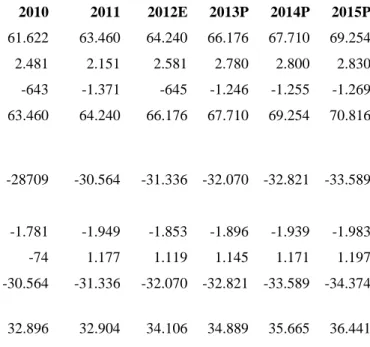
6.2 D&A, Other Impairment, Capex and Working Capital
Overall depreciation and amortization was obtained according to the average of prior years D&A rates and was multiplied by forecasted asset base. To achieve segment charges of D&A, we considered the average of prior years’ weights of individual segments.
Capital expenditures accounted for the investments in non financial assets and were based on management guidelines. In particular, the strategic plan for 2012-2016 assumes that during this period total capex charges would surpass 10 thousand million euros and would be evenly split for the Latam and Iberian region. To deal with individual operating unit charges, we took into consideration investment amounts made recently and future management plans.
The working capital item was considered into each segment according to most recent historical weights on individual sales to total sales.
Table 7 – Tangible assets according to balance sheet (€m)
Tangible Assets
2010 2011 2012E 2013P 2014P 2015P
Beg. PPE 61.622 63.460 64.240 66.176 67.710 69.254
Net additions Tangible 2.481 2.151 2.581 2.780 2.800 2.830 Other (include disposals) -643 -1.371 -645 -1.246 -1.255 -1.269
End. PPE 63.460 64.240 66.176 67.710 69.254 70.816
Beg. Acc. Dep -28709 -30.564 -31.336 -32.070 -32.821 -33.589 Depreciation &
Impairment -1.781 -1.949 -1.853 -1.896 -1.939 -1.983 Other (include disposals) -74 1.177 1.119 1.145 1.171 1.197 End. Acc. Depreciation -30.564 -31.336 -32.070 -32.821 -33.589 -34.374
Net PPE 32.896 32.904 34.106 34.889 35.665 36.441
Source: Endesa for actual data. Author for projections.
Since 2010 until 2012 net Property, Plant and Equipment grew at a CAGR of 1,8%. For the next three years, we are anticipating that this growth rate will stand at 2,2%. As depreciation rates are assumed to remain at historical levels, the growth will be fueled due to higher capital expenditures. We expect Capex to stay a little bit above
24
management guidelines since the deep reduction in its financial leverage might spur additional investments.
Table 8 –Intangible assets according to balance sheet (€m)
Intangible Assets
2010 2011 2012E 2013P 2014P 2015P
Beg. intangible 2.843 3.167 3.013 3.013 3.263 3.463
Net additions intangible 1.544 1.601 1.400 1.500 1.600 1.600 Other (include disposals) -1.478 -2.110 -1.400 -1.250 -1.400 -1.400 End. Intangible (Gross) 3.425 3.368 3.013 3.263 3.463 3.663
Amortization &
Impairment -258 -355 -241 -261 -277 -293
Net Intangible 3.167 3.013 2.772 3.002 3.186 3.370
Source: Endesa for actual data. Author for projections.
Net Intangible assets are expected to stay above three thousand million euros for the period concerning our analytical analysis. Those values related to net additions include CO2 emission rights and third-party agreements. Amortization will be kept at an historical rate of 8%.
Table 9 –Other impairment common-size
Other Impairment
2010 2011 2012E 2013P 2014P 2015P
Other Impairment -404 -308 -493 -308 -316 -325
As % of Sales -1% -1% -2% -1% -1% -1%
Source: Author for projections.
The charges with impairment losses have been 1% of sales for 2010 and 2011. Although in 2012 it raised a digit, we expect that impairment will continue to have a standard relation with revenues at the 1% level.
25 Table 10 –D&A and capital expenditure charges (€m)
D&A/ Capex 2010 2011 2012E 2013P 2014P 2015P D&A -2.443 -2.612 -2.587 -2.465 -2.532 -2.601 CAPEX 2.481 2.151 2.581 2.780 2.800 2.830 Intangible Investments 533 399 392 400 420 420 CAPEX + Int. 3.014 2.550 2.973 3.180 3.220 3.250
Source: Endesa for actual data. Author for projections.
On the wake of a better debt position, we feel that the company might be available to surpass its own Capex expectations until 2016. We anticipate that scenario in our base case and assume that from 2013 until 2015 total Capex charges will be 8.410 million euros. Intangible investments other that Carbon emission rights should remain nearly flat for the period of our analysis.
Table 11 –Working capital as a cash flow perspective (€m)
WC Computation 2010 2011 2012E 2013P 2014P 2015P Current Assets 7.238 6.723 6.780 6.953 7.131 7.348 Current Liabilities 9.824 8.219 8.889 8.917 9.143 9.478 NWC -2.586 -1.496 -2.109 -1.964 -2.012 -2.130 Δ NWC 1.090 -613 145 -48 -118
Source: Endesa for actual data. Author for projections.
For the working capital we assumed a cash flow perspective instead of the pure accounting one. Basically, for the current assets we only considered the non-cash and non-financial items. For the current liabilities a similar adjustment was made and was only considered the non-debt liabilities.
Taking into consideration this assumption, we estimate that inflows will continue to lag behind outflows and that changes over year won’t be that significant. Specifically, we expect the change in net working capital to be 145 in 2012, -48 in 2014 and -118 in 2015.
26
6.3 WACC
A perfect estimation of cashflows can deliver poor conclusions if not discounted with a reliable opportunity cost. For this purpose, a decent available tool to get the best estimate for the cost of capital is to compute Endesa’s current sources of capital and weight them accordingly.
For the cost of capital, the formula used was as follows:
Equation 1 –Weighted Average Cost of Capital
(1) Where,
wd = Weighted value of debt over total value
rd = Marginal cost of debt
t = Marginal tax rate
we = Weighted value of equity over total value
re = Marginal Cost of equity
For the D/E ratio that serves as an input for the debt and equity weights, it was used the D/E achieved in the last year of the explicit analytical period. As there is no public management guidance on this matter, D/E=0,3 is the best estimate available for the target capital structure.
The marginal cost of debt can be obtained by the Yield-to-Maturity approach or the Debt-rating approach. For the YTM, we would not get an accurate estimate as there is not a liquid and active market for Endesa’s bonds. On the same token, using a rating approach would be putting some external assumptions that would certainly bias the true cost of debt. Thus, none of these models was used. Instead, we decided to use the company’s cost of debt during the fiscal year 2012 and that was made public by the management during its consolidated results presentation. Even though different WACC’s were computed to address geographical and segment peculiarities, because the company has the possibility of financing as a whole, we assumed the cost of debt to be constant.
27 Equation 2 –Capital Asset Pricing Model formula
(2)
Where,
rf = risk-freerate
β = Sensitivity of Endesa’s stock to changes in the market return E(rm) = Expected return on the market
To achieve the beta input it was used a pure-play method. Hence, we got the unlevered betas for the European generation comparables and adjusted it to account Endesa’s financial leverage. The following formula was used:
Equation 3 –Beta Asset
(3)
Rearranged, we would get the following,
Equation 4 –Beta Equity
(4)
Where,
βequity = levered beta βasset = unlevered beta t = tax rate
D/E = Target Capital Structure
For the distribution business, Bloomberg does not have a specific database. We would tackle partially the issue if we considered the pure transmission players as they compete in a regulated segment. Nevertheless, we would be making some not so well reliable assumptions. Consequently, the unlevered beta for Endesa’s distribution segment also comes from the European peers on the overall utility segment. As comparables operate in both markets, it may be the best possible proxy.
28
The data collected from Bloomberg does not take into consideration all peers as Bloomberg wasn’t able to access all parameters:
Table 12 – Levered and unlevered betas for power generation comparables
European Power Generation Comparables
TICKERS
LEVERED
BETA Relative Index DEBT/EQUITY TAX RATE
UNLEVERED BETA
A2A IM Equity 0,812 FTSEMIB Index 1,458 0,247 0,387
ANA SM Equity 0,932 IBEX Index 1,718 0,287 0,419
ACE IM Equity 0,735 FTSEMIB Index 2,185 0,620 0,402
CEZ CP Equity 0,698 PX Index 0,879 0,170 0,403
EDPR PL Equity 0,822 PSI20 Index 0,744 0,337 0,551
ENA PW Equity 0,599 WIG20 Index 0,011 0,164 0,594
EGPW IM Equity 0,567 FTSEMIB Index 0,720 0,356 0,387 ENEL IM Equity 0,840 FTSEMIB Index 1,279 0,440 0,489
EDP PL Equity 0,976 PSI20 Index 1,764 0,230 0,414
EVN AV Equity 0,493 ATX Index 0,608 0,135 0,323
FUM1V FH Equity 0,785 HEXP Index 0,781 0,195 0,482
GAS SM Equity 0,872 IBEX Index 1,433 0,249 0,420
HNB NO Equity 0,241 OBX Index 1,384 0,350 0,127
IRE IM Equity 0,814 FTSEMIB Index 1,661 0,510 0,449
MVV1 GR Equity 0,126 DAX Index 1,145 0,317 0,071
PGE PW Equity 0,961 WIG20 Index 0,041 0,245 0,932
PPC GA Equity 0,982 FTASE Index 0,798 0,381 0,657
TPE PW Equity 0,779 WIG20 Index 0,313 0,232 0,628
VER AV Equity 0,597 ATX Index 0,845 0,280 0,371
Average 0,448
Source: Bloomberg (Function XLTP XUNB <GO>)
Then, as a way to formulate a decent judgement on the right beta to use, we decided to compare data provided by Damoradan (updated in January 2013). The average electricity utility unlevered beta 0,34. This does not raise red flags and corroborates that our βunlevered=0,448 might be a good hypothesis for the European utilities. Using our βasset formula we get that levered beta for Endesa would be:
29
The risk-free rate was the YTM on government debt. Here, a distinction was made between Spain and Latin American countries. Thus 4,9% corresponds to the Yield on 10y Spanish Bonds and 5,6% to the average of the bonds with the same maturity for the Latin American economies.
The last input of the CAPM equation, the equity risk-premium, was obtained by the research done by Dimson, Marsh and Staunton (2003) and that computed equity risk premiums from 1900 to 2002. For the Latin American business it was done an adjustment in order to reflect a higher degree of risk.
Hence, solving CAPM for the two regions we get the following:
and,
Finally, putting things altogether,
30
7 Risks to valuation
7.1 Margins
Margins are along with revenues the assumptions that can lead to major risks. This assumption can show some volatility and thus affecting final FCFF. They will be subject to changes in raw materials and force majeur events, namely unfavourable weather conditions. As commodity prices are subject to huge variances, there is some delay in being transferred to the electricity market itself.
7.2 Capex
As there is a publicly published strategic plan, analysts can base their research with a certain level of confidence in management projections. However, it should be used only as the most-likely case scenario. Since management team actions is more dependent on actual market conditions and not on stated policies, increases or decreases in the Capex level should be considered. For instance, lower net debt and willingness to increase Brazilian exposure may trigger additional investments. Ultimately, this should have an impact on the enterprise value for that region.
7.3 Tariff Deficit
The Spanish electricity system has experienced a systematic deficit for some time. As addressed in Royal Decree 6/2009, the government clearly expressed its intention to reduce this issue by setting maximum deficit yearly values. Theoretically, by 2013 deficit generated would be null. Looking back, we see that in reality these caps are not addressing the problem correctly. The situation is being eased by the securitization through FADE, however due to the increase of financial pressure the Spanish government may be forced to cancel current policies. This should be a key factor that contributes to weak earnings visibility because at any time Utilities may be called to increase its levels of debt and, consequently, to incur in higher than expected financial expenses.
31
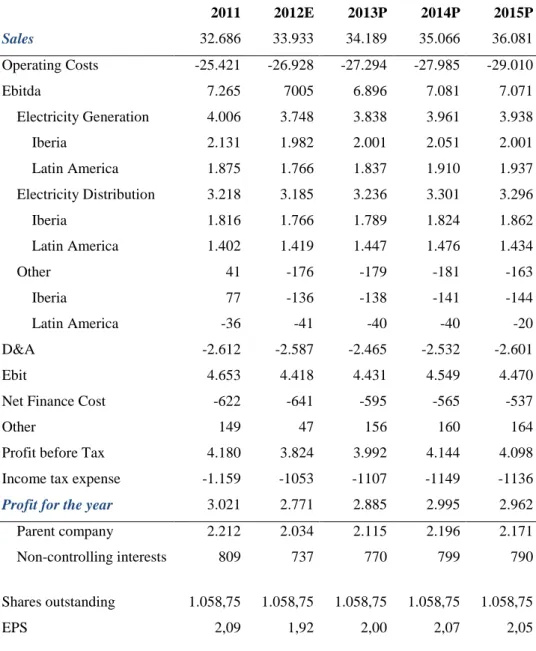
8 Financial Analysis
Table 13 – Forecasted income statement (€m)
2011 2012E 2013P 2014P 2015P Sales 32.686 33.933 34.189 35.066 36.081 Operating Costs -25.421 -26.928 -27.294 -27.985 -29.010 Ebitda 7.265 7005 6.896 7.081 7.071 Electricity Generation 4.006 3.748 3.838 3.961 3.938 Iberia 2.131 1.982 2.001 2.051 2.001 Latin America 1.875 1.766 1.837 1.910 1.937 Electricity Distribution 3.218 3.185 3.236 3.301 3.296 Iberia 1.816 1.766 1.789 1.824 1.862 Latin America 1.402 1.419 1.447 1.476 1.434 Other 41 -176 -179 -181 -163 Iberia 77 -136 -138 -141 -144 Latin America -36 -41 -40 -40 -20 D&A -2.612 -2.587 -2.465 -2.532 -2.601 Ebit 4.653 4.418 4.431 4.549 4.470
Net Finance Cost -622 -641 -595 -565 -537
Other 149 47 156 160 164
Profit before Tax 4.180 3.824 3.992 4.144 4.098 Income tax expense -1.159 -1053 -1107 -1149 -1136
Profit for the year 3.021 2.771 2.885 2.995 2.962 Parent company 2.212 2.034 2.115 2.196 2.171 Non-controlling interests 809 737 770 799 790 Shares outstanding 1.058,75 1.058,75 1.058,75 1.058,75 1.058,75
EPS 2,09 1,92 2,00 2,07 2,05
32 Table 14 – Forecasted balance sheet (€m)
2011 2012E 2013P 2014P 2015P
Assets
Non-current Assets 43.169 44.487 45.471 46.482 47.500
Property, plant & equipment 32.904 34.106 34.889 35.665 36.441
Investment property 74 88 80 80 80
Intangible assets 3.013 2.772 3.002 3.186 3.370
Goodwill 2.617 2.676 2.676 2.676 2.676
Investments accounted for using the equiry method 897 896 896 896 896
Non-current financial assets 1.821 1.965 1.965 1.965 1.965
Deferred tax assets 1.843 1.984 1.963 2.014 2.072
Current assets 15.552 14.291 14.674 15.215 15.906
Inventories 1.253 1.306 1.335 1.368 1.418
Trade and other receivables 5.470 5.474 5.618 5.763 5.929
Current financial assets 5.652 5.437 3.437 2.437 2.598
Cash and cash equivalents 2.788 1.986 4.196 5.559 5.872
Non-current assets held for sale and discontinued operations 389 88 88 88 88
Total Assets 58.721 58.778 60.145 61.697 63.406
Equity and liabilities
Equity
Net equity attributable to the company's equity holders 19.291 20.653 22.687 24.168 25.705
Non-controlling interests 5.388 5.716 5.716 5.716 5.716
Non-current liabilities
Deferred income 4.129 4.446 4.399 4.512 4.643
Non-current provisions 4.168 4.381 4.360 4.527 4.630
Non-current interest-bearing loans and borrowings 12.791 9.886 9.392 8.922 8.476
Other non-current liabilities 654 577 577 577 577
Deferred tax liabilities 1.993 2.354 2.228 2.285 2.352
Current liabilities
Current interest-bearing loans and borrowings 1.070 974 925 879 835
Current provisions 935 902 943 968 996
Trade payables and other current liabilities 8.219 8.889 8.917 9.143 9.478 Liabilities associated with non-current assets classified as held for sale 83 0 0 0 0
33
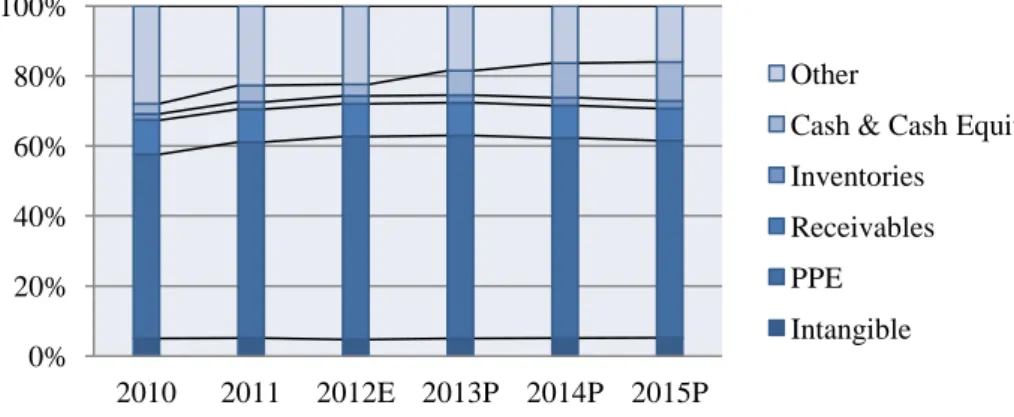
Assets common-size analysis does not bring any surprise. Plant, property and equipment will account for the biggest weight, making non-current assets at over 60% of total assets. On the wake on the tariff deficit schedule, we think the company will accumulate decent levels of cash until a better use is found. Consequently, this will help in reducing net debt.
Figure 5 – Balance sheet common-size
Source: Endesa for actual data. Author for projections.
The analysis can be supported by presenting some numbers. Namely, liquidity and solvency ratios might shed some light into our assumptions. Basically, Cash Ratio is expected to improve significantly from 2013 until 2015. By the end of our analytical period, it will be sufficient to cover 52% of total current liabilities. As stated, the single most important outcome of this situation will be the upgrading of the net debt ratios by an important deleveraging of company’s figures.
Table 15 – Projected liquidity ratios
Liquidity Ratios
2010 2011 2012E 2013P 2014P 2015P
Current Ratio 1,58 1,51 1,33 1,36 1,38 1,41
Cash Ratio 0,15 0,27 0,18 0,39 0,51 0,52
Source: Endesa for actual data. Author for projections. 0% 20% 40% 60% 80% 100% 2010 2011 2012E 2013P 2014P 2015P Other
Cash & Cash Equiv Inventories
Receivables PPE Intangible
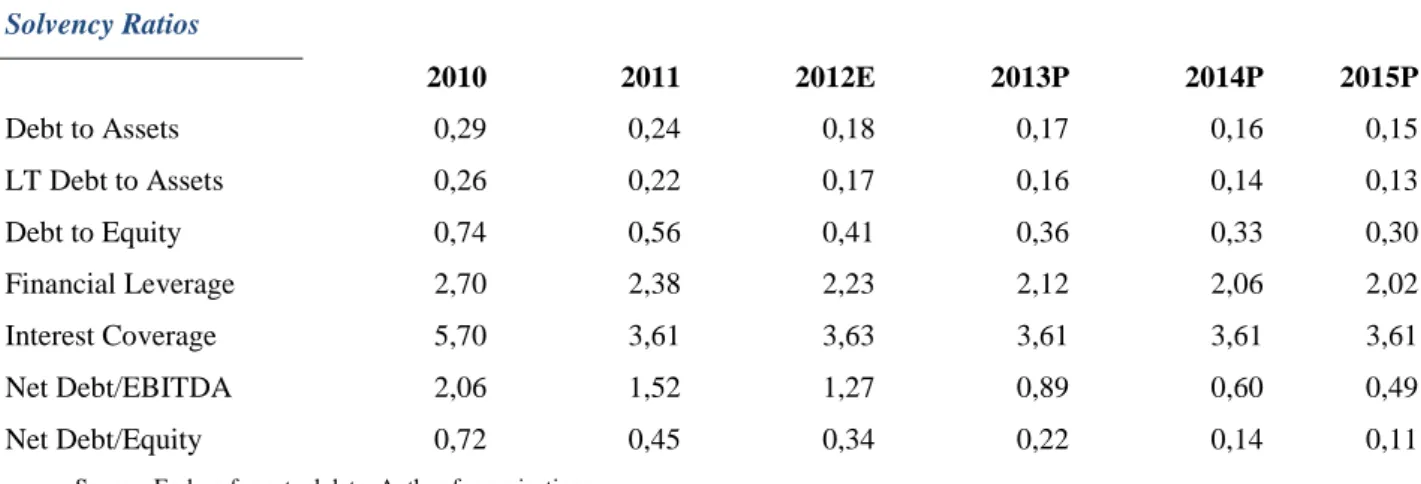
34 Table 16 – Projected solvency ratios
Solvency Ratios 2010 2011 2012E 2013P 2014P 2015P Debt to Assets 0,29 0,24 0,18 0,17 0,16 0,15 LT Debt to Assets 0,26 0,22 0,17 0,16 0,14 0,13 Debt to Equity 0,74 0,56 0,41 0,36 0,33 0,30 Financial Leverage 2,70 2,38 2,23 2,12 2,06 2,02 Interest Coverage 5,70 3,61 3,63 3,61 3,61 3,61 Net Debt/EBITDA 2,06 1,52 1,27 0,89 0,60 0,49 Net Debt/Equity 0,72 0,45 0,34 0,22 0,14 0,11
Source: Endesa for actual data. Author for projections.
For the income items, the only change we are anticipating is a tiny decrease in the amount paid as financial expenses. In 2013 this charge will be 595 million euros and will decrease to 537 by 2015. This effect will be exponentially reflected in the income statement common-size analysis because other items are expected to increase. Hence, financial expense weight will be reduced over 20% in relation to revenues.
Figure 6 – Income statement common-size
Source: Endesa for actual data. Author for projections.
Accordingly, as the model was considerably based on a revenue common-size approach, profitability ratios will be similar to the ones of actual data.
0% 20% 40% 60% 80% 100% 2010 2011 2012E 2013P 2014P 2015P Other Net Income Income tax Financial Expense Operating Costs
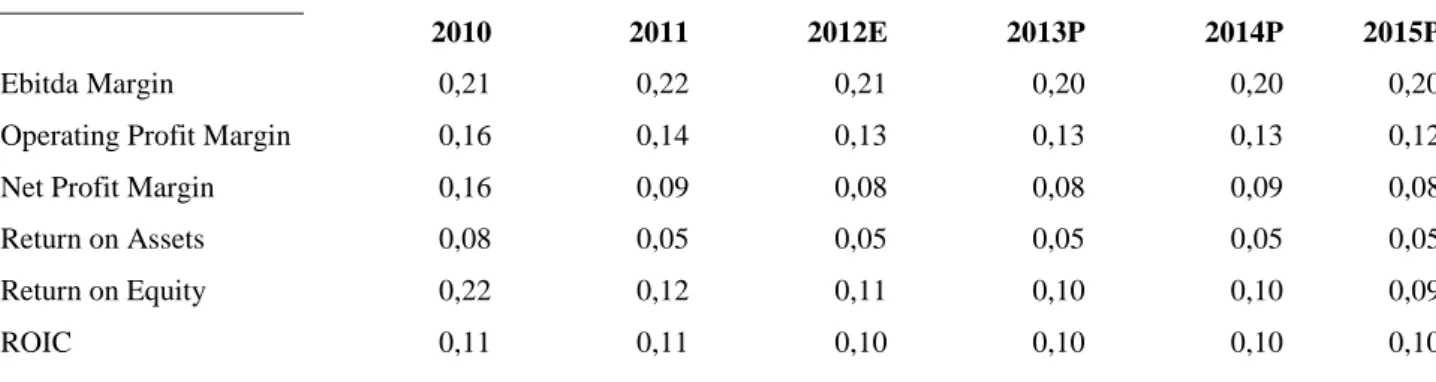
35 Table 17 – Projected profitability ratios
Profitability Ratios
2010 2011 2012E 2013P 2014P 2015P
Ebitda Margin 0,21 0,22 0,21 0,20 0,20 0,20
Operating Profit Margin 0,16 0,14 0,13 0,13 0,13 0,12
Net Profit Margin 0,16 0,09 0,08 0,08 0,09 0,08
Return on Assets 0,08 0,05 0,05 0,05 0,05 0,05
Return on Equity 0,22 0,12 0,11 0,10 0,10 0,09
ROIC 0,11 0,11 0,10 0,10 0,10 0,10
Source: Endesa for actual data. Author for projections.
By having the firm’s return on invested capital, this enables us to make a quick profitability comparison, by aggregating in the same chart what the company is returning with what the company has as a cost. Although not improving much, it has definitely a positive profitability cushion.
Figure 7 – Cost of capital vs. return on invested capital
source: Endesa for actual data. Author for projections.
By the same token, we can also make use of our model to build a DuPont decomposition. Return on assets will slightly decrease but will nevertheless be close to the 10% mark. This behaviour will be mainly led by the effect of financial leverage.
0,00 0,02 0,04 0,06 0,08 0,10 0,12 2010 2011 2012E 2013P 2014P 2015P ROIC WACC Latam WACC Iberia
36 Table 18 – Du Pont decomposition
DuPont Analysis
2010 2011 2012E 2013P 2014P 2015P
Operating Profit
Margin 0,161 0,142 0,130 0,130 0,130 0,124
Effect of Non Op Items 1,295 0,898 0,866 0,901 0,911 0,917
Tax Effect 0,785 0,723 0,725 0,723 0,723 0,723
Asset Turnover 0,498 0,557 0,577 0,568 0,568 0,569
Financial Leverage 2,702 2,379 2,229 2,118 2,065 2,018
ROE 0,221 0,122 0,105 0,102 0,100 0,094
Source: Endesa for actual data. Author for projections.
Or graphically:
Figure 8 – Du Pont decomposition
Source: Endesa for actual data. Author for projections. 0,000 0,500 1,000 1,500 2,000 2,500 3,000 2010 2011 2012E 2013P 2014P 2015P Operating Profit Margin Effect of Non Op Items Tax Effect Asset Turnover Financial Leverage ROE
37 Table 19 – SOTP DCF model
Sum-of-the-parts
Explicit Fade Terminal Asset 2014 2015
Segments €m €m €m €m €/share % Enterprise €m €m Comments EV/EBITDA13
Electricity Generation 5.142 12.367 12.705 30.214 28,54 0,70 30.243 30.273 7,9 Iberia 3.104 7.335 8.105 18.543 17,51 0,43 18.807 18.916 DCF@7,22%WACC 9,3 LatAm 2.038 5.032 4.601 11.671 11,02 0,27 11.962 12.188 DCF@8,78%WACC 6,4 Electricity Distribution 2.948 6.871 6.904 16.723 15,80 0,39 16.739 16.756 5,2 Iberia 1.582 3.914 4.360 9.857 9,31 0,23 10.009 10.120 DCF@7,22%WACC 5,5 LatAm 1.366 2.957 2.544 6.867 6,49 0,16 6.958 7.009 DCF@8,78%WACC 4,7 Other -642 -1.511 -1.660 -3.813 -3,60 -0,09 -3.817 -3.821 21,4 Iberia -449 -1.058 -1.162 -2.668 -2,52 -0,06 -2.697 -2.722 DCF@7,22%WACC 19,3 LatAm -193 -454 -498 -1.145 -1,08 -0,03 -1.046 -1.055 DCF@8,78%WACC 28,5 Enterprise Value 7.448 17.726 17.950 43.124 40,73 1,00 43.166 43.208 6,3 Net Debt -6.121 -5,78 -4.242 -3.439 L/T Provisions -4.360 -4,12 -4.527 -4.630 Minorities -5.716 -5,40 -5.716 -5.716 Equity Value 26.927 25,43 28.680 29.423 Nº of shares 1.058,75 1.058,75 1.058,75 Equity Value/sh 25,43 27,09 27,79 Source: Author.