BJRS
RADIATION SCIENCES
07-02B (2019) 01-10ISSN: 2319-0612 Accepted: 2019-06-18
Release of alpha emitters into the environment by
nuclear industries of Brazil in Resende
W. S. Pereira
a,b; A. Kelecom
c, R. Santos
a; M. F. M. Santos
a; V. R. M. Torres
a,
J. J. S. Rodrigues
a, C. M. Salgado
dand I. C. R. P. Valadão
baFábrica de Combustível Nuclear, Indústrias Nucleares do Brasil - FCN/INB, 27555-000, Resende, RJ, Brasil
pereiraws@gmail.com
bUniversidade Veiga de Almeida, 20271-020, Rio de Janeiro, RJ, Brasil cUniversidade Federal Fluminense, 24021-141, Niterói, RJ, Brasil
dDivisão de Radiofármacos/Instituto de Engenharia Nuclear, 21941-906, Rio de Janeiro, RJ, Brasil
otero@ien.gov.br
ABSTRACT
During its operation, the Nuclear Fuel Factory of the Nuclear Industries of Brazil (FCN/INB) may generate and disseminate particulate material. Therefor, aiming occupational control, a system of air exhaustion is installed equipped with a system of automatic detection of release of radionuclides into the environment. The present work aims to evaluate the radionuclides released by FCN, in terms of total release and activity concentration (AC). Along 2016, the amount of 4.14∙106 Bq was released, which means a mean of 3.45∙105 Bq.month-1. The largest mean for AC was 4.03
mBq∙m-3. The release data was almost an order of magnitude lower than the annual release limit established by the
regulatory agency, fixed at 1.2∙107 Bq.y-1, proving the adequacy of the atmospheric effluents to the licensing
requirements. The largest magnitudes of the two variables (AC and release) were observed in August while the smallest ones, in January.
1. INTRODUCTION
Nuclear installations can cause environmental radiological impact. Once they expose the workers and the surrounding population to radiation, they are considered practices and, therefore, regulated by the National Commission for Nuclear Energy (Comissão Nacional de Energia Nuclear – CNEN, in Portuguese). These practices are given by international organizations such as the International Atomic Energy Agency (IAEA) (IAEA, 2014a) and are followed by the Brazilian legislation, supervised by CNEN (CNEN, 2014a).
The IAEA establishes standards of environmental monitoring practices, which include generic environmental impact assessment models (IAEA, 2011a), monitoring standards (IAEA, 2005), public involvement in decision-making (IAEA, 2006), physical security (IAEA, 2014b; IAEA, 2016a), choice (IAEA, 2015) and assessment of sites for nuclear installation (IAEA, 2016b), beyond hydrological and meteorological standards (IAEA, 2011b), and standards to the monitoring of the facilities responsible for the storage of radioactive waste generated in practice (IAEA, 2014c). These international standards serve as a basis for CNEN’s national radiation protection legislation (CNEN, 2014a), nuclear licensing (CNEN, 2002), radiological environmental impact assessment and monitoring (CNEN, 2011), transport of radioactive material (CNEN, 1988), and management of radioactive waste (CNEN, 2014b), etc.
The Nuclear Fuel factory (Fábrica do Combustível Nuclear – FCN, in Portuguese) in Resende, RJ is responsible for four steps of the Nuclear Fuel Cycle: uranium enrichment, UF6 to UO2 conversion,
production of pellets, and fabrication of the fuel assemblies intended for energy generation in reactors of nuclear power plants. A fifth step, the conversion process, is being planned and is presently in technical and economic evaluation phase for its implementation.
In the pellet fabrication unit of Nuclear Fuel factory (FCN-II), open sources are manipulated when the enriched uranium, in powder form, passes through physical processes like compaction and sintering for its transformation into pellets. These procedures can lead to an atmosphere contamination condition inside of the facility. Thus, as part of the occupational safety, the plant has been designed to prevent the spreading of the dust to the outside of the facility. Beyond the containment there is an air exhausting system, which renews the factory atmosphere six times per
hour. It is composed by an air filtration system that ensures that the facility does not exceed the release limit of alpha emitters into the air, which is currently fixed by the regulatory agent at 1.2∙107
Bq.y-1. The present work aims to evaluate the release of alpha emitting radionuclides and the activity concentration (AC) released into the atmosphere by FCN during 2016.
2. MATERIALS AND METHODS
The system of exhaustion of the FCN-II possesses an air sampling system for the detection of alpha emitting particles present in the air. The equipment, from Thermo Scientific, is endowed of a radiation detector based on "Alpha Energy Range Discrimination" (AERD) system, and the counting method employs primary and secondary proportional counter tubes separated by a foil and an electronic evaluation system to optimize the detection of alpha emitters in the air.
The system collects samples of air from the chimney and counts in real time the AC of alpha emitters. Associated with it there is another system responsible for measuring the sampled airflow and, together, they allow the evaluation of the activity concentration, in mBq∙m-3, and the total
release of alpha emitting radionuclides, in Bq.
The AC values were tabulated and organized in monthly means, as well as the records of maximum and minimum values detected at the source. Using the airflow values, the emission values of alpha emitting radionuclides (Bq) were calculated, and then organized by monthly and annual release values. A statistical analysis of mean alpha emitters AC and monthly releases was performed aiming to obtain the temporal variations of the two variables, through analysis of variance (ANOVA) (ROSNER, 2000). The Tukey test was used to complement the evaluation, grouping the means by their magnitudes (SCHORK and REMINGTON, 2000; FERREIRA, 2008).
3. RESULTS AND DISCUSSION
The values of the descriptive statistics on data of the alpha emitter radionuclides released in to the air from the (FCN-II) are shown in Table 1 and Figure 1. The means of release values and the cumulative release variation during 2016 can be seen in Table 2 and Figure 2, respectively.
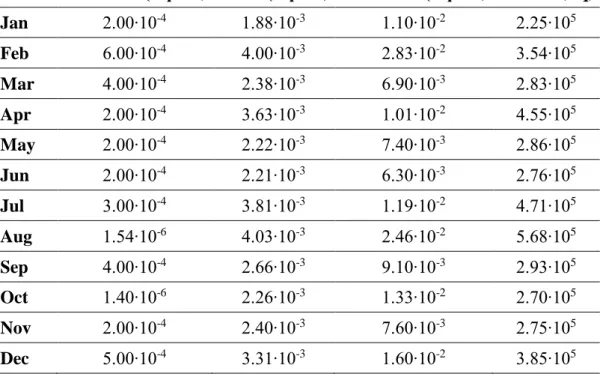
Table 1: Descriptive statistic of release of alpha-emitting radionuclides by FCN-II, during 2016. Month Minimum (Bq∙m-3) Mean (Bq∙m-3) Maximum (Bq∙m-3) Release (Bq)
Jan 2.00∙10-4 1.88∙10-3 1.10∙10-2 2.25∙105 Feb 6.00∙10-4 4.00∙10-3 2.83∙10-2 3.54∙105 Mar 4.00∙10-4 2.38∙10-3 6.90∙10-3 2.83∙105 Apr 2.00∙10-4 3.63∙10-3 1.01∙10-2 4.55∙105 May 2.00∙10-4 2.22∙10-3 7.40∙10-3 2.86∙105 Jun 2.00∙10-4 2.21∙10-3 6.30∙10-3 2.76∙105 Jul 3.00∙10-4 3.81∙10-3 1.19∙10-2 4.71∙105 Aug 1.54∙10-6 4.03∙10-3 2.46∙10-2 5.68∙105 Sep 4.00∙10-4 2.66∙10-3 9.10∙10-3 2.93∙105 Oct 1.40∙10-6 2.26∙10-3 1.33∙10-2 2.70∙105 Nov 2.00∙10-4 2.40∙10-3 7.60∙10-3 2.75∙105 Dec 5.00∙10-4 3.31∙10-3 1.60∙10-2 3.85∙105
Figure 1: Temporal variation of mean, minimum and maximum of activity concentration release of
alpha emitters by FCN-II, in mBq∙m-3, in 2016
0
0,005
0,01
0,015
0,02
0,025
0,03
Jan Feb Mar april may jun
jul aug sep oct nov dez
A
ctivi
ty c
o
n
cen
tr
atio
n
(
Bq/m3
)
Month
Table 2: Monthly release, cumulative release and annual release limit of alpha-emitting
radionuclides during 2016, in MBq.
Month Jan Feb Mar Apr May Jun Jul Aug Sep Oct Nov Dec Monthly release 0.23 0.35 0.28 0.46 0.29 0.28 0.47 0.57 0.29 0.27 0.28 0.39 Cumulative release 0.23 0.58 0.86 1.32 1.60 1.88 2.35 2.92 3.21 3.48 3.76 4.14 Annual release limit 12.00
The authorized release limit generates in the facility critical group the annual dose limit established in Brazilian legislation (1.2∙107 Bq∙y-1, equal to 0.3 mSv∙y-1). Since there is a directly proportional relationship between release and dose it is possible to estimate the monthly doses, as can be seen in Table 3. The estimated annual dose was approximately one third of the value established in the standard (CNEN, 2014a).
In addition to the annual release of alpha radionuclides emitted by the facility, the concentration of activity, in mBq.m-3, is a key variable in environmental radioprotection, since it allows estimating
the term source and its variation.
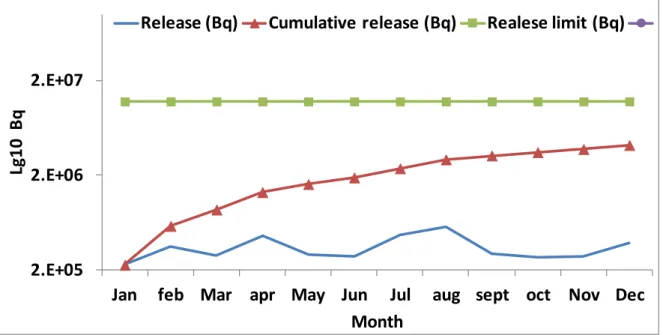
Figure 2: Monthly release, cumulative release and annual release limit of alpha-emitting
radionuclides in FCN-II during 2016, in lg10 Bq
2.E+05 2.E+06 2.E+07
Jan feb Mar apr May Jun Jul aug sept oct Nov Dec
Lg 1 0 B q Month
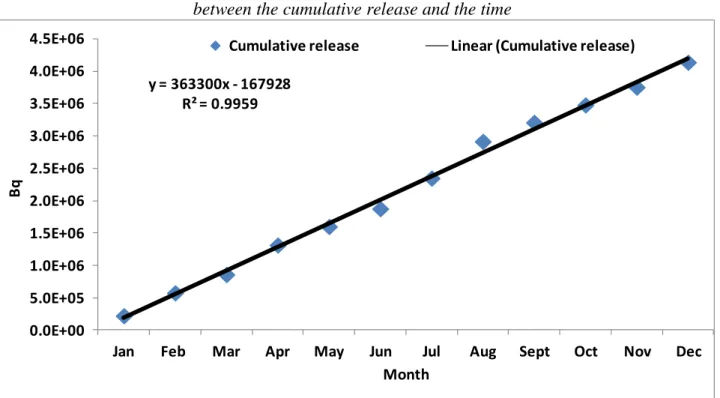
The mean monthly release was 0.364 MBq.month-1, is about 30 times lower than the annual limit defined by the regulatory authority, which is 12 MBq.y-1. The total release for 2016 was 4.14 MBq.y-1,which corresponds to less than half of the allowed release value. The accumulated release in the months showed a linear trend, as can be seen in Figure 3.
Figure 3: Variation of the release of cumulative release demonstrating the linear relationship between the cumulative release and the time
Table 3: Average monthly dose, cumulative dose and annual dose limit in the critical group due to
the release of alpha emitters by the FCN-II, in µSv.
Month Jan Feb Mar Apr May Jun Jul Aug Sep Oct Nov Dec Monthly dose 6 9 7 11 7 7 12 14 7 7 7 10
Cumulative dose 6 14 22 33 40 47 59 73 80 87 94 104
Dose limit 300
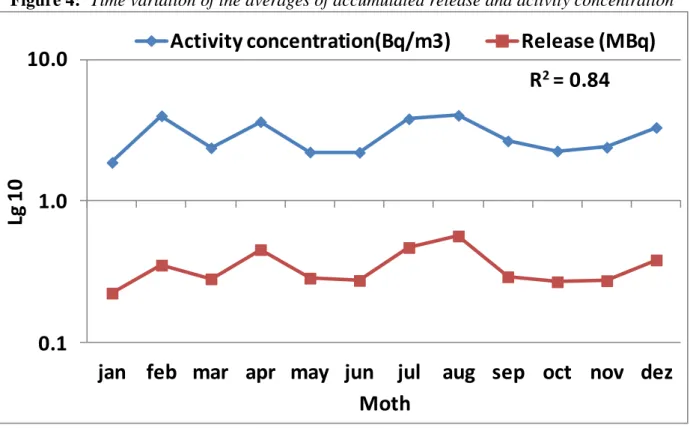
Evaluating the two variables studied, total release (MBq.month-1) and Activity concentration (in
mBq.m-3), a high correlation is verified (R2 = 0.84), which can be seen in Figure 4.
y = 363300x - 167928 R² = 0.9959 0.0E+00 5.0E+05 1.0E+06 1.5E+06 2.0E+06 2.5E+06 3.0E+06 3.5E+06 4.0E+06 4.5E+06
Jan Feb Mar Apr May Jun Jul Aug Sept Oct Nov Dec
Bq
Month
Figure 4: Time variation of the averages of accumulated release and activity concentration
Even with a high correlation when using the statistical analysis of the ANOVA test, followed by the Tukey test, for grouping the means, a slightly different behavior between the variables is verified. Evaluating the magnitudes of the means of the total release (in MBq), with the ANOVA, a variation in the mean values was identified. Tukey's test grouped the mean values into four main groups. The highest magnitude, composed by the months of August and July, followed by the group formed by April, December, February and September. The months of May, March, June, November and October were grouped per values of their monthly mean. Lastly, the month of January presented the lowest monthly average, see Figure 5.
When the AC (in mBq∙m-3) were evaluated, statistical differences were also found between the
monthly averages, as in the total release. The Tukey test organized the monthly means of AC differently than the total release. In the AC analysis, the months with the highest magnitude of averages were August and February, followed by July and April, and, then November, March, October, May and June. Lastly, the month of January presented a lower average magnitude of released activity concentration, as observed in the total activity released, see Figure 6.
0.1
1.0
10.0
jan feb mar apr may jun
jul aug sep oct nov dez
Lg
1
0
Moth
Activity concentration(Bq/m3)
Release (MBq)
Figure 5: Analysis of variance between the monthly mean release of radionuclides alpha emitters
and Tukey test for grouping the means
ANOVA:
For the comparison of the monthly mean release of radionuclides alpha emitters (MBq).
H0 H1
Result F Value P Value
µi = … = µj µi ≠ µj 10.04 < 0.01
Test of Tukey:
For grouping of the monthly mean.
Aug Jul Apr Dec Feb Sep May Mar Jun Nov Oct Jan 0.57 0.47 0.455 0.39 0.35 0.29 0.29 0.28 0.28 0.28 0.27 0.23
Means that do not share a same line are significantly different.
Figure 6: Analysis of variance between the monthly mean release in activity concentration and Tukey test for grouping the means
ANOVA:
For the comparison of the monthly mean release mean in activity concentration (mBq∙m-3).
H0 H1
Result F Value P Value
µi = … = µj µi ≠ µj 10.90 <<< 0.01
Test of Tukey:
For grouping of the monthly mean.
Aug Feb Jul Apr Dec Sep Nov Mar Oct May Jun Jan 4.03 4.00 3.81 3.63 3.31 2.66 2.40 2.38 2.26 2.22 2.21 1.87
Means that do not share a same line are significantly different.
4. CONCLUSION
The release of alpha radionuclides emitted by the FCN-II was below half of the limit set in standard, once the total release was 4.14 MBq.y-1 and the legal limit was 12 MBq.y-1.
The total release value is dependent on the activity concentration of alpha emitters in the factory atmosphere, as demonstrated by the high correlation between the variables.
Even with the correlation between the studied variables, the magnitudes of the total release and the concentration of activity have their own characteristics. The arrangement of the monthly averages of the two variables showed different sequences, as described:
For release
[(Aug = Jul) > (Apr = Dec =Feb =Sep) > (May = Mar = Jun = Nov = Oct) > (Jan)] For activity concentration
[(Aug = Feb) > (Jul =Apr) > (Dec = Sep) > (Nov = Mar = Oct = May = Jun) > (Jan)]
Statistical evaluations pointed to an important pattern, which presented the largest magnitudes of the two variables (concentration of activity and release) in August and the smallest ones, in January. Factors such as the industrial production of FCN-II, exhaust air flows and maintenance activities can be used to interpret the behavioral variations of the studied variables and should be the next focus of evaluation.
REFERENCES
IAEA - INTERNATIONAL ATOMIC ENERGY AGENCY, Environmental and Source
Monitoring for Purposes of Radiation Protection, Safety Guide, No. RS-G-1.8, Vienna, Austria,
IAEA, 2005. 136 p.
—, Stakeholder involvement in nuclear issues: INSAG-20, Vienna, Austria, IAEA, 2006. 16 p. —, Generic models for use in assessing the impact of discharges of radioactive substances to
—, Meteorological and hydrological hazards in site evaluation for nuclear installations, safety guide, no. SSG-18,Vienna, Austria, IAEA, 2011b. 172 p.
—, Radiation Protection and Safety of Radiation Sources: International Basic, Safety
Standards, General Safety Requirements Part 3. IAEA, Vienna, Austria: IAEA, 2014a. 441 p.
—, Safety of nuclear fuel cycle facilities, safety standards series, no. NS-R-5, Vienna, Austria, IAEA, 2014b. 123 p.
—, Monitoring and surveillance of radioactive waste disposal facilities, safety standards series, no. SSG-3.1, Vienna, Austria, IAEA, 2014c. 96 p.
—, Site survey and site selection for nuclear installations, Vienna, Austria, IAEA, 2015. 84 p. —, Safety assessment for facilities and activities, safety standards series, no. GSR part 4, Vienna, Austria, IAEA, 2016a. 63 p.
—, Site evaluation for nuclear installations, safety standards series, no. NS-R-3,Vienna, Austria, IAEA, 2016b. 38 p.
CNEN - Comissão Nacional de Energia Nuclear, Transporte de material radioativo,Rio de Janeiro, Brasil, CNEN, 1988. 88 p.
—, Licenciamento de instalações nucleares, Rio de Janeiro, Brasil, CNEN, 2002. 24 p.
—, Posição regulatória 3.01/008:2011, Programa de monitoração radiológica ambiental, Rio de Janeiro, Brasil, CNEN, 2011. 5 p.
—, Diretrizes básicas de proteção radiológica. Rio de Janeiro, Brasil, CNEN, 2014a. 22 p. —, Gerência de rejeitos radioativos de baixo e médio níveis de radiação, Rio de Janeiro, Brasil, CNEN, 2014b. 45 p.
ROSNER, B., Fundamentals of biostatistic. 1st ed. Stanford: Duxbury Thonson Learning, 2000. SCHORK, M. A. and REMINGTON, R. D., 2nd ed. Statistic with applications to the biological
and Health science. Prentice: Upper Saddle River, 2000.