Quim. Nova, Vol. 28, No. 2, 229-232, 2005
A
rti
g
o
*e-mail: [email protected]
MONOMER CONVERSION OF COMPOSITE DENTAL RESINS PHOTOACTIVATED BY A HALOGEN LAMP AND A LED: A FT-RAMAN SPECTROSCOPY STUDY
Luís Eduardo Silva Soares, Rick Rocha e Airton Abrahão Martin*
Instituto de Pesquisa e Desenvolvimento, Universidade do Vale do Paraíba, Av. Shishima Hifumi, 2911, 12244-000 São José dos Campos - SP
Antonio L. B. Pinheiro
Faculdade de Odontologia, Universidade Federal da Bahia, 40110-150 Salvador - BA Marcelo Zampieri
Departamento de Química, Universidade Federal de São Carlos, CP 676, 13560-970 São Carlos - SP
Recebido em 8/3/04; aceito em 12/8/04; publicado na web em 12/11/04
Eighteen circular blocks of resins cured either by a LED or a halogen lamp (20, 40 and 60 s), had their top (T) and bottom (B) surfaces studied using a FT-Raman spectrometer. Systematic changes in the intensity of the methacrylate C=C stretching mode at 1638 cm-1 as a function of exposure duration were observed. The calculated degree of conversion (DC) ranged from 45.0% (B) to 52.0% (T) and from 49.0% (B) to 55.0% (T) for the LED and halogen lamp, respectively. LED and halogen light produced similar DC values with 40 and 60 s of irradiation.
Keywords: composites; degree of conversion; FT-Raman spectroscopy.
INTRODUCTION
Resin composites represent a class of materials widely used in Restorative Dentistry because of patient demands for better aesthetics. These materials have substantially improved since the 1960s when they were first described1. Although light-cured composites are excellent for aesthetics procedures, both physical and chemical properties of filled resin composites are directly related to their degree of conversion (DC). Low DC lead to degradation, substance loss and fracture, and therefore limiting its lifespan2.
Adequate polymerization of composite resin restorative materials is fundamental for optimal physical and chemical properties, as well as, for best clinical performance3. However, when high molecular weight monomers, such as BisGMA or Urethane dimethacrylate (UDMA), is cured by visible light at oral temperature, there is always an incomplete conversion and, therefore significant concentration of remaining C=C bonds within the resin3. In addition to the unreacted monomer, additional unreacted structures may be present, from diluent such as triethyleneglycol dimethacrylate (TEGDMA) or si-milar substances. These unreacted components may be released from the filling, resulting in local tissue irritation and possibly an increased microleakage, which may lead, to recurrent caries and pulp irritation4. The most common curing device used to polymerize composite resins is the Halogen lamp emitting radiation in the deep blue region spectrum5. This output radiation (λ 400-500 nm) is highly absorbed by the composite resins, inducing heat on both the tooth and the resin during the curing process5,6. A typical degree of conversion (DC) of the Bis-GMA based dental resins exposed to a Halogen lamp ranges from 43.5 - 75.0% 7-10. However, the major drawback of this light source is its limited effective lifespan and that their optical power and spectral content degraded over time.
An alternative curing device that has been recently investigated to overcome the problems of Halogen lamp, is the solid state light
emitting diode (LEDs)3,6,11. LEDs used to polymerize composite resin operate in a wavelength around λ 470 nm and a bandwidth of about
λ 20 nm, therefore, having all the spectral purity for highly efficient
curing of dental resins with the additional advantage of preventing overheating5,7,12. Another advantage of LEDs is that the initiator of the polymerization reaction, the diketone Camphorquinone, has its maximum absorption at λ 470 nm3,5,6. Because of these advantages, LEDs have been broadly advertised in the market as an alternative curing source for composites resin. However, few informations exists concerning the ability of this type of light source to provide adequate monomer conversion during polymerization, as the isolated Methacrylate Carbon-Carbon double bonds are converted to an extended network of single bonds8. The study of the DC is funda-mental for the clinical application of the dental resins and, some methods such as microhardness and molecular vibrational techniques i.e., Raman Spectroscopy and Fourier Transformed Infrared Spectroscopy (FT-IR), have been used to perform this analysis9,13. Tarle et al.12, for example, studied by FT-IR Bis-GMA based resin composites polymerized by LEDs with 40 s of irradiation time. They reported a DC of about 65.4 and 54.9% on top surface and at the 2 mm depth, respectively. Yoon et al.3 studied three proprietary resin composites and found that the DC measured by FT-IR for those resins varied between 36.92 to 62.22%.
Dispersive Raman spectroscopy has also been used to monitor the degree of conversion of resin composites photo-activated by traditional Halogen lamp sources9,14 and Argon laser beam9, with the main advantage over the FT-IR techniques been no need of sample preparation, although it has high fluorescence signal.
The use of Raman techniques to determine the percent conversion requires that the amount of double bonds, which are present after cure, be quantified. In Bis-GMA/TEGDMA this measurement is made on a relative basis by comparing the height (or intensity) of the vibrational band of C=C at 1638cm-1 to the C=C aromatic ring stretching at 1609 cm-1, whose height (or intensity) does not depend of the polymerization process9,13,15,16.
230 Soares et al. Quim. Nova
by Shin et al.17, and the percentage of degree of conversion is then calculated by using the following equation:
DC (%) = 100*[1 – R cured / R uncured ] (1)
where R = band height at 1638 cm-1/band height at 1609cm-1 9,13,15,16,18. However, for an unknown dental resin, the percent conversion results will depend on the calibration mixture used to convert intensity ratios to mole ratio17.
Recently, a technique called FT-Raman spectroscopy has also been used as a tool for characterization of polymer systems19-21, with the advantage to be fluorescence free17. Although, DC of composite resin polymerized by LEDs has been previously studied by Fourier Transform Infrared Spectroscopy (FT-IR)3,7,22, the FT-Raman data are very scarce3,7,12,22 and, therefore, the need for further research in this field is evident.
In the present investigation, the FT-Raman Spectroscopy technique was used to evaluate the degree of conversion of composite resin photoactivated by both the LED source and the traditional Halogen lamp curing unit. This aspect is important to the dental practitioner because the LED is a relatively new tool for the curing of dental materials.
EXPERIMENTAL PART
A hybrid commercially available light-cured composite resin was used on this study (Z100®, shade A3, 3M Dental Products, St. Paul, MN, USA). This material consists of an organic (29%) and inorganic (71%) phase. The organic phase consists of BIS-GMA (40%) and TEGDMA (60%), whereas the inorganic phase is a mixture of amorphous Silica (SiO2) and Zirconia (ZrO2). This resin is well established in the market and is suitable for both anterior and poste-rior restorations.
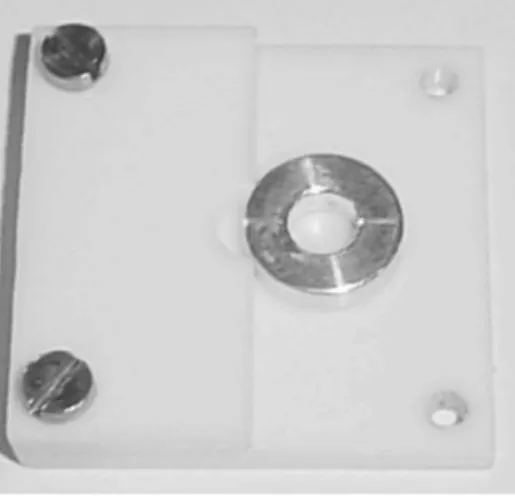
Eighteen resin composite specimens were prepared, with three specimens per exposure duration group. Aluminum rods of 6 mm in diameter and 3 mm in height were used to produce the composite resin blocks. The Aluminum rods were positioned on a white Teflon base to allow resin insertion into the rods (Figure 1). The uncured composite paste was compressed using a condenser and flattened. A Mylar strip (0.05 mm of thickness – Polidental Ltd., São Paulo, SP, Brazil) was placed over the top of the open end of the rod and pressed flat to extrude the excess composite. After insertion of the resin into the mold, specimens were positioned so that the distal end of the curing tip was 1 mm from the upper composite surface. The samples
were divided into three groups according to the light exposure duration (20, 40 and 60 s) with three specimens in each group. Randomization of the order in which specimens were polymerized was performed. Samples of uncured resin were used as control group, to calculate the degree of conversion.
The LED unit used was the ULTRABLUE I® (DMC Co., São Carlos, SP, Brazil, λ = 475 ± 15 nm) composed of seven LEDs. The LED irradiance measured with a power meter was 90 mW/cm2, whereas the irradiance informed by the manufacturer was 190 mW/ cm2. The Halogen lamp irradiance measured was of 600 mW/cm2 (Optilight Plus® – GNATUS Inc., Ribeirão Preto, and SP, BRAZIL). The power measurements were done using a power meter (New Port – 1835-C, USA). After the exposure, top and bottom specimen surfaces were analyzed immediately by FT-Raman.
Spectra of the uncured and cured resins were obtained using a FT-Raman Spectrometer (RFS 100/S – Bruker Inc., Karlsruhe, Germany). To excite the spectra, the defocused λ 1064.1 nm line of a Nd:YAG laser source was used. The maximum laser power incident on the sample surface was about 230 mW and the spectrum resolution was 4 cm-1. The Aluminium mold with the uncured resin was positioned in the sample compartment and the sample stage was mounted on an optical rail. The FT-Raman spectra of the uncured resin were obtained using 200 scans without removing the resin of the Aluminum rods.
For each specimen surface, three spectra were acquired in three distinct points, obtaining 108 spectra in the total. The same procedure was repeated for the sample photoactivated by the Halogen lamp. For each exposure duration, one average spectrum (three for LED and three for Halogen lamp) was obtained by using the Labspec® software. The FT-Raman spectra were analyzed by selecting a spectra region from 1590 to 1660 cm-110. The Raman vibrational stretching mode in 1608 and 1638 cm-1 were fitted by Lorentzian shapes to obtain the height of the peaks using the Microcal Origin® software. To calculate the degree of conversion, the height ratio of the peaks at 1608 and 1638 cm-1 were used in the Equation 1.
The mean value and standard deviation were calculated for each series. The FT-Raman results were subjected to the one-way Analysis of variance (ANOVA). The data comparisons were done by rows. Where significance appeared, the Bonferroni post-hoc test was applied for pair-wise comparison. All the statistical analysis was performed at the 95% significance level.
RESULTS
A typical Raman spectrum of composite resin cured by the LED (60 s) is shown on Figure 2. The main vibrational modes have been previously identified and are assigned to the CH stretching of the Methyl group at 2928 cm-1, the C=O stretching mode at 1716 cm-1, the Methacrylate C=C stretching mode at 1638 cm-1, the C=C stretching of the aromatic group at 1609 and 1452 cm-1 (skeletal vibration of the Benzene nucleus)19. The weak peaks at 639 and 600 cm-1 may be the phonon frequencies of ZrO
2 19.
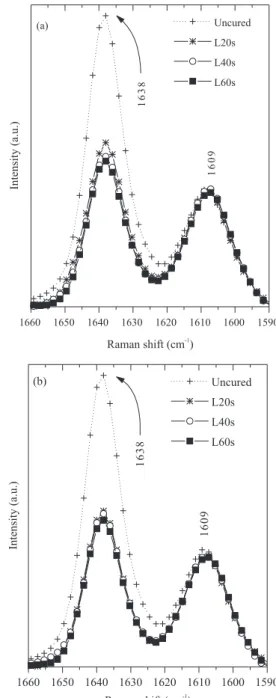
The Raman spectrum shows changes in the relative intensities of the peak at 1638 cm-1 as a function of exposure duration. As expected, the intensity decreased with increasing of the exposure duration to both the LED (Figures 3a and b) and Halogen lamp (Figures 4a and b), for both surfaces. Note in those figures that the intensity of the peak at 1609 cm-1 corresponding to the aromatic group, remains constant and, therefore, not depending of the polymerization time.
Table 1 shows the mean and standard deviation (S.D.) of the degree of conversion for the composite resin after 20, 40, and 60 s of exposure duration at both, top and bottom surfaces. Degree of conversion values ranged from 45.0 ± 2.0 to 52.0 ± 1.5 and from Figure 1. Aluminum rod and Teflon base used to produce the resin composite
231 Monomer Conversion of Composite Dental Resins Photoactivated
Vol. 28, No. 2
49.0 ± 1.0 to 55.0 ± 2.0 for the blue LED and Halogen lamp curing units, respectively.
Comparing the conversion values between the top surfaces of both curing sources, statistically significant differences (* - p<0.05) were found between LED and Halogen lamp for the specimens cured by 20 s of exposure (Table 1). For the specimens cured by 40 and 60 s of exposure, no statistical significant difference (ns – p>0.05) were found comparing the conversion values at the top surface between LED and Halogen lamp. Statistically significant difference (* - p<0.05) was found in the conversion values comparing the specimens cured by 20 s with LED and Halogen lamp in the bottom surface. In the group of the samples cured by 40 s, no statistical significant difference (ns – p>0.05) was found in the bottom surface between the samples cured by LED and Halogen lamp. At the bottom surface, statistically significant difference (* - p<0.05) was found between the samples cured by 60 s with LED and Halogen lamp. Considering the conversion values of both surfaces, no statistical significant difference (ns – p>0.05) were found in the samples cured by LED between the top and bottom surface and in the samples cured by Halogen lamp by 20, 40 and 60 s. (Table 1).
DISCUSSION AND CONCLUSION
Pianelli et al.15 reported that the DC (gel point) of dimethacrylate-type resins was close to 50.0% when cured during 40 s by Halogen lamp. In the present study, the optimal DC measured on the top surface in the samples cured by Halogen lamp (53.0%) is near to this value. These results are also in agreement with previous work of Watts and Al Hindi10 and of Leloup et al.13 where the Z100® resin composite cured by 40 s with the Halogen lamp produced a DC of 55.6 and 50.9%, respectively. From our experiment, the DC produced by LED curing ranged from 49.0 - 52.0% and there were no statistical difference between the LED and the Halogen light with 40 s of Figure 2. FT-Raman spectra of Z100 composite resin cured by LED (60 s) with the main vibrational modes and with the vibrational modes used to calculate de degree of conversion enlarged in the small box
Table 1. Degree of conversion (DC) and standard deviation (SD) as a function of exposure duration and polymerization source (LED – L / Halogen – H)
Time (s) DC% (top) SD DC% (bottom) SD
L H P value L H P value
20 47.0 ± 1.0 52.0 ± 1.5 * P<0.05 45.0 ± 2.0 49.0 ± 1.0 * P<0.05
40 52.0 ± 1.0 53.0 ± 3.7 ns P>0.05 49.0 ± 2.0 51.0 ± 1.0 ns P>0.05
60 52.0 ± 1.5 55.0 ± 2.0 ns P>0.05 50.0 ± 2.6 54.0 ± 0.75 * P<0.05
Figure 3. Overlay graph presenting the Raman spectra of uncured resin composite (¨) and the resin cured by LED light with 20 (Â), 40 ({) and 60 s ()at top surface (a) and 3 mm deep surface (b)
232 Soares et al. Quim. Nova
Figure 4. Overlay graph presenting the Raman spectra of uncured resin composite (¨) and the resin cured by Halogen lamp with 20 (Â), 40 ({) and 60 s ()at top surface (a) and 3 mm deep surface (b)
times more irradiance than does the LED device. However, the maximum irradiance for LED occurs around λ 470 nm and for the
Halogen lamp is approximately λ 460 nm. It is relevant to point out that the most efficient wavelength to excite the camphorquinone is
λ 470 nm, and therefore, LED shows to be more efficient regardless its reduced irradiance6. Any wavelengths below λ 430 nm and above
λ 500 nm are not utilized in the electron promotion of the ketone groups in Camphorquinone and therefore the Camphorquinone ignores these wavelengths. The unwanted wavelengths do produce additional heat, affecting the kinetics of the reaction and may thereby influence the reaction. However, the major disadvantage of blue LEDs is low light intensity per element and it is necessary to use more than one LED to obtain sufficient intensity for curing units and to ensure convergence and focusing of their light13.
FT-Raman spectroscopy showed the changes in the relative intensities of the peak at 1638 cm-1 during the polymerization process. Sample preparation is fairly simple, since no specific sample dimensions is required. Raman measurements can be carried out in normal atmospheric conditions without the need of a high vacuum. Finally, since this technique is non-destructive, samples can be used for multiple analysis.
The degree of conversion study of LED composite resin polymerization trough FT-Raman Spectroscopy showed that the same conversion values were produced by the LED with 40 and 60 s of irradiation comparing with the Halogen lamp.
ACKNOWLEDGMENTS
This research was supported by UniVap – Research and Development Institute - IP&D and CNPq – Brazil, Grant No. 301519/ 95-1.
REFERENCES
1. Bowen, R. L.; US pat.3, 066,112 1962.
2. Yap, A. U. J.; Lee H. K.; Sabapathy, R.; Dent. Mater.2000, 16, 172. 3. Yoon, T. H.; Lee, Y. K.; Lim, B. S.; Kim, C. W.; Journal of Oral
Rehabilitation2002, 29, 1165.
4. Inoue, K.; Hayashi, I.; Journal of Oral Rehabilitation1982, 9, 493. 5. Kurachi, C.; Tuboy, A. M.; Magalhães, D. V.; Bagnato, V. S.; Dent. Mater.
2001, 17, 309.
6. Dunn, W. J.; Bush, A. C.; Journal of American Dental Association2002, 133, 335.
7. Knezevic, A.; Tarle, Z.; Meniga, A.; Sutalo, J.; Pichler, G.; Journal of Oral Rehabilitation2001, 28, 586.
8. Stansbury, J. W.; Dickens, S. H.; Dent. Mater.2001, 17, 71.
9. Soares, L. E. S.; Martin, A. A.; Pinheiro, A. L. B.; Proceedings of SPIE, Lasers in Dentistry VIII2002, 4610, 15.
10. Watts, D. C.; Al-Hindi, A. A. M.; Spectroscopy Europe1999, 11, 16. 11. Mills, R. W.; Br. Dent. J.1995, 178, 169.
12. Tarle, Z.; Meniga, A.; Knezevic, A.; Sutalo, J.; Ristic, M.; Pichler, G.; Journal of Oral Rehabilitation2002, 29, 662.
13. Leloup, G.; Holvoet, P. E.; Bebelman, S.; Devaux, J.; Journal of Oral Rehabilitation2002, 29, 510.
14. Roberts, T. A.; Shaw, D. J.; J. Dent. Res. 1984, 63, 293.
15. Pianelli, C.; Devaux, J.; Bebelman, S.; Leloup, G.; J. Biomed. Mater. Res., Part B1999, 48, 675.
16. Silikas, N.; Eliades, G.; Watts, D. C.; Dent. Mater.2000, 16, 292. 17. Shin, W. S.; Li, X. F.; Schwartz, B.; Wunder, S. L.; Baran, G. R.; Dent.
Mater.1993, 9, 317.
18. Xu, J.; Butler, I. S.; Gibson, D. F. R.; Stangel, I.; Biomaterials1997, 18, 1653.
19. Hirschfield, T.; Chase, D. B.; Appl. Spectrosc.1986, 40, 133. 20. Chase, D. B.; J. Am. Chem. Soc. 1986, 108, 7483.
21. Chase, D. B.; Anal. Chem.1987, 59, 881.
22. DI Lorenzo, S. C.; Latta, M. A.; Willwerding, T. M.; Murdock, C. M.; IADR/AADR/CADR 80th General Session, USA, 2002.
C=C double bonds, resulting in a larger number of Methacrylate C=C units not bonded, and thus producing a less effective polymerization reaction with 20 s of curing. For the specimens cured by 60 s of exposure, the DC produced by both light sources showed no statistical significant differences at top surface, and it can be observed a trend in the DC values starting from 40 s of exposure.