http://dx.doi.org/10.1590/2317-6431-2016-1732 ISSN 2317-6431
Acoustic and articulatory parameters during the production
of the contrast between alveolar and velar stops: typical and
phonological disorder data
Parâmetros acústicos e articulatórios durante a produção do
contraste entre oclusivas alveolares e velares: dados típicos e de
desvio fonológico
Roberta Michelon Melo1, Helena Bolli Mota1, Larissa Cristina Berti2
ABSTRACT
Introduction: Speech instrumental analysis, such as acoustic and articulatory (e.g. ultrasound tongue images) may identify speakers’ undetected linguistic skills through auditory perceptual analysis.
Purpose: To compare the acoustic and articulatory parameters between alveolar and velar stops and between children with typical speech development and children with phonological disorders. Methods: The sample consisted of fifteen children with typical speech development and seven children with phonological disorders. The corpus was organized through the target-words: /’kap/, /‘tap/, /‘galo/ and /‘da/, into carrier phrase and spontaneously named. Simultaneous audio and video (tongue ultrasound images) recording were performed. The data was analyzed in acoustic and articulatory ways. Results: Six (spectral peak, centroid, variance, skewness, kurtosis and consonant-vowel transition) of the nine acoustic parameters investigated did not demonstrate any distinctions between children with and without speech alterations. Only spectral peak and consonant-vowel transition values were not significant for differentiating the target contrast. In relation to the ultrasound data, the proportion of significant axes of the tongue’s anterior and posterior region showed some significant variations in the typical group, different from the group with phonological disorders. The tongue curves also evidenced particularities between the groups. Conclusion: The acoustic and articulatory parameters provided evidence about the phonic contrast between alveolar and velar stops in the studied sample. It was observed an articulatory refining of children with typical speech development and the presence of covert contrast in the speech of children with phonological disorders.
Keywords: Speech; Ultrasonography; Speech acoustics; Child; Speech sound disorder
RESUMO
Introdução: Análises instrumentais de fala, como a análise acústica e a articulatória (por exemplo, as imagens de ultrassom de língua), podem identificar habilidades linguísticas dos falantes, não detectadas por análise perceptivoauditiva. Objetivo: Comparar os parâmetros acústicos e articulatórios entre as oclusivas alveolares e velares e entre crianças com desenvolvimento típico de fala e crianças com desvio fonológico.
Métodos: A amostra consistiu de 15 crianças com desenvolvimento típico de fala e sete crianças com desvio fonológico. O corpus foi composto pelas palavras alvo: /’kap/, /‘tap/, /‘galo/ e /‘da/, inseridas em frase veículo e nomeadas espontaneamente. Foi realizada a gravação simultânea de áudio e vídeo (imagens de ultrassonografia de língua). Os dados passaram por análise acústica e articulatória. Resultados:
Seis (pico espectral, centroide, variância, assimetria, curtose e transição consoante-vogal) dos nove parâmetros acústicos investigados não mostraram distinções entre os grupos. Os valores de pico espectral e transição consoante-vogal foram os únicos não significativos para a marcação do contraste alvo. Em relação aos dados de ultrassonografia, a proporção de eixos significantes das regiões anterior e posterior de língua mostrou algumas diferenças no grupo típico, diferentemente do grupo com desvio fonológico. As curvas de língua também evidenciaram particularidades, em ambos os grupos. Conclusão: Os parâmetros acústicos e articulatórios forneceram evidências sobre o contraste fônico entre oclusivas alveolares e velares, na amostra estudada. Observou-se um refinamento articulatório das crianças com desenvolvimento típico de fala e a presença de contrastes encobertos na fala das crianças com desvio fonológico.
Palavras-chave: Fala; Ultrassonografia; Acústica da fala; Criança; Transtorno fonológico
This work was developed at the Post-Graduation Program in Human Communication Disorder, at the Universidade Federal de Santa Maria – UFSM – Santa Maria (RS), Brazil.
(1) Universidade Federal de Santa Maria – UFSM – Santa Maria (RS), Brazil.
(2) Universidade Estadual Paulista “Júlio de Mesquita Filho” – UNESP – Marília (SP), Brazil.
Funding sources: Fundação de Amparo à Pesquisa do Estado do Rio Grande do Sul (FAPERGS) and Coordenação de Aperfeiçoamento de Pessoal de Nível Superior (CAPES) for the concession of a doctoral scholarship to the first author of this article and for the financial support for the acquisition of the equipment used in the data collection (Edital CAPES 025/2011).
Conflict of interests: No
Authors’ contribution: RMM was responsible for the study delimitation, collection, analysis and the article writing; HBM and LCB helped in the study idealiza-tion, supervision and guidance, with important intellectual contributions.
Corresponding author: Roberta Michelon Melo. E-mail: [email protected]
INTRODUCTION
Moments of instability and stability mark the process of speech development and acquisition. However, these oscillating episodes during the acquisition of a phonic system are not equivalent to loss. Quite the contrary, they seem to reflect the practice of the production of the target parameters of a certain tongue(1,2).
Until some age group, the pronunciation variations are well admitted. Nevertheless, when the use of a tongue is distinct, in comparison to other children at the same age, with overt deficits in the production of speech sounds, as well as in the realm of vocabulary and grammar, the mistakes or deviances can be diagnosed(3). In this study, it is foreseen that
the phonological disorders are not related only to categorical mistakes (substitutions, omissions and/or assimilation), but also to the production of gradient contrast. That means, beyond considering evident disturbance of one of the subsystems of language (more specifically in relation to the production of speech sounds), it is given a new view to the understanding of the speech disturbances described by DSM-V(4).
The gradient contrasts, intermediate or covert, are understood as the speech production and as a distinctive knowledge of a certain phonic contrast, not identified through perceptive auditory analysis, but with the help of speech instrumental analysis(5). Such interpretation is linked
to the theoretical bias of the Gestural Phonology(6,7), the
comprehension of articulatory gestures and, consequently, to the adoption of speech instrumental analysis, as the acoustic and articulatory ones.
According to this point of view, the instabilities of the phonic system are justified as resulting from the following factors: the reduction in the time and space magnitude of individual articulatory gestures(8,9,10,11); the increase in
the gestural superposition(11); the occurrence of intrusive
gestures(8,9), or the dependence among articulators(12).
With the growing interest, in the area of Linguistics and Speech Therapy, in the use of instrumental methodologies (acoustic and/or articulatory), it is possible to observe and describe which and to what extent the acoustic and/or articulatory parameters have been used to the distinction of the several speech sounds, before they have been noticed by ears(13).
Said so, the objectives that permeated this study were to compare:
1. The acoustic parameters of alveolar and velar stops in a group of children with typical speech development (TSD) and in a group of children with phonological disorders (voice onset time - VOT). And also, the spectral pick and spectral moments related to the burst (centroid, variance, skewness and kurtosis, vowel-consonant transition CV), and the relative duration measures of the stops and burst. 2. The articulatory parameters of alveolar and velar stops also
in each group investigated (the proportion of significant
axes of the anterior and posterior tongue regions and the description of tongue curves).
3. The data of children with TSD and children with diagnosis of phonological disorders to the extent of the use of the acoustic and articulatory parameters.
METHODS
This study is characterized as a descriptive/quantitative transversal research. It is part of Project approved at the Ethics Committee in Research from the Universidade Federal de Santa Maria, under the number 14973013.8.0000.5346. The allowance of the legal guardians of the participants of this research was requested, by the elucidation, reading and signature of the Consent Form, indispensable condition to the participation in this study. The children’s assent for participating in the study was also considered.
The procedures involved in the selection of individuals were done in two municipal kindergartens and at the Center of Language and Speech Studies (CLSS), all located in the city of Santa Maria, RS.
For the individuals’ selection, an interview and a phonological screening were realized (compound by orofacial myofunctional, speech, voice and auditory screening evaluations). The sample which showed alteration in the production of phonic contrasts of Brazilian Portuguese (BP) went under the speech collection foreseen in the Children’s Phonological Evaluation (CPE)(14), with the aim of obtaining
the contrastive analysis of speech sounds.
The sample was compound with 84 children, from which, 62 were excluded. I) For not being from the age group for this study (from4 years to 8 years and 11 months). II) For showing hearing and speech problems (diagnosis of Autistic Spectrum Disorder, evident loss of semantic and syntactic systems, and specific speech damage, such as uncommon disfluency and/or substitutions, distortions or segment emissions, which were not the study matter), voice or orofacial myofunctional problems (which influenced in the appropriate stops production). III) For having done speech therapy. IV) For resisting to the evaluations or data collection. V) For giving up participating in the research by the guardians, and due to sociolinguistic influences (as the case of variant production of a segment different from the ones produced in the city where the study was done).
All individuals of this group had problems in establishing the contrast between alveolar and velar stops, as showed in the acoustic perceptive speech analysis (six of them presented the strategy of anteriorization of velar stops and one, the strategy of posteriorization of alveolar stops), beyond other alterations in the phonic system.
To record the acoustic data and the tongue ultrasound images the following equipment were used: unidirectional microphone (Shure® – SM48), pedestal, endocavitary probe (65C10EA– 5 MHz). All attached to a portable ultrasound equipment (Mindray® – DP6600),a computer, a speaker, an acoustic booth, a headset (Articulate Instruments Ltd®), the SyncBrightUp unity of audio and video synchronization(Articulate Instruments Ltd®) and the Articulate Assistant Advanced Software – AAA(Articulate Instruments Ltd®).
The data of /t/, /d/, /k/ and /g/ were collected by the spontaneous naming of four words of BP– /’kap/, /‘tap/, /‘galo/ and /‘da/.These words were extracted or based on the criteria showed by the Instrument of Speech Evaluation Instrument for Acoustical Analysis (SEIAA)(15).
The target words were represented by figures and were showed on a computer screen for their naming. Individuals were informed to include the target word in a carrier phrase “Say ____ again”. Each word was named six times, however, for the present study, three repetitions of the target word were used for the acoustical study (4 words x 3 repetitions x 22 individuals = 264 stop segments analyzed),and five repetitions for the articulatory study (4 words x 5 repetitions x 22 individuals = 440stop segments analyzed).
Some target sound productions were excluded from the acoustical analysis due to the incorrect naming of the target word or the carrier phrase, the excessive pause between the words in the sentence, the external noise and the acoustical report of the undifferentiated burst. It was necessary to select the same number of repetitions of stops among the acoustical parameters and the groups, because of the exclusion of some segments and the statistical design selected. Thus, three repetitions of each consonant were used for the acoustical experiment. In the case of the ultrasound image analysis, five repetitions of each consonant were maintained. Images with poor quality at the greatest point of the tongue constriction were excluded, as were those in which the target word or carrier phrase was incorrectly named. The first repetitions of each individual were prioritized to be included in the study analysis. If a repetition was excluded, the following repetition was considered, until the foreseen total number of repetitions was obtained.
During the recording, the individuals remained seated, with erect posture, inside an acoustic booth. The ultrasound probe was placed below the jaw, fixed to the head stabilizer. To allow the image capturing with the ultrasound, some gel was used to contact the probe to the skin. The individuals were guided to name the pictures in usual vocal pattern (intensity, frequency
and speed), under the supervision of the researchers, who were also inside the booth. The collection time varied from 15 to 20 minutes and it was done only once.
The audio and image capturing of the tongue movement was done with the AAA software. For the ultrasound image analysis, the resourced offered by this software were used. Yet, the audio signals were analyzed by using the PRAAT® software (www.praat.org).
For the acoustical analysis, the target sounds were analyzed using, at first onset, the acoustic reports of: voice onset time (VOT); spectral peak and the burst spectral moments (centroid, variance, skewness and kurtosis); consonant-vowel transition (CV) and measurements of relative duration of the burst in relation to the total duration of the segment. The extraction of these parameters was done manually, following the procedures described in other studies(1,13,16,17,18,19).
For the articulatory analysis of the ultrasound data, moments corresponding to the production of each segment analyzed ([t], [k], [d] and [g]) were selected. That is, based on the spectrogram given by the program, it was conducted the acoustical report related to the second vowel of the word “Say”, until the beginning of the vowel which followed the stop consonant to be analyzed. For such, an audio and video synchronization using SyncBrightUp was done.
After that, a visual inspection of the selected video frame was performed for each consonant, with the aim of finding the highest tongue elevation, during the stop production. In the frame corresponding to the highest tongue constriction(20,21), a
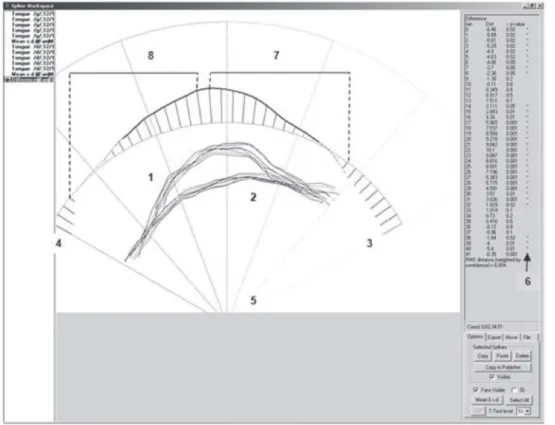
spline over the tongue surface (sagittal cut) was done. After drawing all the splines for each of the five repetitions of each stop consonant, by using a software command, an independent mean was calculated for each of the 42 axes or fan rays, and, thus, a mean tongue contour was drawn based on these 42 points. The same way, two standard deviations were offered. Then, two average splines were compared for each of the contrasts investigated ([t] x [k], [t] x [g], [d] x [k] and [d] x [g]), using the T test for each axes, resource also offered by the software, at p<5%.
Applying this statistical test, the total number of axes crossed by the two mean splines was counted. The number was divided by two, with the aim of dividing the tongue into two regions, anterior and posterior. When the total number of axes corresponded to an odd number, the exceeding axes were figured as belonging to the anterior region. Thus, with the calculation of the total number of axes for each region, the number of significant axes was obtained for the anterior and posterior regions. The significant axes given by the T test corresponded to the axes in which the two mean tongue curves (alveolar x velar stops) presented statistically significant differences.
The result was then, multiplied by 100. This procedure was performed for the posterior region as well. The proportion of significant axes of each region was rated for each individual of this study. These values were submitted to statistical evaluations as described below.
Figure 1 shows the software window with the statistical comparison between the two mean tongue splines and the division of both tongue regions
The statistical method was different for the acoustic and the articulatory data. For the acoustical parameters, it consisted of a series of ANOVA repeated measures. The intragroup factors were the four consonants and three repetitions, and the intergroup factor was the kind of speech development (children with TSD and children with phonological disorder). The post hoc Bonferroni test was also performed with the use of Statistica 7.0 software, at p<0.05.
For the analysis of the ultrasound data, firstly the Kolmogorov-Smirnov Normality Test was applied and the common distribution considered was p>0.05. To detect differences between both averages, considering the tongue regions, the Paired T test was applied for samples with normal distribution, and the Wilcoxon Nonparametric Test was done for the samples which normality was rejected. To compare the groups, with regard to the variables studied, The Mann-Whitney Test was used since these variables appeared as not normal. All tests were statistically done using the Statistical Package for Social Science 15.0 – SPSS Software, at p<5%.
In relation to the articulatory parameter, the description of the tongue curves during the [t], [d], [k] and [g] stops production was also done at the highest tongue elevation. And also, it was based on the variables from the Gestural phonology, seen with the ultrasound images of the tongue (place and degree of constriction at the tip of the tongue and degree of constriction at the dorsum of the tongue)(6).
RESULTS
Table 1 presents some of the descriptive values (average and standard deviance) of each researched acoustical parameter, for both groups studied.
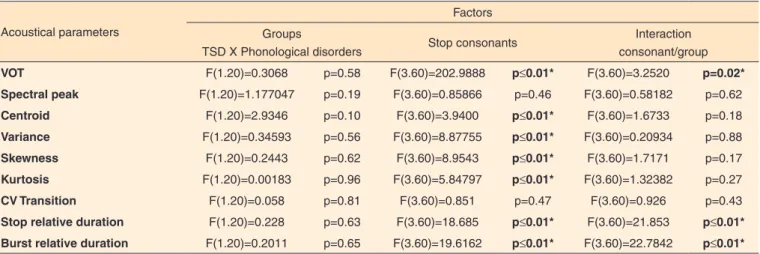
Table 2 presents results obtained with use of the ANOVA repeated measures of all the acoustical parameters analysis.
Six (spectral pick, centroid, variance, skewness, kurtosis and CV transition) out of the nine acoustic parameters investigated did not show effect for the groups, that is, these parameters did not present acoustic distinctions between children with TSD and children with phonological disorders.
For the comparison between the stop consonants, differences were found, independently of the kind of the group, only for centroid, variance, skewness, kurtosis values. On the other hand, three (the VOT and two values of relative duration) of the acoustical parameters researched have evidenced differences between the stops, depending on the group kind.
Subtitle: 1 = Five splines and mean spline of [g] stop; 2 = Five splines and mean spline of [d] stop; 3 = Axes “zero” of the fanspline; 4 = Axes “41” of thefanspline; 5 = Fanspline; 6 = Asterisks show significant axes; 7 = Anterior tongue region; 8 = Posterior tongue region
A series of post hoc analysis was performed in order to verify the difference between consonants and between the function of the group (in the case of a significant consonant/ group interaction).
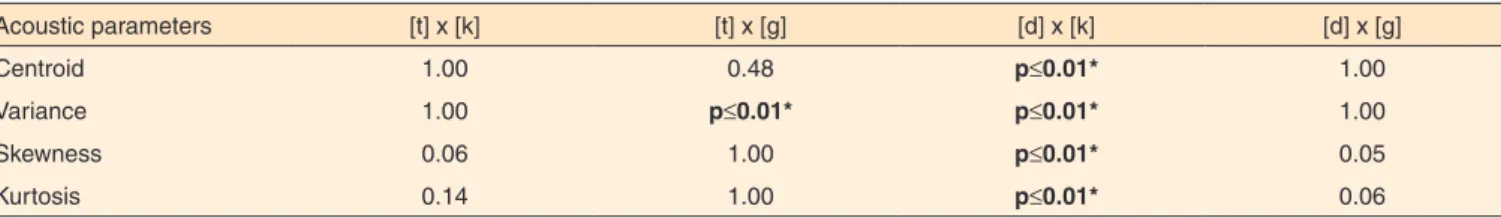
In relation to the comparison between the alveolar and velar pairs of stop consonants ([t] x [k], [t] x [g], [d] x [g] and [d] x [k]), the post hoc analysis of the acoustic parameters evidenced that they did not present statistical significance for the consonant/group interaction. It was also observed the
contrast mark, for alveolar and velar stops, as well as for voiced and voiceless stops (Table 3).
In the case of VOT, another post hoc test revealed, for both groups, differences in the comparisons [t] x [g] and [d] x [k] (p≤0.01*) were found. For the parameter of the stop relative
duration, it was observed differences between the alveolar and velar stops comparison only for the group with TSD, for the pairs [t] x [k] and [d] x [k] (p≤0.01*). The same results
were found for the burst relative duration (p≤0.01*). Again, it
Table 1. Descriptive values of the acoustic parameters in each study group (group of children with typical speech development and group of children with phonological disorders)
Parameters Children withTSD Children with phonological disorders
[k] [t] [g] [d] [k] [t] [g] [d]
VOT (ms) M 44.05 20.47 -98.47 -108.78 23.89 22.69 -117.86 -88.80
DP 19.36 12.07 36.42 49.98 10.99 9.65 41.27 51.87
Spectral peak (Hz) M 621.98 691.50 530.53 378.05 237.68 540.20 261.42 404.34
DP 908.90 1282.25 582.56 310.24 222.95 952.41 113.56 363.72
Centroid (Hz) M 1422.13 1058.79 827.14 687.94 754.62 987.17 682.63 580.47
DP 675.25 1063.28 663.85 713.53 537.42 803.34 640.66 317.36
Variance (MHz) M 2.91 2.89 1.33 1.10 2.28 2.69 1.12 1.11
DP 1.68 2.86 1.82 1.85 1.97 2.69 1.53 0.98
Skewness M 2.48 5.88 5.34 8.09 4.58 4.24 6.83 8.05
DP 1.43 6.49 3.85 5.44 3.06 2.96 3.86 6.53
Kurtosis M 8.53 100.15 55.93 124.87 28.67 28.68 76.24 150.94
DP 9.08 216.20 78.60 157.08 42.85 46.04 87.81 286.93
CV Transition (Hz) M 1823.20 1861.53 1952.07 1939.91 1906.52 1932.10 1929.57 1889.71
DP 300.04 268.26 380.56 346.02 231.82 230.95 217.46 219.05
Stop relative duration (%)
M 72.71 86.84 86.87 90.40 85.67 86.00 85.05 84.62
DP 8.18 6.99 6.82 5.61 7.60 7.24 8.94 13.75
Burst relative duration (%)
M 27.29 12.80 13.29 9.58 14.33 14.00 14.95 15.38
8.21 6.88 6.85 5.64 7.60 7.24 8.94 13.75
Subtitle: TSD = Typical Speech Development; VOT = Voice onset time; CV = Consonant/vowel; ms = milliseconds; Hz = Hertz; MHz = megahertz; M = Mean; SD = standard deviation
Table 2. Results of ANOVA of repeated measures to the acoustic parameters searched in the intentions – group, consonant and consonant/group
Acoustical parameters
Factors Groups
TSD X Phonological disorders Stop consonants
Interaction consonant/group
VOT F(1.20)=0.3068 p=0.58 F(3.60)=202.9888 p≤0.01* F(3.60)=3.2520 p=0.02*
Spectral peak F(1.20)=1.177047 p=0.19 F(3.60)=0.85866 p=0.46 F(3.60)=0.58182 p=0.62
Centroid F(1.20)=2.9346 p=0.10 F(3.60)=3.9400 p≤0.01* F(3.60)=1.6733 p=0.18
Variance F(1.20)=0.34593 p=0.56 F(3.60)=8.87755 p≤0.01* F(3.60)=0.20934 p=0.88
Skewness F(1.20)=0.2443 p=0.62 F(3.60)=8.9543 p≤0.01* F(3.60)=1.7171 p=0.17
Kurtosis F(1.20)=0.00183 p=0.96 F(3.60)=5.84797 p≤0.01* F(3.60)=1.32382 p=0.27
CV Transition F(1.20)=0.058 p=0.81 F(3.60)=0.851 p=0.47 F(3.60)=0.926 p=0.43
Stop relative duration F(1.20)=0.228 p=0.63 F(3.60)=18.685 p≤0.01* F(3.60)=21.853 p≤0.01* Burst relative duration F(1.20)=0.2011 p=0.65 F(3.60)=19.6162 p≤0.01* F(3.60)=22.7842 p≤0.01* * Significant values (p<0.05) – analysis of repeated measures variance
was evidenced the distinction of the alveolar/velar and voice contrast. The effect between the consonant repetitions did not show significance for any of the acoustic parameters.
Concerning the second speech analysis, it was observed in children with TSD difference between the anterior and posterior regions of the tongue only at the comparison of the [t] x [k] and [t] x [g] contrasts, with higher percentage average of the significant axes in the anterior region of the tongue (Table 4).
In the group of children with TSD, it was not seen any difference between the anterior and posterior regions of the tongue, for none of the contrasts investigated. The highest percentage average of significant axes was found in the anterior region of the tongue, only for the [t] x [g] and[d] x [k] relations (Table 5).
Significant difference was verified (p<0.05) between children with TSD and children with phonological disorders in all the researched contrasts ([t] x [k], [t] x [g], [d] x [k] and
[d] x [g]). Both when comparing the proportions of significant axes in the anterior regions of the tongue, and comparing the proportions of significant axes in the posterior regions of the tongue. In the complete comparisons, it was noticed a higher average of the significant axes for the group of children with TSD.
In relation to the splines of a child with TSD, it was observed the production of a gesture of tip and dorsum of the tongue, respectively, during the production of alveolar e velar constrictions (Figure 2).
For the group with phonological disorders, it was considered a minor differentiation between the splines of alveolar and velar stops. However, it is inferred a probable magnitude decrease of the tongue dorsum gesture, important to the production of velar stops (Figure 3). These articulatory gestures remained similar among all the individuals included in the group with phonological disorders. In the case of the only individual with alveolar posteriorization in his speech, in one of the five repetitions of [d] and [k], it was observed the production of a tongue curve compatible to the alveolar constriction, however, these productions were not received by the perceptive auditory analysis (Figure 4).
DISCUSSION
The present study intended, among other objectives, to compare the acoustical patterns of alveolar and velar stops in the speech of children with TSD and phonological disorders. Therefore, it was verified the use, independently of the group, of four out of the nine parameters investigated, for the distinction of, at least, a pair of stop consonants. These acoustical clues were about the values of centroid, variance, skewness and kurtosis.
The VOT parameters and the durations related to stops and burst, however, showed themselves to be used in a distinct way between children with and without speech alterations. The relative durations of both stop proportions presented statistically significant difference between the pairs of alveolar and velar stops, only for the group with TSD.
In another study(18) of BP, it was observed, for an adult
speaker, the use of all the burst spectral characteristics (spectral peak, centroid, variance, skewness and kurtosis), of the CV transition and temporal characteristics of [t] and [k], in the differentiation of these consonant phonic contrasts. However,
Table 3. Significant post hoc values in the comparison between alveolar and velar stops in both groups
Acoustic parameters [t] x [k] [t] x [g] [d] x [k] [d] x [g]
Centroid 1.00 0.48 p≤0.01* 1.00
Variance 1.00 p≤0.01* p≤0.01* 1.00
Skewness 0.06 1.00 p≤0.01* 0.05
Kurtosis 0.14 1.00 p≤0.01* 0.06
* Significant values (p<0.05) – Post hoc of Bonferroni
Table 4. Comparison of proportions of significant axes in the anterior and posterior tongue regions in the group of children with typical speech development
Contrasts
Tongue region
p-value
Anterior A (SD)
Posterior A (SD)
[t] x [k] 0.7796 (±0.10) 0.6186 (±0.20) 0.023*
[t] x [g] 0.7564 (±0.16) 0.5999 (±0.23) 0.024*
[d] x [k] 0.7956 (±0.12) 0.7722 (±0.22) 0.735
[d] x [g] 0.7456 (±0.11) 0.6533 (±0.23) 0.149
* Significant values (p<0.05) – Wilcoxon test Subtitle: A = average; SD = standard deviance
Table 5. Comparison of proportions of significant axes in the anterior and posterior tongue regions in children with phonological disorders
Contrasts
Tongue region
p-value
Anterior A (SD)
Posterior A (SD)
[t] x [k] 0.0601 (±0.06) 0.0664 (±0.09) 0.916
[t] x [g] 0.2414 (±0.38) 0.1854 (±0.26) 0.600
[d] x [k] 0.2780 (±0.35) 0.1198 (±0.23) 0.063
[d] x [g] 0.0833 (±0.22) 0.1193 (±0.12) 0.715
in the same study it was verified for children with phonological disorders, the use of less robust acoustic parameters (in this case, the variance and kurtosis) in the distinction of alveolar and velar stops and/or the use of the primary acoustic parameters, but, with insufficient magnitude to be captured by the human ear.
In another study(17), the VOT was related to the contrast
mark of the speech voicing of children with TSD, without
demonstrating, however, the same result in the speech of children with phonological disorders. It was also reported(22,23)
its use for the distinction of the articulatory point, in this case, during the production of children with or without phonological complaints. In the present research, the VOT presented statistically relevant differences between alveolar and velar stops and between voiced and voiceless stops.
Subtitle: Dotted line = velar stops [k] and [g]; continuous line: = alveolar stops [t] and [d]; to the left of images = posterior tongue region; to the right = anterior tongue region
Figure 3. Tongue splines for each contrast investigated, produced by one child of the group with phonological disorders
Subtitle: Dotted line = velar stops [k] and [g]; continuous line: = alveolar stops [t] and [d]; to the left of images = posterior tongue region; to the right = anterior tongue region
The parameters of spectral pick and CV transition were not effective to the contrast mark between alveolar and velar stops in the sample of this study.
Even the data referring to the children with typical acquisition did not present differences between the stop segments by the means of both parameters, differently from the results found in a study that had investigated this contrast in a typical adult of BP(16). This fact reinforces the proposition of
use of, at least, one parameter related to the main characteristics of such instrument, with a satisfying magnitude, it would be fundamental to offer an auditory distinction between distinct consonants(13). Furthermore, the findings refer to a
maturational trend of the speech motor control(24,25), suggesting
that children with TSD would be in processof articulatory gesturestabilization.
About the comparison of the acoustical parameters of children with TSD and phonological disorders, the results of the present study did not show differences between both groups, for six of the parameters studied. Therefore, inferences concerning the gradient stages in the infant speech seem to be confirmed again.
Acoustic variations between the different segments suggest a process towards the gradual domain of the missing phonetic-acoustic clues, in the search for the establishment of contrast between the alveolar and velar stops. Consequently, the apparent contrast loss of the articulatory point can be seen, actually, from the occurrence of covert contrasts(13).
The trials in marking the phonic contrast, so, cannot be discarded. In the speech therapy practice, the evidences of a productive knowledge of a certain target contrast, before the beginning of the treatment, can provide directions to the whole therapeutical process (such as the selection of the target sound and the determination of the therapeutical prognostic)(19).
It is understood that both children with phonological disorders can differentiate alveolar and velar stops in a covert way, as children with TSD would still be in the process of refining such distinction. That can make the data acoustic measures of speech of both groups convert to a closer zone,
making the acoustical analysis not able to detect, efficiently, the differences between them.
For the ultrasound images of the tongue, how a good technique to explore aspects of the early gesture development of very young children, at about 2 years old(26) was identified.
Equally, it was also observed the efficacy of this technique in the present study, fact that was reinforced in another recent study of BP(27).
The proportion of significant axes from the anterior and posterior regions of the tongue was a methodology of quantitative analysis, innovative in this study, never used in studies of this research field. Although it is necessary to be cautious when generalizing for a certain contrast data in BP, the results provide clues for discussions about the importance of the mean anterior region of the tongue, in the establishment of articulatory gestures involved in the production of alveolar versus velar stops.
When comparing the proportions of the significant axes from the anterior and posterior regions of the tongue, between the groups of this study, it was observed differences between children with TSD and with phonological disorders. Another articulatory investigation(28), in this case, with the help of
electropalatography, it also reported differences between speaker with and without speech alterations. The authors have justified such result based on the occurrence of undifferentiated gestures.
This way, the articulatory parameter adopted in this study, apparently, did not point to the presence of covert contrasts in the speech of children with phonological disorders, differently from the acoustical analysis. However, instead of affirming the existence of this kind of contrast, it was chosen to assume the idea that the proportions of the significant axes cannot be sensible to the detection of covert contrasts.
This way, it was possible infer a superiority of the acoustical analysis in the understanding of data covert gestures and analysis here considered, consenting with the findings of another study(29). However, it is possible that, for specific
distinctions, as the contrast of the articulatory point, the
Subtitle: Dotted line = productions similar to an alveolar constriction; continuous line = productions similar to a velar constriction; to the left of images –posterior tongue region; to the right - anterior tongue region.
difference has been marked in a not measured parameter. The use of the covert contrast was observed in the English data(29),
in the speech of only one child with velar anteriorization, by acoustic and ultrasound measures.
Nevertheless, this substantiation also infers another data interpretation. That is, the fact that the articulatory analysis shows differences in the groups of children with TSD and phonological disorders, although it cannot be used to confirm one of the hypothesis of this study, in relation to the observation of the covert contrasts. It is also relevant for being an expected phenomenon, once these groups’ productions have different results in perceptual terms. Thus, it is interesting to notice that the acoustical analysis has not pointed statistically significant differences between the groups (showing that, in a way, they approximate themselves), but, at the same time, the articulatory analysis has shown a distinction related to the highest point of the tongue constriction. Perhaps, this is really the moment of the articulatory trajectory in which the hearing perception is based on, ignoring more subtle temporal variations, detected in the acoustical analysis.
Another ultrasound image analysis of the tongue done in the present study was referring to the visual inspection of the curves, or tongue splines. The description for the children without speech alteration agreed with the data of a child with typical development of language, reported in another BP research(11).
Concerning the tongue curves of the group with phonological disorders, it was suggested an apparent decrease in the magnitude of the gesture of the tongue dorsum, during the production of the velar stops segments, what could explain the reason why the referred contrast was aurally unnoticed.
In addition, when referring to the BP data(27), with the
research of /s/ and // for children with speech alteration, it was reported only the occurrence of indifferentiation in the tongue limits between the considered fricatives. The author highlighted, yet, the existence of heterogenic data in this group.
Another study(10), when investigating the substitution of
aurally identified /k/→[t], has proved with the ultrasound
images, the presence of two simultaneous gestures (tip and dorsum of the tongue), suggesting the superposition of gestures from a same subsystem, but with distinct tract variables. In this case, the author has commented that with the existence of a sufficient superposition, a gesture can darken the other, acoustically, giving it the status of inaudible gesture.
In a way, the tongue images of the children with phonological disorders seem not to correspond the categorical substitutions, ones that are equal to a complete decrease of the intended gesture, followed by a total intrusion of the wrong/substituted gesture(9). This assertion is based both in
the apparent decrease in the magnitude of the tongue dorsum gesture, and in the moments of instability verified during the production of one only individual with the use of the strategy of alveolar posteriorization.
In summary, all the finding of this study intended, above all odds, to motivate and, mainly, to instigate new research related to the typical and atypical aspects of the development of the phonic contrasts of speech. And also, to reinforce the importance of associating the perceptive auditory analysis and the speech instrumental analysis.
The present study composes a small number of studies with ultrasound images of the tongue, in the country. For this group of researchers it is still a challenge to work with quantitative articulatory analysis that compare distinct speech analysis. Therewith, it is expected to contribute for the knowledge of the stabilization processes of the phonic contrasts during the typical development of language, and for the comprehension of the specificities existing during the organization of the distinctiveness of sound in the altered speech.
Yet, it is necessary to mention some limitations of this study. Such as the absence of a dynamic articulatory parameter, which considers the time adjust and the trajectory of articulatory gestures; the non-association of ultrasound images to another instrument of articulatory analysis, as the electropalatography or the electroglotography; as well as the lack of quantitative data that allowed the direct comparison between the two analysis here used.
CONCLUSION
The acoustic and articulatory parameters investigated provided evidences for the phonic contrast between alveolar and velar stops, in the sample studied. The comparisons between the typical and the deviant development allowed the two greatest verification of this study: the notion of an articulatory refinement in the production of children with TSD and the understanding of covert contrasts of speech of children with phonological disorders.
REFERENCES
1. Rodrigues LL, Freitas MCC, Albano EC, Berti LC. Acertos gradientes nos chamados erros de pronúncia. Letras. 2008;36:85-112. 2. Freitas MC. O gesto fônico na aquisição “desviante”: movimentos entre a produção e a percepção [tese]. Campinas: Instituto de Estudos da Linguagem, Universidade Estadual de Campinas; 2012. 3. Rinaldi LC. Procedimentos para a Análise de Vogais e Obstruintes
na Fala Infantil do Português Brasileiro [dissertação]. Campinas: Instituto de Estudos da Linguagem, Universidade Estadual de Campinas; 2010.
4. American Psychiatric Association. Manual diagnóstico e estatístico de transtornos mentais - DSM-V. 4a ed. Porto Alegre: Artes Médicas; 1995.
org/10.3109/02699200903532524
6. Browman C, Goldstein L. Articulatory phonology: an overview. Phonetica. 1992;49:155-80.
7. Albano EC. O gesto e suas bordas: esboço de fonologia acústico-articulatória do Português Brasileiro. Campinas: Mercado das Letras; 2001.
8. Pouplier M, Goldstein L. Asymmetries in the perception of speech production errors. J Phon.2005;33:47-75.
9. Goldstein L, Pouplier M, Chen L, Saltzman E, Byrd D. Dynamic action units slip in speech production errors. Cognition. 2007;103(3):386-412. https://doi.org/10.1016/j. cognition.2006.05.010
10. Hodson SL, Jardine BR. Revisiting Jarrod: applications of gestural phonology theory to the assessment and treatment of speech sound disorder. Int J Speech Lang Pathol. 2009;11(2):122-34. https://doi. org/10.1080/17549500802654617
11. Berti LC. Investigação ultrassonográfica dos erros de fala infantil à luz da Fonologia Gestual. In: Ferreira-Gonçalves G, Brum-de-Paula M. Dinâmica dos movimentos articulatórios: sons, gestos e imagens. Pelotas: Editora UFPel; 2013. p. 127-44.
12. Gibbon FE. Undifferentiated lingual gestures in children with articulation/phonological disorders. J Speech Lang Her Res. 1999;42(2):382-97.
13. Berti LC, Marino VCC. Contraste fônico encoberto entre /t/ e /k/: um estudo de caso de normalidade e de transtorno fonológico. Rev CEFAC. 2011;13(5):866-75. https://doi.org/10.1590/S1516-18462011005000010
14. Yavas M, Hernandorena CLM, Lamprecht RR. Avaliação fonológica da criança: reeducação e terapia. Porto Alegre: Artmed; 2001. 15. Berti lC, Pagliuso A, Lacava F. Instrumento de avaliação de fala para
análise acústica (IAFAC) baseado em critérios linguísticos. Rev Soc Bras Fonoaudiol. 2009;14(4):305-14. https://doi.org/10.1590/S1516-80342009000300005
16. Berti LC, Ferreira-Gonçalves G. A aquisição do contraste /t/ e /k/ sob a ótica dinâmica. Rev ABRALIN. 2012;11(1):139-96.
17. Melo RM, Mota HB, Mezzomo CL, Brasil BC, Lovatto L, Arzeno L. Parâmetros acústicos do contraste de sonoridade das plosivas no desenvolvimento fonológico típico e no desviante. Rev Soc Bras Fonoaudiol. 2012;17(3):304-12. http://dx.doi.org/10.1590/S1516-80342012000300012
18. Berti LC. Produção e Percepção da fala em crianças com distúrbios
fonológicos: a ancoragem em pistas fonético-acústicas secundárias. In: Ferreira-Gonçalves G, Brum-de-Paula M, Keske-Soares M. Estudos em aquisição fonológica. Pelotas: Editora e Gráfica Universitária PREC – UFPel; 2011. p. 153-74.
19. Tyler AA, Edwards M, Saxman J. Acoustic validation of phonological knowledge and its relationship to treatment. J Speech Hear Res. 1990;55(2):251-61.
20. Kochetov A, Sreedevi N, Kasim M, Manjula R. A pilot ultrasound study of Kannada lingual articulations. J Indian Speech Language Hearing Assoc. 2012;26:38-49.
21. Kochetov A, Sreedevi N, Kasim M, Manjula R. Spatial and dynamic aspects of retroflex production: an ultrasound and EMA study of Kannada geminate stops.J Phon. 2014;46:168-84.
22. Barroco MA, Domingues MT, Pires MF, Lousada M, Jesus LM. Análise temporal das oclusivas orais do Português Europeu: um estudo de caso de normalidade e perturbação fonológica. Rev CEFAC. 2007;9(2):154-63.
23. Rinaldi L, Albano E. Contrastes em estabilização em crianças sem queixas fonoaudiológicas. Verba Volant. 2012;3(1):1-23.
24. Cristofolini C, Seara IC. Características acústicas de consoantes plosivas e fricativas produzidas por crianças de 6 e 12 anos: período de refinamento articulatório? Verba Volant. 2012;3(1):55-71. 25. Cheng HY, Murdoch BE, Goozée JV, Scott D. Electropalatographic
assessment of tongue-to-palate contact patterns and variability in children, adolescents, and adults. J Speech Lang Her Res. 2007;50(2):375-92. https://doi.org/10.1044/1092-4388(2007/027) 26. Song JY, Demuth K, Shattuck-Hufnagel S, Ménard L. The effects
of coarticulation and morphological complexity on the production of English coda clusters: acoustic and articulatory evidence from 2-year-olds and adults using ultrasound. J Phon. 2013;41(3-4):281-95. https://doi.org/10.1016/j.wocn.2013.03.004
27. Francisco DT. Contorno de língua na produção do /s/ e // na fala de adultos e crianças com e sem transtorno [dissertação]. São Paulo: Faculdade de Medicina da Universidade de São Paulo; 2015. 28. Lee A, Gibbon FE, O’Donovan C. Tongue-palate contact of
perceptually acceptable alveolar stops. Clin Linguist Phon. 2013;27(4):312-21. https://doi.org/10.3109/02699206.2012.757651 29. Byun TM, Buchwald A, Mizoguchi A. Covert contrast in velar
![Figure 4. Tongue splines referring to the stop production [d] and [k] of an individual with phonological disorders and the use of the alveolar pos- pos-teriorization strategy in his speech](https://thumb-eu.123doks.com/thumbv2/123dok_br/15425386.592067/8.892.188.708.86.278/referring-production-individual-phonological-disorders-alveolar-teriorization-strategy.webp)
