Article
J. Braz. Chem. Soc., Vol. 25, No. 11, 2039-2047, 2014. Printed in Brazil - ©2014 Sociedade Brasileira de Química 0103 - 5053 $6.00+0.00
A
*e-mail: [email protected], [email protected]
Synthesis and Application of Magnetic Nanoparticle Supported Ephedrine as a New
Sorbent for Preconcentration of Trace Amounts of Pb and Cu in Water Samples
Somayeh Mohammadi, Gholamreza Khayatian,* Bahareh Atashkar and Amin Rostami
Department of Chemistry, Faculty of Science, University of Kurdistan, P.O. Box 416, 66177-15175 Sanandaj, Iran
Um novo adsorbente para a determinação de Pb e Cu por espectrometria de absorção atômica de chama (FAAS) foi sintetizado e caracterizado por diferentes técnicas. O efeito de vários parâmetros como pH, tipo e volume do eluente, quantidade de adsorbente, volume da amostra e íons interferentes foram otimizados. Nas condições otimizadas, um gráfico de calibração linear foi obtido para a determinação de Pb(II) e Cu(II). As faixas lineares foram 15-500 µg L−1
e 18-500 µg L−1 para chumbo e cobre, respectivamente. Os limites de detecção e quantificação
foram 4,3 e 14,5 µg L−1 para chumbo e 5,0 e 16,7 µg L−1 para cobre, respectivamente. O desvio
padrão relativo para determinações de oito replicatas de 80 e 200 µg L−1 de Pb(II) foram 2,9 e
1,4% e para Cu(II) foram 3,5 e 1,9%, respectivamente. A aplicabilidade do método foi avaliada ao analisar traços de chumbo e cobre em diferentes amostras de água.
A new adsorbent for determination of Pb and Cu by flame atomic absorption spectrometry (FAAS) was synthesized and characterized with different techniques. The effect of various parameters such as the pH, the type and volume of eluent, amount of adsorbent, sample volume and interfering ions were optimized. Under the optimized conditions, a linear calibration graph was obtained for determination of Pb(II) and Cu(II). The linear ranges were found to be 15-500 µg L−1
and 18-500 µg L−1 for lead and copper, respectively. The limit of detection and limit of quantification
were 4.3 and 14.5 µg L−1 for lead and 5.0 and 16.7 µg L−1 for copper, respectively. The relative
standard deviation for eight replicate determinations of 80 and 200 µg L−1 of Pb(II) were 2.9 and
1.4% and for Cu(II) were 3.5 and 1.9%, respectively. Applicability of the method was evaluated by analyzing trace amounts of lead and copper in different water samples.
Keywords: magnetic solid phase extraction, lead(II), copper(II), MNPs-ephedrine,
preconcentration
Introduction
In the past decade, the entry of pollutants of heavy metals has increased in the global ecosystem.1 The amount
of entering of heavy metals into the environment is far beyond the amount that is removed by natural processes. Their accumulations in water, air and soil and their non-metabolized is an important environmental problem. Moreover, they have deposited and accumulated in tissues such as fat, muscle, bones and joints. This causes several diseases and complications in the body. Most heavy metals in aquatic systems are Cu, Zn, Cd, Hg, Pb and Ni. It has long been found that, in the appropriate concentrations, many metals including Fe (hemoglobin), Cu (respiratory pigments), Zn (enzymes), Co (vitamin B12),
Cr (carbohydrate metabolism), Se (antioxidant role), Mo and Mn (enzyme) are essential to living organisms but may be toxic at high concentrations. Metals such as Hg, Pb, Sn, Ni and As are generally not required for metabolic
activity and are toxic at quite low concentrations.2
Therefore, the measurement of trace amounts of heavy metals in environmental samples is very important for analytical chemists. Several techniques for measuring these elements have been employed such as flame atomic absorption spectrometry (FAAS),3,4 electrothermal atomic
absorption spectrometry (ETAAS),5 inductively coupled
plasma mass spectrometry (ICP-MS),6 inductively coupled
plasma optical emission spectrometry (ICP-OES)7-10 and
spectrophotometry.11 Among these, FAAS, due to its
preconcentration methods including: coprecipitation,12-14
liquid-liquid extraction,15 cloud point extraction,16 solid
phase extraction17,18 can solve this problem. Solid phase
extraction (SPE) is widely used due to its simplicity, consumption of small volumes of organic solvent, high preconcentration factor, high recovery, rapid phase separation and the ability to combine with different modern detection techniques.19 SPE sorbent selection is critical
to obtaining efficient SPE recovery. Until now, various adsorbents such as chelating resin,20 activated carbon,8
modified or bonded silica gel,21 polyurethane foam,22
naphthalene23 and cellulose24 have been used for metal ion
sorption. Recently, nanomaterials have applied as one of the most promising adsorbents in SPE. A new method of solid phase extraction, based on the use of magnetic adsorbents
has been developed.25,26 Magnetic nanoparticles offer
many advantages due to the unique size, easy separation from the solution using a magnet and high surface area.3,7
The suitable surface coatings and effective protection strategies have developed to prevent the accumulation of nanoparticles, chemical analysis in specific environments as well as changes of the magnetic properties in complex environmental samples and biological systems.10
In this paper, a new adsorbent, magnetic nanoparticle
Fe3O4-immobilized ephedrine (MNPs-ephedrine) for
the determination of Pb and Cu by FAAS is synthesized and characterized with different techniques. In the best of our knowledge, this adsorbent has not been used to the separation and preconcentration of trace amount of metal ions. Applicability of the method was evaluated by analyzing trace amounts of lead and copper in different water samples.
Experimental
Instrumentation
A Shimadzu model AA-670 atomic absorption spectrometer (Kyoto, Japan) equipped with lead and copper hollow cathode lamps and air-acetylene flame was used for determination of the metal ions. All pH settings were carried out by a Metrohm E-691 digital pH meter (Switzerland) with a combined glass electrode. The infrared spectra were recorded using an infrared spectrometer (Bruker-Vector 22, Germany) with KBr disks in the range
of 4000-400 cm−1. The scanning electron microscopy
(SEM) image was obtained by VEGA TESCAN (Czech Republic). The XRD data were collected on an X’PertMPD Philips diffractometer (Netherland) with Cu Ka radiation
source (λ = 1.54050 Å) at 40 kV voltage and 40 mA
current. The TGA was carried out on a Bähr STA 503
instrument (Germany) under air atmosphere, heating rate 10°C min−1. The magnetic measurements were carried out
in an Alternating Gradient Force Magnetometer (AGFM, Meghnatis Daghigh Kavir Co., Made in Iran) at room temperature. A magnet (Nd-Fe-B, 1.2 T, 50 × 40 × 20 mm) was used for magnetic separation.
Reagents and solutions
All materials used in this work were of analytical grade from Merck Co. (Darmstadt, Germany). Stock standard solutions of Pb(II), Cu(II) (1000 mg L−1 each one) were
purchased from Merck. Solutions with lower concentrations were prepared daily by suitable dilution of the stock solution with deionized water. (3-chloropropyl)-trimethoxysilane (CPTMS) and ephedrine hydrochloride were utilized for the synthesis of sorbent. The pH 4.5 of the sample solution was adjusted using acetate buffer. The HCl, H2SO4 and HNO3
solutions, using as eluents were prepared by dilution of the concentrated solutions with deionized water.
Preparation of large-scale the magnetic Fe3O4 nanoparticles (MNPs)
Masses of 4.865 g FeCl3·6H2O and 1.789 g FeCl2·4H2O
were added to 100 mL deionized water and sonicated until the salts dissolved completely. Then, 10 mL of 25% aqueous ammonia was added quickly into the reaction mixture in
one portion under N2 atmosphere at room temperature
followed by stirring about 30 min with mechanical stirrer. The black precipitate was washed five times with doubly distilled water.27
Preparation of MNPs coated by (3-chloropropyl)-trimethoxysilane (MNPs-CPTMS)
Mass of 1.500 g MNPs powder was dispersed in 250 mL ethanol/water solution with volume ratio, 1:1 by sonication for 30 min, and then 2.5 mL CPTMS (99%) was added to the mixture. After mechanical stirring under N2 atmosphere
at 33-38 °C for 8 h, the suspended substance was separated with centrifugation (for 30 min). The settled product was re-dispersed in ethanol by sonication. The final sample was separated by an external magnet and washed five times with ethanol. The product was stored in a refrigerator to use.27
Preparation of MNPs-ephedrine ligand
hydrochloride and 0.672 g sodium bicarbonate were added and the mixture was refluxed for 28 h. Then, the final product was separated by magnetic decantation and washed twice by dry CH2Cl2 and ethanol respectively to
remove the unattached substrates. The product was stored in a refrigerator until use.
Preparation of environmental waters
The water samples, such as tap water (Sanandaj, Iran), sea water from Caspian Sea (Rudsar, Iran), wastewater of oil refinery (Kermanshah, Iran) were stored in pre-cleaned polyethylene bottles for use. The pH water samples
were adjusted to 1 with concentrated HNO3. Before the
analysis, the sea water and wastewater of oil refinery samples were filtered through a filter paper to remove suspended particular solids. Then, all samples were placed in refrigerator at approximately 4 °C.
General procedure
A 100 mL aqueous solution containing 10.0 µg Pb(II), Cu(II) was prepared and pH was adjusted at 4.5 with 10.0 mL acetate buffer solution (0.01 mol L−1). The solution was
added to 10.0 mg adsorbent in 100 mL beaker. The sample solution was sonicated for 10 min to simplify sorption of lead and copper ions. Then, a strong magnet was used and the magnetic adsorbent separated after a few minutes and the supernatants were decanted. For elution adsorbed analyte ions from nanoparticles, 2.0 mL H2SO4 and HCl mixtures
(0.5 mol L−1 each one) with 2:1 volumetric ratio were
added and the solution was again sonicated for 6 min and exposed on the magnet to deposit the magnetic nanoparticles. Afterwards, the eluate containing metal ions was determined by FAAS, using the conditions recommended by the manufacturer with a flow rate of 2.0 mL min−1.
Results and Discussion
Preparation and characterization of MNPs-ephedrine
The process of the preparation of MNPs-ephedrine is shown in Scheme 1.
The metal ions are easily adsorbed on MNPs-ephedrine because ephedrine possesses a hydroxyl group and a nitrogen atom, which can complex with Cu (II) and Pb(II).28
The MNPs-ephedrine has been characterized by SEM, X-ray diffraction (XRD), thermo gravimetric analysis (TGA), Fourier transform infrared spectroscopy (FTIR) and alternating gradient force magnetometer (AGFM).
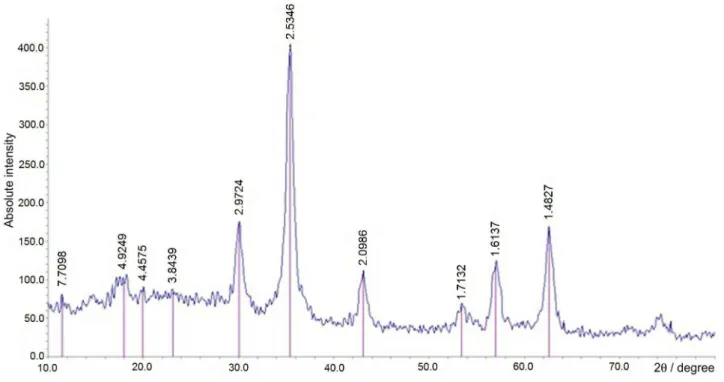
The XRD pattern of MNPs-ephedrine is shown in Figure 1. According to the XRD analysis, the peaks with 2θ at 30.4°, 35.6°, 43.3°, 57.3° and 62.8° indicated
the characteristic peaks of Fe3O4. Weak broad bands
(2θ = 11.5-23°) appeared in XDR pattern which could be attributed to the amorphous silane shell formed around the magnetic cores.
The SEM image of MNPs-ephedrine is shown in Figure 2. It was confirmed that MNPs-ephedrine were made up of uniform nanometer-sized particles 20-32 nm.
Figure 3 shows FTIR spectra for MNPs, MNPs-CPTMS, and MNPs-ephedrine. The bands at low wavenumbers
≤ 700 cm−1 come from vibrations of Fe–O bonds of iron
oxide, which for the bulk Fe3O4 samples appear at 570 and
375 cm−1 but for Fe
3O4 nanoparticles appear at 624 and
572 cm−1 as a blue shift, due to the size reduction. The FTIR
spectra of MNPs-CPTMS and MNPs-ephedrine show Fe–O vibrations in the same vicinity. The introduction of CPTMS to the surface of MNPs is confirmed by the bands at 1005 and 1128 cm−1 assigned to the Fe–O–Si and C–Cl stretching
vibrations, respectively.27 Reaction of MNPs-CPTMS
with ephedrine produces MNPs-ephedrine, in which the presence of ephedrine is demonstrated with stretching
vibrations at 3341 and 3380 cm−1, which incorporates
the N–H and O–H bonds and vibrations in the range of 1428-1652 cm−1 are attributed to the phenyl ring.
One indication of bond formation between the nanoparticles and the ligand can be inferred from TGA. The TGA curve of the MNPs-ephedrine shows the mass loss of the organic functional group as it decomposes upon heating (Figure 4). The weight loss at temperatures below 200 °C is due to the removal of physically adsorbed solvent and surface hydroxyl groups. Organic spacers have been reported to desorb at temperatures above 260 °C.27
The curve shows a weight loss about 19% from 260 to 600 °C. The loading of the ligand in MNPs-ephedrine can
be calculated from TGA, which confirmed a loading of approximately 0.35 mmol g−1.
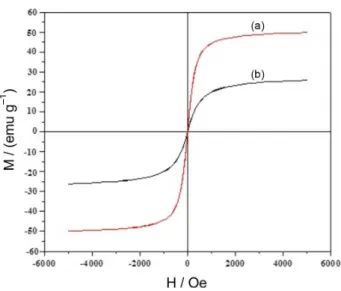
Superparamagnetic particles are beneficial for magnetic separation; the magnetic property of MNPs and MNPs-ephedrine were characterized by AGFM. The room temperature magnetization curves of MNPs and MNPs-ephedrineare are shown in Figures 5a and 5b. As expected, the bare MNPs, showed the higher magnetic value (saturation magnetization, Ms) of 74.3 emug−1, the Ms value
of MNPs-ephedrine is decreased due to the silica coating and the layer of the grafted ligand (30.4 emug−1). As a result, the
MNPs-ephedrine has a typical superparamagnetic behaviour, and can be efficiently attracted with a small magnet.
Unfortunately, due to the magnetic properties of MNPs-ephedrine, it is actually impossible to further characterize this material by using solid-state nuclear magnetic resonance (NMR) spectroscopy.
The initial experiments indicated that the lead and copper ions are effectively adsorbed on MNPs-ephedrine. In order to use the present method for preconcentration and determination of trace amounts of metal ions, various parameters including, the pH of the sample solution, the Figure 2. SEM image of MNPs-ephedrine.
Figure 1. XRD pattern of MNPs-ephedrine.
type, concentration and volume of eluent, the amount of adsorbent, the sorption and desorption time, the volume of sample solution and the effect of different coexisting ions were optimized. The optimization of each of these parameters for determination Pb(II) and Cu(II) is described in the next sections.
Effect of pH
Due to the surface charge of the adsorbent and the solution chemistry of the metal ions, the pH of the aqueous solution is an important controlling factor in the uptake process of metal ions on adsorbents. Thus, the effect of pH, on the preconcentration of solutions containing 100 µg L−1
Pb(II) and Cu(II) in the pH range of 3.0-10.0 was evaluated. The pH of solutions was adjusted using either hydrochloric acid or sodium hydroxide solutions (0.1-1.0 mol L−1) and the
result is shown in Figure 6. As can be seen, low extractions of Pb(II) and Cu(II) at pH < 4.0 may be due to the competition of proton with analyte ions for sorption on the MNPs-ephedrine surface and in the higher pHs (pH > 5.0), may be due to
formation of metal hydroxide species such as Pb(OH)+,
Pb(OH)2, Pb(OH)3− and Cu2(OH)22+, Cu(OH)2, Cu(OH)3–,
Cu(OH)42−,29-31 that leads to the decrease in the efficiency of
extraction. As can be seen from Figure 6, lead and copper ions were quantitatively recovered (≥ 95%) in the pH range of 4.0-5.0. So, the pH 4.5 was selected as the optimum value for subsequent experiments. This optimum pH was adjusted with 10.0 mL of acetic acid-acetate buffer solution.
Effect of type and volume of eluent
The desorption process of Pb(II) and Cu(II) from sorbent is influenced by the type and concentration of eluents. Various eluents such as EDTA, HNO3, HCl, H2SO4 with
different concentration and the mixture of HCl and H2SO4
(0.5 mol L−1) were tested. As shown in Figure 7, a mixture
of 2:1 v/v of H2SO4 and HCl (0.5 mol L−1 each one) provided
higher efficiency compared to other eluents. Thus, a mixture of 2:1 v/v of H2SO4 and HCl was chosen for further studies.
The effect of the eluent volume on the extraction of metal ions was also studied. Different volumes of eluent in the range of 2.0 to 5.0 mL were examined. According to the results shown in Figure 8, 2.0 mL of the mixture of 2:1 v/v of H2SO4 and HCl (0.5 mol L−1 each one) was sufficient for
quantitative recovery of analyte ions.
Effect of amount of adsorbent
In the sorption step, the selection of a proper amount of adsorbent is very important. In order to investigate the effect of the quantity of adsorbent on preconcentration of lead Figure 4. TGA profile of MNPs-ephedrine.
Figure 5. AGFM curve of (a) MNPs, (b) MNPs-ephedrine.
and copper ions, various amounts of modified MNPs from 5.0 to 15.0 mg were used. The results shown in Figure 9, indicate that the quantitative recovery (> 95%) for Pb(II) and Cu(II) was obtained when the amount of adsorbent was greater than 5.0 mg. Therefore, in the further experiments, 10.0 mg of adsorbent was applied because it showed higher values of recovery.
Effect of sorption and desorption time
The ultrasonic times of analytes sorption and desorption were evaluated. According to the experimental results, the quantitative recovery of lead and copper ions was obtained when ultrasonication time was greater than 10 min for sorption and greater than 6 min for desorption. Therefore, the optimum times of sorption and desorption were 10 min and 6 min, respectively.
Effect of sample volume
For the preconcentration of trace elements, it is important to have high preconcentration factors. In order to achieve, the preconcentration factors, maximum applicable sample volume must be examined. For this purpose, the sample volumes of 50, 75, 100, 150, 200, 300 and 500 mL containing 10.0 µg of Pb(II) and Cu(II) were studied according to the recommended procedure. The quantitative recoveries were achieved when the volume of solution was less than 200 mL. Hence, a sample volume of 200 mL was selected as the largest usable sample volume. Thus, in this work, by using 2.0 mL of elution solution, a preconcentration factor of 100 is obtained.
Effect of diverse ions
In order to investigate the selectivity of the method, the interference effect of different ions on the recovery of metal ions under the optimized conditions was evaluated. The concentration of diverse ions which resulted in an error ± 5% in determination 100 mL of 100 µg L−1 Pb(II) and Cu(II) was
considered as the tolerance limit. The results summarized in Table 1 demonstrate that the method is relatively selective for determination Pb and Cu in real samples.
Sorption capacity
A batch method was used to calculate the sorption capacity. Langmuir isotherms were used to describe the sorption process at the solid-liquid interface which is represented by the following equation:
Figure 7. Effect of type of eluent on the recovery of 100 µg L−1 of Pb(II) and Cu(II). Conditions: pH, 4.5, 10.0 mL acetate buffer 0.01 mol L−1; amount of adsorbent, 10.0 mg; sample volume, 50.0 mL; sorption time, 14 min; desorption time, 6 min; (n = 3).
Figure 8. Effect of volume of eluent on the recovery of 100 µg L−1 of Pb(II) and Cu(II). Conditions: pH, 4.5, 10.0 mL acetate buffer 0.01 mol L−1; amount of adsorbent, 10.0 mg; sample volume, 50.0 mL; sorption time, 14 min; desorption time, 6 min; (n = 3).
(1)
where C (mg L−1) is the equilibrium concentration,
q (mg g−1) is the amount of metal adsorbed per unit mass
of adsorbent at equilibrium, qm (mg g−1) is the maximum
amount of sorption in monolayered sorption systems and k (L mg−1) is the Langmuir constant, which can be
considered as a measure of sorption energy.
A linear plot of C/q against C was applied to obtain the values of qm and k from the slope and intercept of the plot.
In order to calculate the sorption capacity, 3.0-10.0 mg L−1 of metal ions were added to 10.0 mg of
adsorbent. The results indicated that the sorption capacity of MNPs-ephedrine for Pb(II) and Cu(II) are 9.4 and 0.6 mg g−1, respectively.
Analytical figures of merit
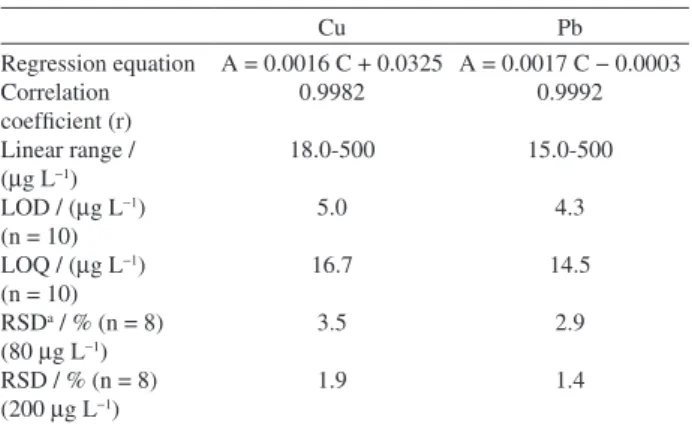
The analytical performance characteristics of the method are shown in Table 2. Under the optimized conditions, a linear calibration graph was obtained for determination Pb(II) and Cu(II). The linear ranges were
found to be 15.0-500 µg L−1 and 18.0-500 µg L−1 for lead
and copper, respectively. The regression equations for the lines were A = 0.0017 C − 0.0003 with r = 0.9992 for lead, A = 0.0016 C + 0.0325 with r = 0.9982 for copper, where A is absorbance and C is concentration of lead and copper ions in µg L−1. The limit of detection and limit of quantification
were defined as 3Sb/m and 10Sb/m where m is the slope
of calibration graph and Sb is the standard deviation of ten
blank determinations were 4.3 and 14.5 µg L−1 for lead and,
5.0 and 16.7 µg L−1 for copper, respectively. The relative
standard deviations for eight replicate determinations of 80 and 200 µg L−1 of Pb(II) were 2.9 and 1.4% and for 80
and 200 µg L−1 of Cu(II) were 3.5 and 1.9%, respectively.
The reusability of the sorbent in several successive sorption and desorption processes was studied. The obtained results showed that the sorbent could be reused two times without any considerable loss in its sorption efficiency.
Application
The present method was applied to determination of Pb and Cu in water samples. The results are shown in Table 3. To evaluate the accuracy of the results, different Table 1. Effect of diverse ions on the determination of 100 µg L−1 of
Pb(II) and Cu(II)
Interference species Tolerable concentration ratio X/Pb(II) Tolerable concentration ratio X/Cu(II) Na+, Cl−, Mg2+, Ca2+ 10000 10000 F−, I−, K+, SO
42− 10000 5000
Co2+ 100 100
Cd2+ 50 50
Ni2+ 20 100
Cr3+ 50 20
Fe3+ 10a 1
aThe interference of Fe3+ up to 10-fold was overcome by the addition of 1.0 mL of 1000 mg L−1 of F− solution.
Table 2. Analytical characteristics of proposed method at the optimum
conditions
Cu Pb
Regression equation Correlation coefficient (r) Linear range / (µg L−1) LOD / (µg L−1) (n = 10) LOQ / (µg L−1) (n = 10) RSDa / % (n = 8) (80 µg L−1) RSD / % (n = 8) (200 µg L−1)
A = 0.0016 C + 0.0325 0.9982 18.0-500 5.0 16.7 3.5 1.9
A = 0.0017 C − 0.0003 0.9992 15.0-500 4.3 14.5 2.9 1.4
aRelative standard deviation.
Table 3. Determination of Pb and Cu in water samples
Real sample Added / (µg L −1) Pb(II) found / (µg L−1) Recovery / % Cu(II) found / (µg L−1) Recovery / %
Caspian Sea −
100 200
15.56 ± 0.033 113.71 ± 0.009 206.65 ± 0.013
−
98.1 95.5
15.40 ± 0.008 110.42 ± 0.003 209.70 ± 0.015
−
95.0 97.1 Waste water of oil
refinery (Input)
−
100 200
21.00 ± 0.002 116.72 ± 0.028 220.26 ± 0.017
−
95.7 99.6
22.50 ± 0.004 118.70 ± 0.009 213.50 ± 0.023
−
96.2 95.5
Tap water (Sanandaj) −
25 200
N. D.a 24.3 ± 0.009 192.5 ± 0.035
−
97.2 96.3
N. D. 24.8 ± 0.006 190.4 ± 0.051
−
99.2 95.5
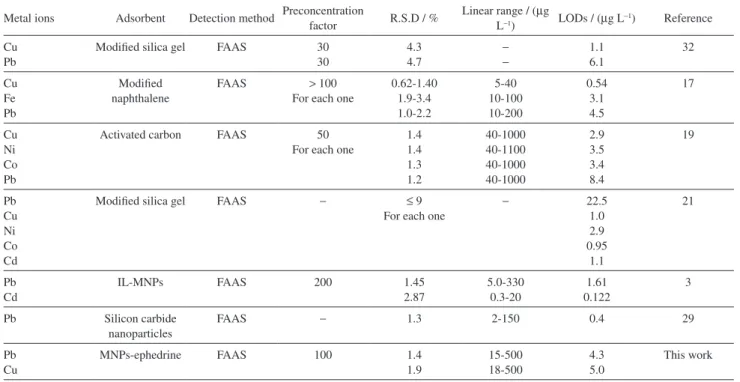
Table 4. Comparison of the proposed method with some other methods to determination the metal ions
Metal ions Adsorbent Detection method Preconcentration factor R.S.D / % Linear range / (L−1) µg LODs / (µg L−1) Reference Cu
Pb
Modified silica gel FAAS 30 30 4.3 4.7 − − 1.1 6.1 32 Cu Fe Pb Modified naphthalene
FAAS > 100 For each one
0.62-1.40 1.9-3.4 1.0-2.2 5-40 10-100 10-200 0.54 3.1 4.5 17 Cu Ni Co Pb
Activated carbon FAAS 50 For each one
1.4 1.4 1.3 1.2 40-1000 40-1100 40-1000 40-1000 2.9 3.5 3.4 8.4 19 Pb Cu Ni Co Cd
Modified silica gel FAAS − ≤ 9
For each one
− 22.5 1.0 2.9 0.95 1.1 21 Pb Cd
IL-MNPs FAAS 200 1.45
2.87 5.0-330 0.3-20 1.61 0.122 3
Pb Silicon carbide nanoparticles
FAAS − 1.3 2-150 0.4 29
Pb Cu
MNPs-ephedrine FAAS 100 1.4
1.9 15-500 18-500 4.3 5.0 This work
amounts of investigated metal ions were spiked to the real sample by standard addition. The recovery values for added concentration of analyte ions were quantitative.
Conclusions
In this study, magnetic Fe3O4 modified with ephedrine
has been applied for the first time for preconcentration of lead and copper in water samples. It was found that this procedure was relatively selective, simple, fast, low cost and eco-friendly and with a good preconcentration factor, wide linear dynamic range. A comparison with some of the previously reported works is also given in Table 4.
References
1. Emadi, M.; Shams, E.; J. Iran. Chem. Soc. 2013, 10, 325. 2. Pourreza, N.; Zolgharnein, J.; Kiasat, A. R.; Dastyar, T.; Talanta
2010, 81, 773.
3. Davud abadi Farahani, M.; Shemirani, F.; Microchim. Acta
2012, 179, 219.
4. Xie, F.; Lin, X.; Wu, X.; Xie, Z.; Talanta 2008, 74, 836. 5. Zendelovska, D.; Pavlovska, G.; Cundeva, K.; Stafilov, T.;
Talanta 2001, 54, 139.
6. Zhang, N.; Peng, H.; Wang, Sh.; Hu, B.; Microchim. Acta 2011,
175, 121.
7. Suleiman, J. S.; Hu, B.; Peng, H.; Huang, Ch.; Talanta 2009,
77, 1579.
8. He, Q.; Hu, Zh.; Jiang, Y.; Chang, X.; Tu, Zh.; Zhang, L.; J. Hazard. Mater. 2010, 175, 710.
9. Zhang, L.; Li, Zh.; Du, X.; Li, R.; Chang, X.; Spectrochim. Acta, Part A 2012, 86, 443.
10. Cheng, G.; He, M.; Peng, H.; Hu, B.; Talanta 2012, 88, 507.
11. Koduru, J. R.; Lee, K. D.; Food Chem. 2014, 150, 1. 12. Soylak, M.; Tuzen, M.; J. Hazard. Mater. 2008, 152, 656. 13. Duran, C.; Ozdes, D.; Sahin, D.; Bulut, V. N.; Gundogdu, A.;
Soylak, M.; Microchem. J. 2011, 98, 317.
14. Doner, G.; Ege, A.; Anal. Chim. Acta2005, 547, 14. 15. Ikeda, K.; Abe, Sh.; Anal. Chim. Acta 1998, 363, 165. 16. Citak, D.; Tuzen, M.; Food Chem. Toxicol. 2010,48, 1399. 17. Pourreza, N.; Hoveizavi, R.; Anal. Chim. Acta 2005, 549, 124. 18. Mashhadizadeh, M. H.; Amoli-Diva, M.; Shapouri, M. R.;
Afruzi, H.; Food Chem. 2014, 151, 300.
19. Ghaedi, M.; Ahmadi, F.; Shokrollahi, A.; J. Hazard. Mater.
2007, 142, 272.
20. Narin, I.; Soylak, M.; Kayakirilmaz, K.; Elci, L.; Dogan, M.; Anal. Lett. 2003, 36, 641.
21. Ngeontae, W.; Aeungmaitrepirom, W.; Tuntulani, Th.; Talanta
2007, 71, 1075.
22. Anthemidis, A. N.; Zachariadis, G. A.; Stratis, J. A.; Talanta
2002, 58, 831.
23. Costa, A. C. S.; Lopes, L.; Korn, M. G. A.; Portela, J. G.; J. Braz. Chem. Soc. 2002, 13, 674.
24. Gurnani, V.; Singh, A. K.; Venkataramani, B.; Anal. Chim. Acta
25. Parham, H.; Zargar, B.; Heidari, Z.; Hatamie, A.; J. Iran. Chem. Soc. 2011, 8, S9.
26. Karimi, M. A.; Hatefi-Mehrjardi, A.; Mohammadi, S. Z.; Mohadesi, A.; Mazloum-Ardakani, M.; Hormozi Nezhad, M. R.; Askarpour Kabir, A.; J. Iran. Chem. Soc. 2012, 9, 171. 27. Rostami, A.; Atashkar, B.; Moradi, D.; Appl. Catal. A-Gen.
2013, 467, 7.
28. Li, F.; Ding, Zh.; Cao, Q.; Electrophoresis 2008,29, 658. 29. Pourreza, N.; Naghdi, T.; J. Ind. Eng. Chem. 2013,20, 3502.
30. Tan, X. L.; Chang, P. P.; Fan, Q. H.; Zhou, X.; Yu, S. M.; Wu, W. S.; Wang, X. K.; Colloids Surf., A2008, 328, 8.
31. Nosrati, A.; Addai-Mensah, J.; Skinner, W.; Int. J. Miner. Process 2012, 102-103, 89.
32. Matoso, E.; Kubota, L. T.; Cadore, S.; Talanta 2003, 60, 1105.
Submitted on: July 12, 2014