Article
Printed in Brazil - ©2015 Sociedade Brasileira de Química0103 - 5053 $6.00+0.00A
*e-mail: [email protected]
Down- and Up-Conversion Photoluminescence of Carbon-Dots from Brewing
Industry Waste: Application in Live Cell-Imaging Experiments
Carime V. Rodrigues,*,a José R. Correa,b Carlos M. Aiube,a Lorena P. Andrade,b Pedro M. Galvão,a Pâmela A. Costa,a Ariadna L. Campos,a Anderson J. Pereira,c Grace F. Ghesti,d Jorlandio F. Felix,c,e
Ingrid T. Weber,a Brenno A. Netob and Marcelo O. Rodriguesa
aLaboratório de Inorgânica e Materiais (LIMA), Instituto de Química (IQ), bLaboratório de Química Medicinal e Tecnológica (LaQuiMeT), IQ, cNúcleo de Física Aplicada, Instituto de Física (IF) and dLaboratório de Catálise (LABCAT), IQ, Universidade de Brasília (UnB),
Campus Universitário Darcy Ribeiro, 70904-970 Brasilia-DF, Brazil
eDepartamento de Física, Universidade Federal de Viçosa (UFV), 36570-900 Viçosa-MG, Brazil
Simple synthetic procedures have been applied to obtain luminescent carbon quantum dots, also referred as C-dots, from an abundant carbon source, that is, from the brewing industry waste. The synthetic procedures have been conducted aiming to investigate the effects of the oxidation stage on the properties of the nanomaterial. C-dots down- and up-conversion properties, as well as their potential for cellular imaging experiments in live (and adhered) cells, are disclosed herein.
Keywords: C-dots, luminescence, up-conversion, live cell-imaging
Introduction
The development of new photoluminescent nanomaterials has attracted much attention over the last decades because of their advantageous properties in comparison to those presented by conventional bulk materials. These nanomaterials have a tremendous impact over a wide range of strategic fields, such as diagnostic, therapeutic, electronic, photonic and energy.1 Among
well-established fluorescent nanomaterials, the class of the so-called quantum dots (QDs), based on heavy metal elements, may be considered as one of the most iconic and prominent materials.2 Heavy metal QDs exhibit attractive
properties, such as tunable emission, photostability and intense bright luminescence, which enable them to be widely explored in both medicine and biology. The presence of toxic elements, such as cadmium, lead or mercury in their compositions has been considered, however, as a huge drawback for furthering their applications as a topic of major concerns.
Carbon quantum dots (known as C-dots) are a new class of fluorescent nanoparticles, which have emerged as a promising alternative to overcome major negative aspects
associated with heavy QDs. C-dots have received a special attention, not only because of their optical properties, but also for both their small size and non-toxicity. These features also open a wealth of possibilities toward the development of new optical probes for biological applications.3,4
C-dots spectroscopic properties are the subject of many controversies and some mechanisms have been speculated to be responsible for the luminescence of these materials. The presence of energy traps on their surface, which may cause a quantum confinement effect; the energy states associated to edge defects; or even exciton transitions are some possibilities hotly debated.3
C-dots can be produced from a variety of synthetic procedures and from a large range of cheap and readily available carbon sources, such as glucose, watermelon rinds,5 hair6 and even cow manure.7 Wort bagasse is a
byproduct from brewing process and is a component of the solid material produced from wort filtration before the next steps toward beer manufacture.8 This byproduct is mainly
constituted of leftover peels and pulp of malt, grain and also some additives (wheat, rice and corn, for exemple). Crushed malt is 85% of the total product generated by the brewing industry and is, thus, the most abundant byproduct from this process.9 Brazil is the third largest beer producer
potential for bioimaging experiments using breast cancer cell (MCF-7) lineages tested. Herein, the newly synthesized nanomaterials are designated as 1 and 2, referring to the more oxidized and less oxidized C-dots, respectively.
Experimental
C-dots 1 were obtained similarly to a previously reported methodology,7 that is, by chemical oxidation
followed by extraction. C-dots 2 were synthesized using a similar methodology, but excluding the oxidation treatment (Scheme 1; a detailed procedure can be found in the Supplementary Information file).
The high-resolution transmission electron microscopy (HRTEM) images were obtained in a JEOL JEM 2100 electron microscope (Tokyo, Japan) operating at an accelerating voltage of 200 kV. The aqueous solutions containing the C-dots were deposited on a 400-mesh C-coated copper grid (Ted Pella Inc., Redding, CA, USA) and dried in air. The Fourier transform infrared (FTIR) spectra were recorded from potassium bromide (KBr) pellets, in a spectral range of 4000-400 cm−1, using a
Jasco FT/IR-4100 spectrometer (Tokyo, Japan). The zeta potentials were measured using a Zetasizer Nano-ZS90 (Malvern, United Kingdom). The Raman measurements were performed using the Renishaw InVia micro-Raman system (Sheffield, UK) equipped with the 514.5 nm argon laser line and a 50× objective, resulting in a laser spot size of around 1 µm in the focal plane. The laser excitation power was about 0.05 mW at the sample surfaces. The Raman measurements were recorded using C-dots in their powdered form. The fluorescence spectra of the nanomaterials were
of insoluble proteins, cellulose and lignin. In view of the annual generation of large quantities of this product, for each 100 L of beer production 40 kg of wort bagasse are produced, we have decided to explore this waste carbon source to synthesize C-dots. The oxidation degree of C-dots surface is known to be influenced by the synthetic route.10
The oxidation process provides sp3 domain formation on
the C-dots surface, resulting in surface decoration with different functional groups, such as carboxyl, carbonyl, hydroxyl and epoxy groups.11 The presence of these
oxygenated functional groups plays important roles on the hydrophilic properties of the C-dot derivatives and also permits the design of more specific bioprobes through simple chemical modifications.7 The zeta potential values,
acquired at pH 5 in aqueous medium, are in the range of −13.3 and −8.89 mV for 1 and 2, respectively,which are comparable to previous reported values.12,13 The decrease
of zeta potential observed for 2 supports the hypothesis that the surface of 1 is more oxidized and the presence of carboxylate (COO−) groups is in accordance with the idea
of a higher oxidation level for 1.14
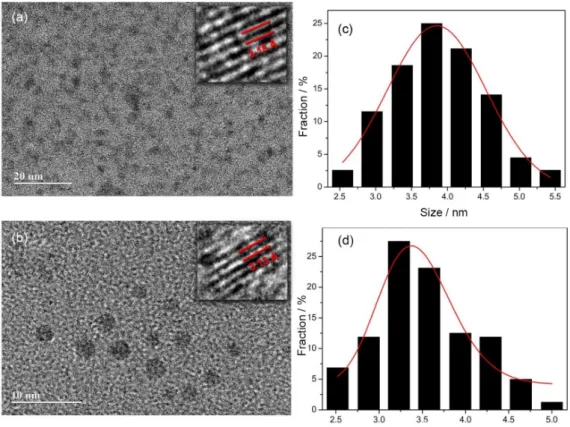
High-resolution transmission electron microscopy images acquired for 1 and 2 (Figure 1) show well-dispersed particles with spheroidal morphologies. 1 and 2 present narrow size distributions ranging from 2.5-5.9 nm and 2.5-5.3 nm, with average sizes of 4.08 and 3.72 nm, respectively. The inserts in Figures 1a and 1b exhibit representative images of individual particles, indicating the high crystallinity with lattice parameters of 3.13 and 3.15 Å, which correspond to the (002) diffraction plane of graphite.15 These results
show that both synthetic routes result in uniform C-dots nanoparticles with similar size distributions.
The FTIR spectra (Figure S1) of C-dots 1 and 2 show an intense absorption band centered at 3450 cm−1 assigned
to O−H bonds stretching vibrations. The bands centered at 1630 cm−1 were attributed to asymmetrical vibrations
of the C=O groups and these at 1380 cm−1 assigned to the
C−H bending.
Raman spectroscopy provides a powerful diagnostic tool to examine crystallinity.16 The Raman scattering Scheme 1. Synthetic procedures for the synthesis of the studied C-dots
from C-dots 1 at room temperature (r.t.) is available in the Supporting Information (Figure S2). C-dots 2 exhibited an identical profile. The peaks around 724 and 1068 cm−1 correspond to the A
1g andEg modes of
the crystalline sodium nitrate, respectively.17 The other
two peaks (1380 and 1577 cm−1) are generally observed
in graphite-based materials. The D band (1380 cm−1)
exhibits disorder characteristic related to the presence of sp3 defects, while the peak around 1577 cm–1 is attributed
to the well-graphitized carbon, which is associated to in-plane vibration of sp2 carbon atoms in the 2D hexagonal
lattice. Thus, the relative intensity ratio of the D-band and G-band (ID/IG) provides the degree of disorder, which
makes it possible to compare the structural order between crystalline and amorphous graphitic systems.18,19 The I
D/IG
for the C-dots synthesized in this work was around 0.95, demonstrating that they present a similar graphitic-like structure. Results from Raman experiments proved to be in agreement with those reported for C-dots synthesized from unconventional carbon sources.5,20,21
The remarkable optical properties of the C-dots 1 and 2 were confirmed with ultraviolet-visible spectroscopy (UV-Vis) and photoluminescence spectra. The UV-Vis absorption spectra, exhibited in Figure 2, display an intense band at 228 nm, which may be correlated to n-π*
transitions. Additionally, low intensity absorption shoulders
were observed at about 305 nm, assigned to π-π* functional
group at the surface. The difference in the oxidation degree of C-dots does not alter their absorption profile, thus the energy associated with exciton formation in 1 and 2 are quite similar. The optical band gap, obtained from Tauc and Abeles22 method, was the same for both materials
(5.2 eV). The origin of the optical properties of C-dots is still hotly debated and is yet not well understood. Therefore, mechanisms involving quantum confinement, surface traps, formation of aromatic structures and recombination of excitons have been proposed.3 The emission spectra of 1
and 2 measured at r.t. are also shown in Figure 2 and display broad bands centered at 460 and 440 nm, respectively.
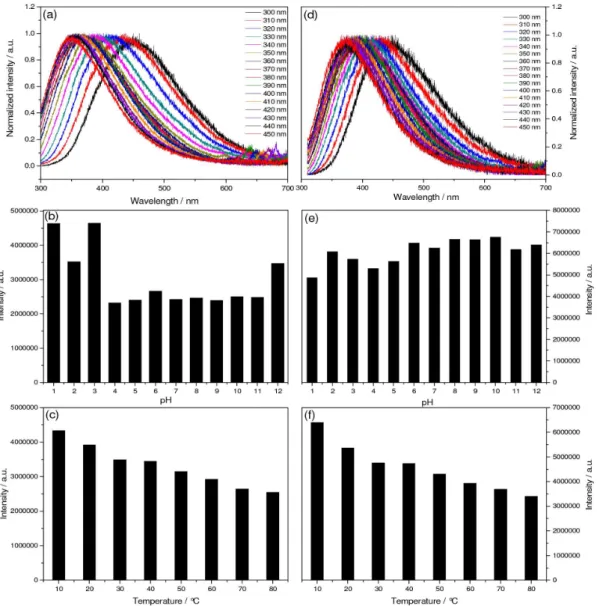
In Figure 3 is depicted both the emission spectra and the emission intensities as functions of the temperature and pH. C-dots 1 and 2 showed an excitation dependence profile with slightly different spectral behavior. C-dots type 1 exhibited a blue shift of 20 nm (460 to 440 nm) when gradually excited from 300 to 340 nm, whereas between 350-450 nm the emission bands were progressively red shifted by 66 nm (440 to 506 nm). On the other hand, the excitation-dependence of 2 just starts upon excitation at 350 nm, when the emission bands were shifted about 70 nm toward the red spectral range. These results are consistent with the presence of defects at the C-dots surfaces as the net result of distinct oxidation degrees.10,23
be shifted due to the deprotonation process. The temperature effect on the emission intensities of the C-dots are shown in Figures 3c and 3f. The emission intensities of 1 and 2 are progressively diminished as a consequence of multiphoton coupling at higher temperatures, which favors non-radioactive decay.
Figure 2. Ultraviolet-visible spectroscopy (UV-Vis) absorption and emission spectra of the C-dots. The solid colored and black lines represent 1 and 2, respectively. The emission spectra were acquired at r.t. under excitation at 300 nm. Black and colored arrows indicate the n-π* and π-π*
transitions, respectively. The insert shows 1 under UV light-irradiation (366 nm).
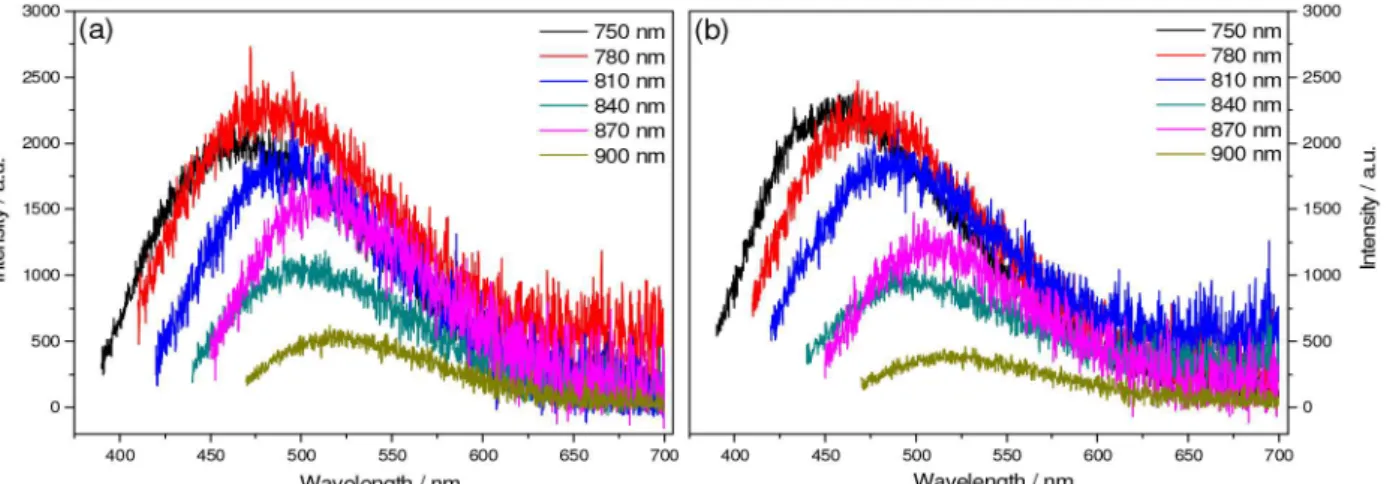
C-dots 1 and 2 also exhibited an interesting up-conversion (UC) photoluminescent emission when excited in the near-infrared (NIR) region, similar to those reported for C-dots from several carbon sources.26-29 The excitation
spectra of 1 and 2 in the NIR region have been acquired monitoring their emission at 460 nm (Figure S3) and displayed two bands centered at 810 and 850 nm, that is, the bands likely to be responsible for the excitation of the materials. Figure 4 displays the UC emission spectra of 1 and 2 acquired at r.t. upon excitation at the NIR region.
The UC emission spectra of 1 and 2 show broad bands centered at 470 and 460 nm when excited at 750 nm. The UC properties may be justified by the combination of two or more low energy photons to produce the emission of a high energy photon. The UC emission spectra still show an excitation dependence behavior, similarly to those previously reported.25 These results show the potential of these
nanomaterials for the development and application of new photocatalyst composites, solar cells, and for applications in cell-imaging with two-photon fluorescence microscopy.
Finally, the more oxidized C-dots 1 were submitted to cell-imaging experiments. 1 has been selected for cell-imaging experiments instead of 2 for a better comparison with previously reported bioimaging experiments reported elsewhere.4 Figure 5 exhibits the confocal images using
breast cancer cells (MCF-7).
A cell cytoplasm staining pattern typical of a non-selective bioprobe was observed for both samples (adhered and live cells). It was also observed a very interesting feature when the cell nuclei were analyzed. C-dots 1 proved to be capable of staining nucleoli selectively, as is shown for the live cell samples. Although the nucleoli staining pattern was very clear with a large bright green emission (Figures 5a and 5d), live and adhered samples also showed a slight staining pattern associated with the cytoplasm region near the nuclei. These characteristics have already
been described to similar materials reported by Kang and co-workers.30
Conclusions
In summary, residues from the brewing industry were successfully used as a carbon source to obtain luminescent C-dots through two facile synthetic procedures. C-dots presented excellent aqueous solubility and similar optical properties. The pH- and temperature-dependence observed for 1 and 2 may be justified by their distinct oxidation
Figure 4. Room temperature up-conversion photoluminescence for (a) 1 and (b) 2 in aqueous media, under pH 6 upon progressive excitation from 750 to 900 nm.
conditions through fluorescence microscopy. Bioimaging experiments comparing 1 and 2 are under way and will be disclosed elsewhere.
Supplementary Information
Synthetic procedures and additional experimental details are available free of charge at http://jbcs.sbq.org.br.
Acknowledgements
The authors gratefully acknowledge National Council for Scientific and Technological Development (CNPq), Coordination for the Improvement of Higher Education Personnel (CAPES), Foundation for Scientific and Technological Enterprises (FINATEC), Deanery of Research and Post-Graduation from the University of Brasilia (DPP-UnB), National Institute of Science and Technology (INCT)-Transcend group and Support Research of the Federal District Foundation (FAP-DF) for partial financial support.
References
1. Jun, S. S.; Xia, B.; Bok, L. S.; Drug Discovery Today 2007, 12,
657.
2. Chan, W. C. W.; Maxwell, D. J.; Gao, X.; Bailey, R. E.; Han, M.; Nie, S.; Curr. Opin. Biotechnol. 2002, 13, 40.
3. Hong, G.; Diao, S.; Antaris, A. L.; Dai, H.; Chem. Rev. 2015,
DOI: 10.1021/acs.chemrev.5b00008.
4. Luo, P. G.; Yang, F.; Yang, S. T.; Sonkar, S. K.; Yang, L.; Broglie, J. J.; Liu, Y.; Sun, Y. P.; RSC Adv. 2014, 4, 10791.
5. Zhou, J.; Sheng, Z.; Han, H.; Zou, M.; Li, C.; Mater. Lett. 2012, 66, 222.
6. Liu, S.-S.; Wang, C.-F.; Li, C.-X.; Wang, J.; Mao, L.-H.; Chen, S.; J. Mater. Chem. C 2014, 2, 6477.
7. D’Angelis, E. S. B.; Corrêa, J. R.; Medeiros, G. A.; Barreto, G.; Magalhães, K. G.; de Oliveira, A. L.; Spencer, J.; Rodrigues, M. O.; Neto, B. A. D.; Chem. - Eur. J. 2015, 21, 5055.
8. Mello, L. R. P. F.; Mali, S.; Ind. Crops Prod. 2014, 55, 187.
Karlsson, L. S.; Blighe, F. M.; De, S.; Wang, Z.; McGovern, I.;
J. Am. Chem. Soc. 2009, 131, 3611.
14. Krishnamoorthy, K.; Veerapandian, M.; Yun, K.; Kim, S.-J.;
Carbon 2013, 53, 38.
15. Wang, G.; Yang, J.; Park, J.; Gou, X.; Wang, B.; Liu, H.; Yao, J.;
J. Phys. Chem. C 2008, 112, 8192.
16. Yadav, R. M.; Dobal, P. S.; Shripathi, T.; Katiyar, R. S.; Srivastava, O. N.; Nanoscale 2009, 4, 197.
17. Rousseau, D. L.; Miller, R. E.; Leroi, G. E.; J. Chem. Phys.
1968, 48, 3409.
18. Wu, M.; Wang, Y.; Wu, W.; Hu, C.; Wang, X.; Zheng, J.; Li, Z.; Jiang, B.; Qiu, J.; Carbon 2014, 78, 480.
19. Bagga, K.; McCann, R.; Wang, M.; Stalcup, A.; Vazquez, M.; Brabazon, D.; J. Colloid Interface Sci. 2015, 447, 263. 20. Hsu, P.-C.; Chang, H.-T.; Chem. Commun. (Cambridge, U. K.)
2012, 48, 3984.
21. Hsu, P.; Shih, Z.; Lee, C.; Chang, H.; Green Chem. 2012, 14,
917.
22. Tauc, J. In Optical Properties of Solids; Abeles, F., ed.;
American Elsevier: New York, 1972, ch. 5.
23. Zhu, S.; Zhang, J.; Tang, S.; Qiao, C.; Wang, L.; Wang, H.; Liu, X.; Li, B.; Li, Y.; Yu, W.; Adv. Funct. Mater. 2012, 22, 4732. 24. Zhao, W.; Song, C.; Pehrsson, P. E.; J. Am. Chem. Soc. 2002,
124, 12418.
25. Jia, X.; Li, J.; Wang, E.; Nanoscale 2012, 4, 5572.
26. Cao, L.; Wang, X.; Meziani, M.; Lu, F.; Wang, H.; Luo, P.; Lin, Y.; Harruff, B.; Veca, L.; Murray, D.; J. Am. Chem. Soc.
2007, 129, 11318.
27. Li, H.; He, X.; Kang, Z.; Huang, H.; Liu, Y.; Liu, J.; Lian, S.; Tsang, C. H. A.; Yang, X.; Lee, S. T.; Angew. Chem., Int. Ed.
2010, 49, 4430.
28. Zhuo, S.; Shao, M.; Lee, S.; ACS Nano 2012, 6, 1059. 29. Yin, B.; Deng, J.; Peng, X.; Long, Q.; Zhao, J.; Lu, Q.; Chen, Q.;
Li, H.; Tang, H.; Zhang, Y.; Analyst (Cambridge, U. K.) 2013,
138, 6551.
30. Kong, W.; Liu, R.; Li, H.; Liu, J.; Huang, H.; Liu, Y.; Kang, Z.;
J. Mater. Chem. B 2014, 2, 5077.