Article
Printed in Brazil - ©2017 Sociedade Brasileira de Química0103 - 5053 $6.00+0.00
*e-mail: [email protected]; [email protected]
The Effect of Hydrothermal Treatment on the Morphologies and Optical Properties
of Upconversion NaYF
4:Ln
3+Crystals
Marcos A. Calil Júnior,*,a,b Átila A. C. Melo,b Emille M. Rodrigues,c Fernando A. Sigolic
and Marcelo O. Rodrigues*,b
aInstituto Federal de Educação, Ciência e Tecnologia de Goiás, Campus Valparaíso de Goiás,
BR-040, km 6, 72876-601 Valparaíso de Goiás-GO, Brazil
bInstituto de Química, Universidade de Brasília, Campus Universitário Darcy Ribeiro,
70904-970 Brasília-DF, Brazil
cLaboratório de Materiais Funcionais, Instituto de Química, Universidade Estadual de Campinas,
13083-970 Campinas-SP, Brazil
This work deals with the synthesis and characterization of upconversion NaYF4:Ln3+ crystals.
Co-precipitation and hydrothermal methods were used to synthesize NaYF4:Ln3+ crystals. The
experimental procedures were modified to obtain crystals in the cubic (α) phase, hexagonal (β) phase or a mixture between cubic and hexagonal (α/β) phases. Reaction temperature was maintained at 200 °C and the time of hydrothermal treatments were maintained at 24 and 48 h. The average diameter of the crystals ranged from 25 nm to 6.4 µm, depending on the chosen synthetic route. These materials can be applied in areas such as photodynamic therapy and bioimaging.
Keywords: upconversion, lanthanides, luminescence, NaYF4 crystals
Introduction
Inorganic crystals doped with lanthanide ions emerged in the late 1990s and thenceforward they have been intensively investigated due to their potential application in nanotechnology.1,2 Among the diversity of Ln-doped
nanoparticles (NPs) reported, sodium yttrium fluoride (NaYF4) has been considered as one of the most promising
host matrices, because it presents a high refractive index (1.430-1.470), low lattice phonon energy (< 400 cm-1) and
high transparency in the ultraviolet and visible regions.3,4
For these reasons NaYF4:Ln NPs with various well-defined
morphologies have been considered as excellent choices for the development of upconversion and downconversion nanomaterials.5
The control of structures, shape and size of inorganic crystals is of paramount importance to tune their optical properties.1 Manipulating the morphologies of these
crystals is not a simple task due to limitations involving the control of complex process, such as nucleation and crystal growth, during the reactions.6 Several research groups
have devoted efforts to develop synthetic protocols for controlling the crystallization processes, aiming to obtain crystals with well-defined size distribution, shapes and specific spectroscopic properties. Gao et al.7 reported the
synthesis of β-NaYF4:Yb3+/Ho3+ crystals with controlled
size and morphology using ethylenediaminetetraacetic acid as a chelator. There are a wide number of reports that describe syntheses of inorganic crystals via co-precipitation, solvo/hydrothermal, microwave and thermal decomposition routes.8-11
NaYF4 may crystallize as cubic (α) or hexagonal (β)
structures. However, a mixture of the α- and β-phases can be produced depending on the synthetic route.12 Therefore,
NaYF4:Ln3+ (Ln3+ = trivalent lanthanide ion) crystals have
been considered as excellent choices for the production of materials for upconversion systems. Normally, organic molecules such as oleic, citric and ethylenediamine acids, polyethyleneimine (PEI), poly(ethylene glycol) (PEG), or polyvinylpyrrolidone (PVP) have been explored as capping agents to control the morphologies and size of the crystals.13-15
to the immune system and can easily cross biological barriers. In this way, they can be applied in several areas of biology, biomedicine and medicine. The main areas of application of these materials are in photodynamic therapy and bioimaging.16
In this work, NaYF4:Ln3+ (Ln3+ = Yb3+/Er3+; Yb3+/Tm3+/Nd3+;
Yb3+/Ho3+; Yb3+/Tm3+; Yb3+/Er3+/Tm3+) crystals were
synthesized by a co-precipitation method and by a hydrothermal method, using tartaric acid as capping agent for controlling the particle size and morphology. We focused on the investigation of the luminescence properties of α-, α/β-, β-NaYF4:Ln3+ phases.
Experimental
I n a t y p i c a l s y n t h e s i s o f m o n o d i s p e r s e α/β-NaYF4:Yb3+/Tm3+/Nd3+ crystals, NaOH (8.7 mmol),
NaF (2.4 mmol) and tartaric acid (0.47 mmol) were dissolved in distilled water (10 mL) to obtain a transparent solution. Then, Y(NO3)3.5H2O (0.44 mmol),
Yb(NO3)3.6H2O (0.11 mmol), Tm(NO3)3.5H2O (0.01 mmol)
and Nd(NO3)3.6H2O (0.01 mmol) were dissolved in 1.6 mL
of distilled water. Both solutions were mixed together under vigorous stirring at room temperature. After stirring for 1 h, the mixture was transferred into a 23 mL Teflon-lined autoclave, sealed and maintained at 200 °C (with a ramp of 10 °C min-1) for 24 h. After slowly cooling to room
temperature, the product was collected by centrifugation and washed with distilled water and ethanol several times, and then dried at room temperature. The same procedure was used to synthesize α-NaYF4:Ln3+, but without the
hydrothermal treatment; all reagents were mixed together and no hydrothermal treatment was performed.
To synthesize β-NaYF4:Yb3+/Tm3+/Nd3+ crystals, 22 mg
of α/β-NaYF4:Yb3+/Tm3+/Nd3+ crystals were dispersed
into a solution containing Y(NO3)3.5H2O (0.44 mmol) in
1.6 mL of distilled water. A second solution with NaOH (8.7 mmol), NaF (2.4 mmol) and tartaric acid (0.47 mmol) dissolved in 10 mL of distilled water was prepared. Both solutions were mixed together and vigorously stirred at room temperature for 1 h and then transferred into a Teflon-lined autoclave, sealed and maintained at 200 °C for 24 h. The as-synthesized crystals were collected, washed and dried as cited previously.
The same procedure was used to synthesize crystals doped with Yb3+/Er3+, Yb3+/Tm3+ and Yb3+/Er3+/Tm3+.
Crystals characterization
X-ray powder diffraction (XRD) patterns were recorded with a Bruker D8-Focus Discover diffractometer using
radiation of 1.541 Å (40 kV and 30 mA). High-resolution transmission electron microscopy (HRTEM) images were obtained on a JEOL JEM-2100 microscope operating at an accelerating voltage of 200 kV. High-resolution scanning electron microscopy (HRSEM) images were obtained after depositing the sample on copper stripes. The samples were sputtered with gold using a Denton Vacuum Desk V. The images were obtained with a JEOL JSM-6610 microscope. The fluorescence spectra of the crystals were obtained using a Horiba iHR-320 fluorescence spectrometer.
Results and Discussion
Structural and morphological characterization
The reaction temperature and time are parameters that play important role in controlling the NaYF4 crystal
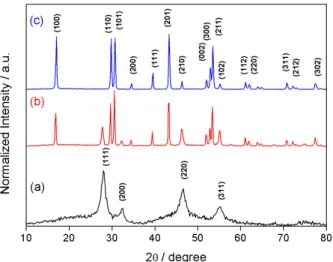
phase and morphology. Figure 1 shows the XRD patterns of α-NaYF4:Yb3+/Tm3+/Nd3+, α/β-NaYF4:Yb3+/Tm3+/Nd3+,
β-NaYF4:Yb3+/Tm3+/Nd3+ crystals. These XRD patterns are
representative of the other NaYF4:Ln3+ crystals synthesized
and clearly illustrate the formation of α-, α/β- and β-phases. It is found that α-phase crystals can be obtained from the synthetic route without hydrothermal treatment, as presented in Figure 1a. The α/β-phase can be obtained by a single hydrothermal treatment step at 200 °C and pure β-phase crystals can be obtained with an additional second hydrothermal treatment step at 200 °C (Figures 1b and 1c). The crystallinity of the crystals increases with the application of hydrothermal treatments. The intensity and position of 28.05° (111), 32.57° (200), 46.62° (220) and 55.30° (311) diffraction peaks can be assigned to the α-phase and the intensity and position of 17.12° (100), 29.79° (110), 30.66° (101), 34.56° (200), 39.51° (111), 43.32° (201), 46.15° (210), 51.89° (002), 52.85° (300), 53.52° (211), 55.16° (102), 61.02° (112), 61.98° (220), 70.85° (311), 72.21° (212) and 77.40° (302) diffraction peaks can be assigned to the β-phase. The diffraction peaks of cubic and hexagonal phases of NaYF4 crystals agree
with values found in the literature.17 In the cubic phase of
NaYF4 crystals, the cation sites are equal, since the sodium
and yttrium atoms are allocated randomly in the cationic sublattice. In the hexagonal phase, the cation sites are not equal, since there are three different types of cations sites.18
Figure 2 shows the representative HRTEM and HRSEM images of NaYF4:Ln3+ crystals in different
crystalline phases. In the α-phase, the crystals are agglomerated (Figure 2a) and its morphology is not well-determined, while the α/β-NaYF4:Yb3+/Tm3+/Nd3+
images shown in the Figures 2e and 2f clearly indicate the formation of NaYF4 crystals with a morphology of
hexagonal hollow micro-rods. The average diameter of the crystals in the β-phase is about 3 µm and the average length is about 6.4 µm. Yang et al.17 also reported the
synthesis of β-NaYF4 crystals using tartaric acid as
capping agent and obtained hexagonal tablets with an average diameter of 4.6 µm and an average length of 1.3 µm. The difference of average diameter of our synthesized crystals and those reported by Yang et al.17
can be explained by reaction time; we used a 24 plus 24 h route to synthesized hexagonal crystals, while Yang et al.17
used a route of 12 h. This additional time was essential for crystal growth. Also, we found that the phase transition process can be controlled by the reaction time at the same
hydrothermal temperature (200 °C). When the reaction time is increased, a hexagonal phase emerges.
Upconversion photoluminescence properties
NaYF4:Ln3+ crystals can show upconversion
photoluminescence in all α-, α/β- and β-phases (see Figure S1 in Supplementary Information). The photoluminescence measurements were performed in the solid state. Under 980 nm laser excitation, α/β- and β-NaYF4:Yb3+/Er3+ crystals show bands in the green
emission region with maxima at 519 nm (2H
11/2→4I15/2) and
538 nm (4S
3/2→4I15/2). The band in the red emission region
with maximum at 653 nm is attributable to the 4F
9/2→4I15/2
transition of the Er3+ ions. No upconversion emission is
emitted by the α-NaYF4:Yb3+/Er3+ crystals because cubic
crystals are more symmetrical than cubic/hexagonal and hexagonal crystals, since the photoluminescence is inversely proportional to the symmetry of the crystals. In this work, the discussion about α/β-NaYF4:Yb3+/Er3+
crystals is representative.
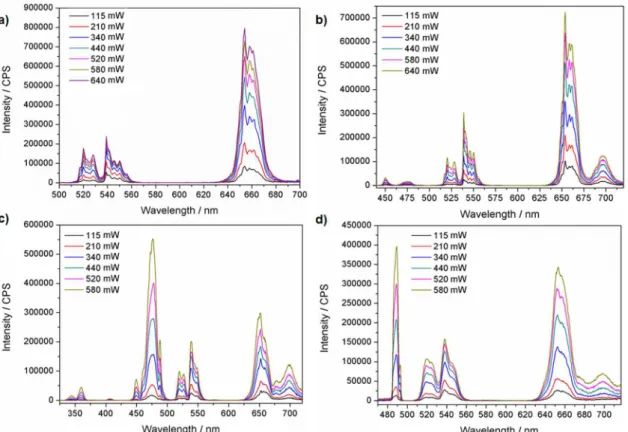
The excitation power-dependent upconversion of α/β-NaYF4:Yb3+/Ln3+ crystals was investigated (Figure 3).
These crystals were chosen because of the small size of the crystals associated with good emission luminescence, which are essential for applications in the medical and biomedical fields. The bands in red emission region are more favored with increasing laser power in both Yb3+/Er3+-,
Yb3+/Er3+/Tm3+- and Yb3+/Tm3+/Nd3+-doped crystals. In the
case of Yb3+/Tm3+-doped crystals, the band in blue emission
region is more favored with increasing laser power. It is found that the upconversion emission intensity (IUC)
is directly proportional to the infrared laser power (IIR),
F i g u re 1 . XRD patterns of (a) α-NaYF4:Yb3+/Tm3+/Nd3+,
(b) α/β-NaYF4:Yb3+/Tm3+/Nd3+ and (c) β-NaYF4:Yb3+/Tm3+/Nd3+
crystals. Reaction conditions: reaction temperature (a) room temperature, (b) 200 ºC, (c) 200 ºC; reaction time (a) 30 min, (b) 24 h, (c) 24 h plus 24 h.
Figure 2. Representative HRTEM images of (a) α-NaYF4:Yb3+/Er3+ and (b, c, d) α/β-NaYF4:Yb3+/Tm3+/Nd3+. Representative HRSEM images of
and in this way the number of absorbed photons can be calculated.19 The laser power dependence of the
upconverted emissions was obtained by fitting the experimental data (Figure 4). All four Yb3+/Er3+-, Yb3+/
Er3+/Tm3+-, Yb3+/Tm3+- and Yb3+/Tm3+/Nd3+-doped crystals
show two- or three-photon excitation processes. In the case of NaYF4:Yb3+/Er3+ crystals, a slope of 2 for the green
emission in 520 nm, 2 for the green emission in 540 nm and 2 for the red emission in 654 nm were obtained (these values have been approximated to an integer). The peak areas of the upconverted emission bands (see Figure S2 in Supplementary Information) show that the intensity of the emission bands are changed when the laser power is increased.
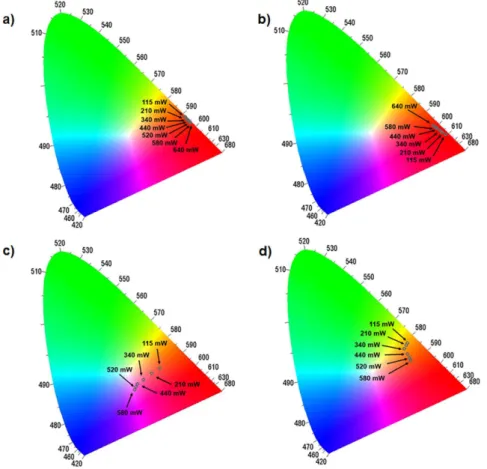
Figure 5 shows the CIE 1931 chromaticity diagrams of the laser power dependence of the synthesized crystals. For the α/β-NaYF4:Yb3+/Er3+, α/β-NaYF4:Yb3+/Er3+/Tm3+
and α/β-NaYF4:Yb3+/Tm3+/Nd3+ crystals, as the laser power
increases, the emission color of the crystals dislocates to the red region, since 4S
3/2→4I15/2 transition is more favored in
both α/β-NaYF4:Yb3+/Er3+ and α/β-NaYF4:Yb3+/Er3+/Tm3+
crystals, 1G
4 → 3F4 transition is more favored in the
α/β-NaYF4:Yb3+/Tm3+/Nd3+ crystals. Moreover, for
the α/β-NaYF4:Yb3+/Tm3+ crystals, the emission color
dislocates to the blue region, since 1D
2→3F4 transition is
more favored with increasing laser power.
The energy level diagrams and proposed energy transfer mechanisms of the synthesized crystals are shown in the Supplementary Information (Figures S3-S6), according to the literature.20-23 For the α/β-NaYF
4:Yb3+/Er3+ (Figure S3),
both red and green emissions need two-photon process to populate the 2H
11/2, 4S3/2 and 4F9/2 levels. Initially, the ground
state electrons are excited to the 4I
11/2 intermediate state of
the Er3+ ion and then excited to the 4F
7/2 state via energy
transfer from the Yb3+ ions to the Er3+ ions. Secondly, a
nonradiative decay occurs from the 2H
11/2 and 4S3/2 excited
state levels and then these electrons return to ground state and the green (520 and 540 nm) UC emission is generated. Subsequently, the excited electrons also can populate the
4F
9/2 excited state level and then decay to the 4I15/2 ground
state level to produce the red (654 nm) UC emission.
Conclusions
The lanthanide-doped NaYF4 crystals with controlled
sizes have been synthesized by co-precipitation and hydrothermal methods. The morphology of the α, α/β and β-NaYF4:Ln3+ crystals was discussed. The use of the
co-precipitation method produced crystals in the α-phase, while the use of 24 h hydrothermal treatment produced crystals in the α/β-phase and the use of two subsequent hydrothermal treatments (24 plus 24 h) produced crystals
Figure 3. Upconversion emission spectra of (a) α/β-NaYF4:Yb3+/Er3+, (b) α/β-NaYF4:Yb3+/Er3+/Tm3+, (c) α/β-NaYF4:Yb3+/Tm3+ and α/β-NaYF4:Yb3+/Tm3+/Nd3+
Figure 4. Laser power dependence of the upconverted emissions of (a) α/β-NaYF4:Yb3+/Er3+, (b) α/β-NaYF4:Yb3+/Er3+/Tm3+, (c) α/β-NaYF4:Yb3+/Tm3+
and α/β-NaYF4:Yb3+/Tm3+/Nd3+ crystals.
Figure 5. CIE 1931 chromaticity diagrams of the laser power dependence of the (a) α/β-NaYF4:Yb3+/Er3+, (b) α/β-NaYF4:Yb3+/Er3+/Tm3+, (c) α/β-NaYF4:Yb3+/Tm3+
in the β-phase. In addition, the UC luminescence properties of the NaYF4:Ln3+ crystals under 980 nm excitation
were thoroughly investigated. We found that the UC luminescence properties are dependent on the size and morphology of the crystals. In general, the β-phase crystals showed higher luminescence intensity than α-phase and α/β-phase crystals, since the β-phase is less symmetric than the α- and α/β-phases. Furthermore, these materials are expected to have potential applications in biological areas, such as in photodynamic therapy and bioimaging.
Supplementary Information
Supplementary data are available free of charge at http://jbcs.sbq.org.br as PDF file.
Acknowledgments
The authors thank National Council for Scientific and Technological Development (CNPq), Coordination for the Improvement of Higher Education Personnel (CAPES), Foundation for Scientific and Technological Enterprises (FINATEC), the Research and Graduate School of the University of Brasilia (DPP-UnB), INCT-Inami and Research Support Foundation of the Federal District (FAP-DF) for partial financial support.
References
1. Qiu, P.; Zhou, N.; Chen, H.; Zhang, C.; Gao, G.; Cui, D.;
Nanoscale2013, 5, 11512.
2. Zheng, W.; Zhou, S.; Chen, Z.; Hu, P.; Liu, Y.; Tu, D.; Zhu, H.; Li, R.; Huang, M.; Chen, X.; Angew. Chem., Int. Ed.2013, 52, 6671.
3. Renero-Lecuna, C.; Martin-Rodriguez, R.; Valiente, R.; González, J.; Rodriguez, F.; Krämer, K. W.; Güdel, H. U.; Chem. Mater.2011, 23, 3442.
4. Thoma, R. E.; Herbert, G. M.; Insley, H.; Weaver, C. F.; Inorg. Chem. 1963, 2, 1005.
5. Wang. F.; Liu, X.; J. Am. Chem. Soc.2008, 130, 5642.
6. Zeng, S.; Ren, G.; Xu, C.; Yang, Q.; CrystEngComm2011, 13, 1384.
7. Gao, W.; Zheng, H.; Han, Q.; He, E.; Wang, R.; CrystEngComm
2014, 16, 6697.
8. Xia, A.; Deng, Y.; Shi, H.; Hu, J.; Zhang, J.; Wu, S.; Chen, Q.; Huang, X.; Shen, J.; ACS Appl. Mater. Interfaces2014, 6, 18329.
9. Assaaoudi, H.; Shan, G.-B.; Dyck, N.; Demopoulos, G. P.;
CrystEngComm2013, 15, 4739.
10. Hazra, C.; Samanta, T.; Asaithambi, A. V.; Mahalingam, V.;
Dalton Trans.2014, 43, 6623.
11. Mahalingam, V.; Vetrone, F.; Naccache, R.; Speghini, A.; Capobianco, J. A.; J. Mater. Chem.2009, 19, 3149.
12. Sui, Y.; Tao, K.; Tian, Q.; Sun, K.; J. Phys. Chem. C2012, 116, 1732.
13. Wong, H.-T.; Vetrone, F.; Naccache, R.; Chan, H. L. W.; Hao, J.; Capobianco, J.; J. Mater. Chem.2011, 21, 16589.
14. Tang, S.-H.; Wang, J.; Yang, C.-X.; Dong, L.-X.; Kong, D.; Yan, X.-P.; Nanoscale2014, 6, 8037.
15. Hu, Y.; Sun, Y.; Li, Y.; Sun, S.; Huo, J.; Zhao, X.; RSC Adv.
2014, 4, 43653.
16. Gnach, A.; Lipinski, T.; Bednarkiewicz, A.; Rybka, J.; Capobianco, J. A.; Chem. Soc. Rev.2015, 44, 1299.
17. Yang, J.; Shen, D.; Li, X.; Li, W.; Fang, Y.; Wei, Y.; Yao, C.; Tu, B.; Zhang, F.; Zhao, D.; Chem. Eur. J.2012, 18, 13642.
18. Wang, Z.; Hao, J.; Chan, H. L. W.; Wong, W. T.; Wong, K. L.;
Small2012, 8, 1863.
19. Pollnau, M.; Gamellin, D. R.; Lüthi, S. R.; Güdel, H. U.; Hehlen, M. P.; Phys. Rev. B: Condens. Matter Mater. Phys.2000, 61,
3337.
20. Park, Y. I.; Lee, K. T.; Suh, Y. D.; Hyeon, T.; Chem. Soc. Rev.
2015, 44, 1302.
21. Glaspell, G.; Anderson, J.; Wilkins, J. R.; El-Shall, M. S.;
J. Phys. Chem. C2008, 112, 11527.
22. Li, C.; Quan, Z.; Yang, J.; Yang, P.; Lin, J.; Inorg. Chem.2007,
46, 6329.
23. Lv, R.; Yang, G.; He, F.; Dai, Y.; Gai, S.; Yang, P.; Nanoscale
2014, 6, 14799.