Article
Printed in Brazil - ©2017 Sociedade Brasileira de Química0103 - 5053 $6.00+0.00*e-mail: [email protected]
Feasibility of DLLME for the Extraction and Preconcentration of As and Cd in
Sugar for Further Determination by ICP-MS
Tassia S. Seeger,a Paula Dalla Vecchia,a Eduarda Q. Machado,a Karine Reinke,a
Marcia F. Meskob and Fabio A. Duarte*,a
aDepartamento de Química, Universidade Federal de Santa Maria,
97105-900 Santa Maria-RS, Brazil
bCentro de Ciências Químicas, Farmacêuticas e de Alimentos, Universidade Federal de Pelotas,
96160-000 Pelotas-RS, Brazil
A method for determining low levels of As and Cd by dispersive liquid-liquid microextraction (DLLME) and inductively coupled plasma mass spectrometry (ICP-MS) was proposed. The following parameters that affect extraction efficiency were investigated: type and volume of extraction solvent (1000 µL acetone), type and volume of dispersive solvent (75 µL carbon tetrachloride), amount of ammonium pyrrolidinedithiocarbamate and sodium diethyldithiocarbamate as chelating agents, sample mass (0.5 g in 10 mL ultrapure water), pH of sample solution (2.0) and number of washing steps (one). Accuracy was evaluated by analytes determination in sugar samples by ICP-MS after digestion by microwave-induced combustion (MIC). No significant difference was observed between results of the proposed DLLME method and MIC in the case of both analytes. Instrument calibration was performed by the standard addition method and good linearity was achieved. Limits of quantification (LOQs) were 0.7 and 0.2 ng g-1 for As and Cd, respectively. The main advantages of this method are relatively high sample mass, low dilution, suitable preconcentration factors and significantly low LOQs (ng g-1 range). When the proposed method was used for determining As and Cd in four sugar samples, their concentrations ranged from 1.13 to 2.95 ng g-1 and from 0.31 to 0.43 ng g-1, respectively.
Keywords: dispersive liquid-liquid microextraction, sugar, arsenic, cadmium, inductively coupled plasma mass spectrometry
Introduction
Sugar has been widely consumed around the world by people of all ages, since it is an important ingredient found in several products, such as sweets, softdrinks and bread.1,2 Similarly to other food, it is prone to contamination by toxic elements throughout its production and manufacturing processes.3 Some elements can be classified into essential or toxic, depending on the role they play in the metabolism of living organisms. Ca, Cu and Zn are essential for life whereas As, Cd and others do not have any known biological function and may be toxic, depending on their concentrations, thus posing potential risks to human health.4-7 Arsenic may cause several health problems with mutagenic, carcinogenic and teratogenic effects. In humans, it can affect neurological, cardiovascular
and respiratory systems, besides causing hypertension.7-9 Cadmium is the most toxic element to humans, since it leads to renal failure, hypertension, emphysema and carcinogenic hazards, mainly in the kidney and prostate.8,9 Therefore, As and Cd must be considered toxic even at low concentrations and must be monitored in the environment, food and beverages.
Several techniques have been developed for simultaneous element determination at ultratrace levels in food samples. Inductively coupled plasma optical emission spectrometry
(ICP-OES)10 and inductively coupled plasma mass
of hazardous reagents (mainly inorganic acids), as well as high pressure and temperature. In addition, the use of microwave-assisted protocols can lead to faster processing and lower dissolved carbon content in digests. Although increase in sample mass may provide better LODs, high amounts of reagents are needed in order to assure digestion efficiency. Therefore, blank values are likely to be higher when the amounts of reagents are high. Therefore, the use of simple and inexpensive methods, with low reagent consumption and high processing frequency, is the best choice to overcome the disadvantages mentioned before.
In order to reduce solvent consumption and improve enrichment factors, extraction/microextraction methods have been extensively used, mainly for water samples. Some microextraction methods, such as single drop microextraction (SDME), dispersive liquid-liquid microextraction (DLLME) and solidified floating organic drop microextraction (SFODME) have recently been applied to organic and inorganic analytes.16-18 Dispersive liquid-liquid microextraction was developed to extract organic compounds from water by Rezaee et al.19 and then successfully applied to the extraction of elements from water,20-23 food, beverages,24-26 tobacco,27 pharmaceuticals28 and other matrices. The main advantages of DLLME are simplicity, low cost, low reagent consumption, high enrichment factors and agreement with green analytical chemistry.29,30 It should be highlighted that DLLME may be used in combination with different detection techniques, such as ultraviolet-visible spectrophotometry (UV-Vis),31,32 flame atomic absorption spectrometry (FAAS),33 ICP-OES,34 and ICP-MS.35
In this study, a DLLME method was developed for the extraction and preconcentration of toxic elements (As and Cd) in sugar for subsequent determination by ICP-MS. Some important parameters of the DLLME method, such as type and volume of extraction and dispersive solvent, pH of sample solution, chelating agent, sample mass and number of washing steps, were studied. The proposed DLLME method was applied to the determination of As and Cd in four sugar samples. Accuracy was evaluated and results were compared with those obtained after microwave-induced combustion (MIC) combined with determination by ICP-MS.
Experimental
Instrumentation
An inductively coupled plasma mass spectrometer
(NexION® 300X, PerkinElmer, USA) was used for
determining elements in extracts and digested samples.
The instrument is equipped with a concentric nebulizer (Meinhard, USA), a cyclonic spray chamber (PerkinElmer) and a torch with an injector tube (both in quartz), with internal diameter of 2 mm. Radiofrequency power was set at 1300 W and argon (99.996%, White Martins, Brazil) was used for plasma generation. Plasma, auxiliary and nebulizer gas flow rates were set at 18, 1.2 and 1.05 L min-1, respectively.
A pHmeter (model 781, Metrohm, Switzerland) was used for pH adjustment of the sugar solution prior to DLLME. A microsyringe (1.25 mL, Hamilton, USA) was used for handling organic solvents. The DLLME procedure was carried out by using borosilicate glass tube with conical bottom (15 mL, Laborglas, Brazil). A centrifuge (Quimis, Brazil) was used for phase separation after the DLLME procedure.
In order to compare results, sugar sample was digested by MIC in a microwave oven (Multiwave 3000, Anton Paar, Austria) equipped with eight high-pressure quartz vessels (80 mL capacity; maximum operation temperature and pressure of 280 °C and 80 bar, respectively).
Reagents and samples
All solutions and standards were prepared with ultrapure water (18.2 MΩ cm, Millipore Corp., USA). Nitric acid (Merck, Germany) was purified by a sub-boiling system (DuoPUR, Milestone, Italy). Reference solutions were prepared in 5% HNO3 by dilution of multielement stock standard solution (SCP 33 MS, SCP Science, Canada) with 10 mg L-1 of each analyte.
Ammonium pyrrolidinedithiocarbamate (APDC, Fluka, USA) and sodium diethyldithiocarbamate (DDTC, Merck) were evaluated as chelating agents. The following solvents were evaluated for analyte extraction: 1,2-dichlorobenzene (C6H4Cl2), carbon tetrachloride (CCl4), dichloroethane (C2H4Cl2), monochlorobenzene (C6H5Cl), octanol (C8H17OH) and trichloroethylene (C2HCl3) from Merck; chloroform (CHCl3) from Sigma-Aldrich (USA);
and dichloromethane (CH2Cl2) from Belga Química
(Brazil). Acetone (Synth, Brazil), acetonitrile (Carlo Erba Reagents, Italy), ethanol (F. Maia Indústria, Brazil) and methanol (Vetec, Brazil) were evaluated as dispersive solvents. Diluted solutions of HNO3 and NH4OH (both from Merck) were used for adjusting the pH of sugar solutions. Ammonium nitrite solution (50 µL 6 mol L-1 solution, Sigma-Aldrich) was used as combustion aid in the MIC method.
coarse sugar crystals whereas samples B and D were white granulated sugar. Sample A was arbitrarily chosen to develop the DLLME method and to evaluate accuracy.
DLLME optimization
Different types of dispersive solvents (acetone, acetonitrile, ethanol and methanol), extraction solvents (1,2-dichlorobenzene, carbon tetrachloride, chloroform, dichloroethane, dichloromethane, monochlorobenzene, octanol and trichloroethylene) and chelating agents (DDTC and APDC, both at 1% (m/v) solution) were evaluated. After selecting the best mixture of solvents and the volumes of chelating agents, the following variables were investigated: volume of dispersive solvent (from 400 to 1100 µL), volume of extraction solvent (from 25 to 150 µL), pH of sugar solution (from 1.0 to 7.0), volume of APDC and DDTC as chelating agents (from 50 to 450 µL, with final volume limited to 500 µL), sample mass (from 0.5 to 4 g) and number of washing steps (0 to 4). All evaluations took into account analyte recovery and interferences during measurements.
DLLME procedure
Samples were weighted, spiked and dissolved in 10 mL of water. Afterwards, the pH was adjusted (by HNO3 or NH4OH solutions) and transferred to 15 mL conical-bottom glass centrifuge tubes. A mixture of chelating agents (APDC and DDTC, both at 1%), whose total volume was 500 µL, was added into the tube, followed by rapid injection (with glass microsyringe) of a mixture which contained dispersive and extraction solvents. The mixture was gently shaken and centrifuged at 3000 rpm for 3 min. The sedimented phase (extract containing analytes) was washed with 5 mL water and submitted to a new centrifugation step. The washing procedure was repeated as many times as necessary. The aqueous phase was removed by a Pasteur pipette whereas the remaining extraction solvent was evaporated at 80 °C for 3 h. After evaporation, from 1 to 2 mL 0.7 mol L-1 HNO
3 solution was added into the glass tube and the resulting solution was introduced into the ICP-MS instrument.
Microwave-induced combustion
In MIC, about 500 mg sugar was pressed as pellets, accurately weighted and placed together with a filter paper on the quartz holder, followed by the addition of 50 µL 6 mol L-1 NH
4OH solution to the filter paper. The sample holder was introduced into the quartz vessel, previously
charged with 6 mL 7 mol L-1 HNO
3 as the absorbing solution. After they were closed and fixed in the rotor, vessels were pressurized with 20 bar of oxygen and a microwave irradiation program was applied (1400 W for 5 min and 20 min for cooling). After combustion, digests were diluted up to 25 mL of water and analytes were determined by ICP-MS. It should be mentioned that this is the first report of MIC for sugar digestion.
In order to evaluate the results, the GraphPad InStat (Version 3.00, 1997) software was used for applying the Student’s t-test to compare two averages and 95% significance level was adopted for all comparisons.
Results and Discussion
Types of extraction and dispersive solvents and chelating agents
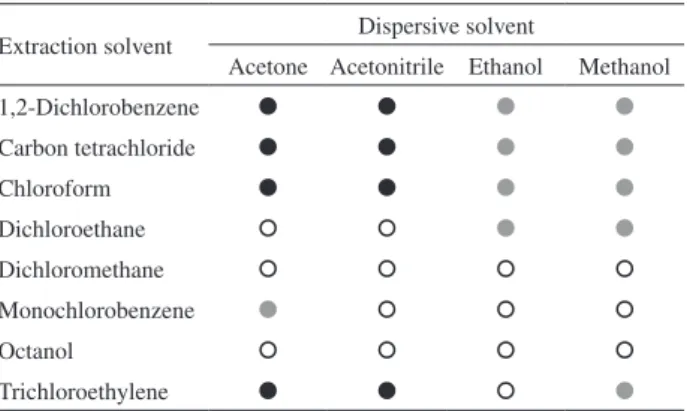
Initially, all combinations between extraction and dispersive solvents were evaluated considering the formation of the sedimented phase. Thus, 700 µL of a dispersive solvent (acetone, acetonitrile, ethanol and methanol) were mixed with 100 µL of an extraction solvent (1,2-dichlorobenzene, carbon tetrachloride, chloroform, dichloroethane, dichloromethane, monochlorobenzene, octanol and trichloroethylene). In this case, only the visual aspect of the sedimented phase was considered (without analyte spike) and results are shown in Table 1. Results were classified as (i) formation of the sedimented phase; (ii) sedimented phase with insoluble material; and (iii) no sedimented phase. Mixtures without a sedimented phase or the ones with insoluble material (solid) were not evaluated for subsequent experiments. Experiments that yielded insoluble material were not considered because the dissolution of solid was not only difficult but also susceptible to interferences during ICP-MS measurements. A completely separated sedimented phase was observed when acetone and acetonitrile were combined to carbon tetrachloride, chloroform, 1,2-dichlorobenzene and trichloroethylene. These mixtures were evaluated for further experiments.
analyte recovery was observed when the mixture of both chelating agents (250 µL 1% APDC solution and 250 µL 1% DDTC solution) was used instead of the chelating agent alone (this effect is discussed subsequently). With acetone, carbon tetrachloride and a mixture of chelating agents (without any pH adjustment), As and Cd recoveries were about 10 and 79%, respectively.
Effect of pH
Extraction efficiency is largely dependent on the pH of the sample. It is important because it controls the interactions between analytes and chelating agents to assure effective extraction. The pH of the sugar solution was studied with values ranging from 1.0 to 7.0. In the case of both analytes, better recoveries were observed at pH from 1.0 to 2.0 (Figure 1). The latter was selected for further experiments. It should be highlighted that, since both chelating agents are suitable for element complexation at low pH values, the highest pH was selected (pH 2.0).
Amount of chelating agents
The effect of the volume of 1% APCD and 1% DDTC solutions on analytes recovery was investigated. Generally, both APDC and DDTC have been widely used for metal extraction due to their ability to form complexes with divalent and trivalent cations.36 In these experiments, the volume of chelating agent added into the sugar solution was kept constant at 500 µL and the volumes of APDC and DDTC ranged from 50 to 450 µL. Taking into account the relationship between analytes and the amount of chelating agents, as well as the recoveries of both analytes, the mixture with 50 µL APDC and 450 µL DDTC was considered suitable for As and Cd extraction.
Volumes of dispersive and extraction solvents
Volumes of dispersive and extraction solvents were evaluated to achieve the highest extraction efficiency. Initially, the volume of acetone was investigated from 400 to 1100 µL, but the volume of the extraction solvent (100 µL carbon tetrachloride) was kept constant. Results are shown in Figure 2. Better recoveries were obtained when 1000 and 1100 µL acetone were used for both analytes. Taking into account that no statistical difference (Student’s t-test, p < 0.05) and low standard deviation was observed for both analytes, the lowest volume of acetone (1000 µL) was chosen for subsequent experiments.
A small volume of extraction solvent provides a high preconcentration factor; thus, the use of low volumes is important because halogenated extraction solvents are toxic. With a constant volume of acetone (1000 µL), the volume of carbon tetrachloride, from 25 to 150 µL, was investigated. Figure 3 shows that better recoveries for both analytes were obtained with 75 µL carbon tetrachloride as Table 1. Formation of sedimented phase using mixtures of dispersive
and extraction solvents
Extraction solvent Dispersive solvent
Acetone Acetonitrile Ethanol Methanol
1,2-Dichlorobenzene
Carbon tetrachloride
Chloroform
Dichloroethane
Dichloromethane
Monochlorobenzene
Octanol
Trichloroethylene
Formation of sedimented phase; sedimented phase with insoluble material; no sedimented phase.
Figure 2. Influence of the volume of acetone on As and Cd extraction
(n = 4). Conditions: 2 g sugar in 10 mL water, 100 µL carbon tetrachloride, pH 2.0, 50 µL 1% APDC solution and 450 µL 1% DDTC solution, two washing steps and centrifugation at 3000 rpm for 3 min.
Figure 1. Influence of sample pH on As and Cd extraction (n = 4).
the extraction solvent. This volume was selected for further experiments.
Sample mass
An important parameter to achieve low LODs is the increase in sample mass. However, high sample mass can affect extraction efficiency and/or cause interferences during measurements by spectrometric techniques. Experiments were performed with sample mass from 0.5 to 4.0 g in 10 mL ultrapure water. Sample mass that was higher than 4.0 g was not evaluated because sugar was not completely soluble in 10 mL water. Thus, better results were achieved when 0.5 g sugar was used.
Effect of washing steps
In some cases, a washing step in the extract is required to remove solid material from the sample matrix since it may cause interferences in the determination step. Therefore, 0, 1, 2, 3 and 4 washing steps were evaluated. When no washing was carried out, recoveries of both analytes were overestimated. However, when 1, 2, 3 and 4 washing steps were performed, results were statistically similar (Student’s t-test, p < 0.05). As a result, one washing step was chosen for subsequent experiments. It should be mentioned that higher recoveries of As with no washing step may be caused by matrix interferences from C (charge transfer) or Cl (polyatomic).37,38
Analytical figures of merit
After the optimization of the proposed DLLME method, the matrix effect was also evaluated by instrument calibration using conventional external calibration (CAL 1), external calibration submitting the standards to the DLLME
procedure (CAL 2) and standard addition method submitting the standards to the DLLME procedure (CAL 3). In this case, results obtained by MIC were used as reference values for the evaluation of all calibration modes. Therefore, only CAL 3 was suitable for As and Cd quantification. In the case of both analytes, good linearity (better than 0.9999) was obtained, with working range from 0.25 to 10 µg L-1 for As and from 0.25 to 5 µg L-1 for Cd. The calculation of LOD and limit of quantification (LOQ) values was in agreement with IUPAC recommendations, with the use of standard deviations (3 and 10σ, respectively) of 10 replicates of blank from the
calibration curve. LOD and LOQ values were expressed as ng g-1, considering 0.5 g sugar and the final volume of 1 mL (after preconcentration). LOQs of the proposed method were 0.7 and 0.2 ng g-1 for As and Cd, respectively. The optimized conditions of DLLME were applied to the quantification of As and Cd in four sugar samples. Results are shown in Table 2. In general, both analytes could be determined and the concentrations of As and Cd were lower than the limit concentration established by the Brazilian legislation (100 ng g-1 for As in sugar and 1000 ng g-1 for Cd in food).39,40
The accuracy of the proposed DLLME method was evaluated for analyte determination by ICP-MS, in digests obtained by MIC and by recovery tests. After MIC, concentrations of As and Cd in sample A were 0.95 ± 0.19 and 0.35 ± 0.04 ng g-1, respectively. No significant difference (Student’s t-test, p < 0.05) was found among results obtained by both MIC and DLLME methods. In recovery tests, the sample solution was spiked with a reference solution containing both analytes prior to the DLLME method. As and Cd recoveries after DLLME ranged from 89 to 107%. The main advantages of the proposed method are the relatively high sample mass (considering that it is hard to digest this kind of matrix), low dilution and suitable preconcentration factor (from 5 to 10 times) and significant low LOQs (ng g-1 range).
Conclusions
The proposed DLLME method for As and Cd extraction Figure 3. Influence of the volume of carbon tetrachloride on As and Cd
extraction (n = 4). Conditions: 2 g sugar in 10 mL water, 1000 µL acetone, pH 2.0, 50 µL 1% APDC solution and 450 µL 1% DDTC solution, two washing steps and centrifugation at 3000 rpm for 3 min.
Table 2. Concentration of As and Cd (mean ± standard deviation, n = 4) in sugar by ICP-MS after the DLLME method
Sample Concentration / (ng g
-1)
As Cd
A 1.13 ± 0.13 0.39 ± 0.02
B 2.51 ± 0.06 0.31 ± 0.02
C 2.95 ± 0.06 0.43 ± 0.03
and preconcentration combined with determination by ICP-MS was successfully applied to sugar samples. DLLME shows advantages, such as simplicity, low cost, low LOQs, suitable enrichment factors (5 to 10 times) and low waste generation. In addition, the proposed method showed low LODs and good agreement with the MIC method. Concentrations ranged from 1.13 to 2.95 ng g-1 for As and from 0.31 to 0.43 ng g-1 for Cd. This method could be considered an alternative to current routine analysis to monitor As and Cd at ultratrace levels in sugar.
Acknowledgments
The authors are grateful to Coordenação de Aperfeiçoamento de Pessoal de Nível Superior (CAPES), Conselho Nacional de Desenvolvimento Científico e Tecnológico (CNPq) and Fundação de Amparo à Pesquisa do Estado do Rio Grande do Sul (FAPERGS) for supporting this study.
References
1. Miller-Ihli, N. J.; J. Agric. Food Chem.1995, 43, 923. 2. Škrbić, B.; Ðurišić-Mladenović, N.; Mačvanin, N.; Food Sci.
Technol. Res. 2010, 16, 123.
3. Skrbic´, B.; Gyura, J.; Food Control2007, 18, 135.
4. Mertz, W.; Science 1981, 213, 1332.
5. Scott, D.; Around the World in 18 Elements; The Royal Society
of Chemistry: Cambridge, UK, 2014.
6. Afridi, H. I.; Kazi, T. G.; Jamali, M. K.; Kazi, G. H.; Arain, M. B.; Jalbani, N.; Shar, G. Q.; Sarfaraz, R. A.; Toxicol. Ind. Health2006, 22, 381.
7. Duarte, F. A.; Pereira, J. S. F.; Mesko, M. F.; Goldschmidt, F.; Flores, E. M. M.; Spectrochim. Acta, Part B2007, 23, 1097.
8. Kabata-Pendias, A.; Mukherjee, A. B.; Trace Elements from
Soil to Human; Springer: Berlin, Germany, 2007.
9. Oosthuizen, J.; Environmental Health-Emerging Issues and Practice; InTech: Rijeka, Croatia, 2012.
10. Feist, B.; Mikula, B.; Food Chem. 2014, 147, 302.
11. Hartwig, C. A.; Pereira, R. M.; Rondan, F. S.; Cruz, S. M.; Duarte, F. A.; Flores, E. M. M.; Mesko, M. F.; J. Anal. At. Spectrom. 2016, 31, 523.
12. Becker, J. S.; Inorganic Mass Spectrometry: Principles and Applications; John Wiley & Sons: Chichester, England, 2007.
13. Wang, X.; Chen, J.; Zhou, Y.; Liu, X.; Yao, H.; Ahmad, F.; Anal. Lett.2015, 48, 1787.
14. Maciel, J. V.; Knorr, C. L.; Flores, E. M. M.; Muller, E. I.; Mesko, M. F.; Primel, E. G.; Duarte, F. A.; Food Chem. 2014, 145, 927.
15. Feng, X.; Wu, S.; Wharmby, A.; Wittmeier, A.; J. Anal. At. Spectrom. 1999, 14, 939.
16. Ocana-Goñzález, J. A.; Fernández-Torres, R.; Bello-López, M. Á.; Ramos-Payán, M.; Anal. Chim. Acta 2016, 905, 8.
17. Yan, Y.; Chen, X.; Hu, S.; Bai, X.; J. Chromatogr. A 2014, 1368, 1. 18. Hu, B.; He, M.; Chen, B.; Xia, L.; Spectrochim. Acta, Part B
2013, 86, 14.
19. Rezaee, M.; Assadi, Y.; Hosseini, M. R. M.; Aghaee, E.; Ahmadi, F.; Berijani, S.; J. Chromatogr. A 2006, 1116, 1.
20. Jahromi, E. Z.; Bidari, A.; Assadi, Y.; Hosseini, M. R. M.; Jamali, M. R.; Anal. Chim. Acta 2007, 585, 305.
21. Bidari, A.; Jahromi, E. Z.; Assadi, Y.; Hosseini, M. R. M.;
Microchem. J. 2007, 87, 6.
22. Zhou, Q.; Zhao, N.; Xie, G.; J. Hazard. Mater. 2011, 189, 48.
23. Soares, B. M.; Pereira, E. R.; Maciel, J. V.; Vieira. A. A.; Duarte, F. A.; J. Sep. Sci.2013, 36, 3411.
24. Peng, B.; Shen, Y.; Gao, Z.; Zhou, M.; Ma, Y.; Zhao, S.; Food Chem. 2015, 176, 288.
25. Wang, X.; Wu, L.; Cao, J.; Hong, X.; Ye, R.; Chen, W.; Yuan, T.; Food Addit. Contam., Part A2016, 33, 1190.
26. Mandlate, J. S.; Soares, B. M.; Seeger, T. S.; Dalla Vecchia, P.; Mello, P. A.; Flores, E. M. M.; Duarte, F. A.; Food Chem. 2017, 221, 907.
27. Alothman, Z. A.; Habila, M. A.; Yilmaz, E.; Waradand, I.; Soylak, M.; J. Anal. Chem. 2015, 70, 691.
28. Rastegarzadeh, S.; Pourreza, N.; Larki, A.; Anal. Methods 2014, 6, 3500.
29. Saraji, M.; Boroujeni, M. K.; Anal. Bional. Chem. 2014, 406,
2027.
30. Spietelun, A.; Marcinkowski, L.; Guardia, M.; Namiesnik, J.;
Talanta 2014, 119, 34.
31. Pereira, E. R.; Soares, B. M.; Maciel, J. V.; Caldas, S. S.; Andrade, C. F. F.; Primel, E. G.; Duarte, F. A.; Anal. Methods 2013, 5, 2273.
32. Maciel, J. V.; Soares, B. M.; Mandlate, J. S.; Picoloto, R. S.; Bizzi, C. A.; Flores, E. M. M.; Duarte, F. A.; J. Agric. Food Chem.2014, 62, 8340.
33. Seeger, T. S.; Rosa, F. C.; Bizzi, C. A.; Dressler, V. L.; Flores, E. M. M.; Duarte, F. A.; Spectrochim. Acta, Part B 2015, 105, 136.
34. Silva, E. S.; Correia, L. O.; Santos, L. O.; Vieira, E. V. S.; Lemos, V. A.; Microchim. Acta 2012, 178, 269.
35. Jia, X.; Han, Y.; Liu, X.; Duan, T.; Chen, H.; Microchim. Acta 2010, 171, 49.
36. Rosa, F. C.; Duarte, F. A.; Paniz, J. N. G.; Heidrich, G. M.; Nunes, M. A. G.; Flores, E. M. M.; Dressler, V. L.; Microchem. J.2015, 123, 211.
37. Grindlay, G.; Mora, J.; de Loos-Vollebregt, M.; Vanhaecke, F.;
Spectrochim. Acta, Part B 2013, 86, 42.
38. Muller, A. L. H.; Oliveira, J. S. S.; Mello, P. M.; Muller, E. I.; Flores, E. M. M.; Talanta2015, 136, 136.
o Regulamento Técnico MERCOSUL sobre Limites Máximos
de Contaminantes Inorgânicos em Alimentos; Diário Oficial da
União: Brasília, 2013, seção 1, p. 33.
40. Ministério de Agricultura, Pecuária e Abastecimento (MAPA), Decreto No. 55871 de 26 de março de 1965, Determina Limites Máximos (em Partes por Milhão-ppm) de Tolerância para
Contaminantes Inorgânicos que Podem ser Encontrados nos
Alimentos; Diário Oficial da União: Brasília, 1965.
Submitted: September 30, 2016
Published online: January 24, 2017