Article
Printed in Brazil - ©2017 Sociedade Brasileira de Química 0103 - 5053 $6.00+0.00
*e-mail: [email protected]
Bioelectrooxidation of Ethanol Using NAD-Dependent Alcohol Dehydrogenase on
Oxidized Flexible Carbon Fiber Arrays
Andressa R. Pereira,a João C. P. de Souza,a,b Andressa D. Gonçalves,a
Kamila C. Pagnoncellia and Frank N. Crespilho*,a
aInstituto de Química de São Carlos, Universidade de São Paulo, 13560-970 São Carlos-SP, Brazil
bInstituto Federal Goiano, Campus Rio Verde, Rodovia Sul Goiana km 1, 75901-970 Rio Verde-GO, Brazil
Hierarchical 3-dimensional flexible carbon fiber (FCF) array is a candidate as flexible electrode for enzyme electrochemistry, with interesting properties for application in enzymatic biofuel cell and implantable biosensors. Here, we show the fabrication of oxidized FCF electrode (FCFO) based on chemical surface treatment, a wet oxidation method by using permanganate ions. Compared with pristine FCF, FCFO is rougher; the scratches become wider and deeper, with some defects in the basal planes and some cracked structures. X-ray photoelectron spectroscopy data suggests a correlation between the carbon structures and the appearance of chemical groups containing oxygen atoms. Finally, we show how the bioelectrocatalysis of ethanol by using FCFO arrays modified with NAD-dependent alcohol dehydrogenase (ADH) is positively influenced by the fibers treatment oxidation process.
Keywords: alcohol dehydrogenase, ethanol oxidation, flexible carbon fiber
Introduction
Carbon and its inorganic compounds are widely exploited in electrochemistry field as solid electrodes in the form of diamond, graphite, fullerene, carbon nanotubes, and more recently, graphene.1,2 Flexible carbon fibers (FCFs)
have a structure similar to graphite, in which there are sp2-hybridized carbon atoms in 2D layers of a stacked
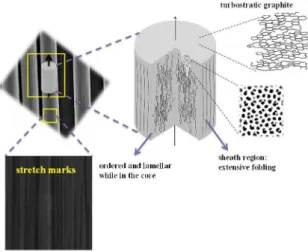
graphene-like material. The subtle difference between graphite and FCFs is in their micro and nanostructural organization, in which the carbon layers are turbostratically stacked within the FCFs, as shown in Figure 1.3 Both
types of sheets of carbon atoms are arranged in a regular hexagonal pattern. The difference is the way these carbon sheets interlock. In turbostratic FCFs, the sheets of carbon atoms are haphazardly folded, leading to a crumpled-like structure. It is, therefore, possible to produce graphene oxides from FCF by modified Hummers’ method and hence create defects in the FCF surface.4
FCFs have served as a platform for fabrication of enzyme electrodes.5,6 Modification of the surface of FCFs
can improve the bio-electrochemical performance of such bioelectrodes.7 The enzyme electrode is a miniature
chemical transducer that combining an electrochemical procedure with immobilized enzyme activity; for instance, there is glucose oxidase immobilized on a gel to measure the concentration of glucose in biological system.8 In
particular, since 2013 when FCF array was used to intravenous implantable glucose/dioxygen biofuel9, we
have successfully applied FCF arrays as flexible electrodes for high-performance glucose dehydrogenase bioanodes,7
glucose biochip based for in vivo diabetes evaluation in rats10 and enzyme biofuel cells.11,12 The combination of
carbon-based electrodes and enzymes is used to investigate enzymatic reactions, kinetics and thermodynamics.12
As NAD-dependent enzymes on electrode are concerned, the applicability of FCF is still a challenge. The electrooxidation of β-nicotinamide adenine dinucleotide (NADH) is necessary to regenerate NAD-dependent enzymes. However, at bare carbon-based electrodes, the electrochemical oxidation of NADH is irreversible and requires a high overpotential, e.g., 1.1 V (vs. saturated calomel electrode-SCE) at pH 7.0.13,14 The efficient
reversible recycling of NADH is of particular interest in the construction of dehydrogenase biosensors, biofuel cell bioanodes and fine chemicals industry.11,12,15
problem, since more than 300 dehydrogenases are known whose activities are dependent on NADH or NADPH as cofactors.16 Quinones-modified electrodes or soluble
quinone-based redox mediator have been reported to oxidize NADH, including pyrroloquinoline quinone (PQQ),17,18
9,10-phenanthraquinone19 and naphthoquinone redox
polymer (NQ-LPEI).20 Newly, NAD-dependent glucose
dehydrogenase (GDH) bioelectrodes were utilized as glucose bioanodes with laccase O2-reducing biocathodes
in a glucose/O2 biofuel cell.20
Here, we report important advances to obtain active FCF arrays for the build up of NAD-dependent dehydrogenase enzyme electrodes. The experimental setup is based on the wet oxidation treatment of FCF by using permanganate ions; the methodology is fast, reproducible and with one-pot reaction approach. The oxidized and exfoliated carbon structures on FCF electrode shows excellent conditions to immobilize alcohol dehydrogenase (ADH). Our interest in this type of enzyme consist that NAD-dependent ADH catalyzes the reversible interconversion of alcohols to aldehydes or ketones and can be utilized as anodic biocatalysts in biofuel cells. Also, biofuel cells with high electromotive forces could be constructed using these enzymes, since the formal potential (E°) of the NAD/NADH is –315 mV vs. standard hydrogen electrode (NHE) (pH 7.0, 25 °C). Based on X-ray photoelectron spectroscopy (XPS) we have strong evidences that after chemical treatment, the fibers shows defects composed by oxygenated species. We propose that FCF-oxidized array (FCFO) electrodes modified with ADH (FCFO-ADH) is very promising for NADH oxidation, consequently for application in ethanol
bioelectrooxidation. Furthermore, we emphasize here that a deeply discussion regarding the “quinone-like” behavior of the fiber surface shall be addressed in details.
Experimental
Materials
Alcohol dehydrogenase from Saccharomyces cerevisiae
and absolute ethanol were purchased from Sigma-Aldrich and used without further purification. FCF electrodes were extracted from a flexible carbon cloth (CCS200), as described in literature.4 NaH
2PO4/Na2HPO4 salts utilized
for the preparation of 0.1 mol L-1 buffer solution, sulfuric
acid and potassium permanganate were purchased from Synth. Nicotinamide adenine dinucleotide free acid was purchased from Merck.
Chemical surface treatment of carbon fibers
Chemical surface treatment was carried out by immersion of 0.5 g of FCF in a 120 mL of 1.0 mol L-1 H
2SO4
and 24.5 mol L-1 KMnO
4 (aq). This mixture was kept in an
ultrasound bath for 3 hours. The FCF was then washed with HCl (37%) once in order to remove residual MnO2, and
then cleaned with ultrapure water to remove excess acid. The treated FCF (FCFO) was dried under vacuum. The morphologies of the fibers obtained from chemical surface treatment were evaluated by field-emission scanning electron microscopy (FEG-SEM, FEI Magellan 400L).
The formation of oxygenated carbon functional groups was confirmed by XPS (UNI-SPECS UHV System). The experiments were carried out at a pressure of less than 10-7 Pa. The Mg Kα line (hν = 1253.6 eV) was used as
the X-ray source and the analyzer pass was set to 10 eV. The spectra were fitted using multiple Voigt profiles. The inelastic background of the C 1s and O 1s electron core-levels were subtracted by Shirley’s method. The binding energy scale of the spectra was corrected using the C 1s hydrocarbon component of the fixed value of 285.0 eV. The width at half maximum (FWHM) varied between 1.2 and 2.1 eV and the accuracy of the peak positions was ± 0.1 eV.
Enzyme immobilization: FCFO-ADH electrodes
Before adsorption of the enzyme, the FCFs were treated according to the process outlined above. The FCFO-ADH bioelectrodes were prepared via physical adsorption12,21
of the enzyme. The complete protocols for enzyme immobilization has been described and highlighted by our group recently.11,12 The electrodes areas (ca. 0.3 cm2) were Figure 1. Structures for a single flexible carbon fiber (FCF) from its array.
delimited with epoxy resin. In summary, FCFO was placed in an ADH solution (8 mg mL-1 in sodium phosphate buffer,
pH 7.5) for 24 hours at 4 ºC. Then, 20 µL of NafionTM (2.5%)
was dropped onto the FCFO containing the adsorbed ADH, and the bioelectrode was vacuum dried.
Bioelectrocatalysis of ethanol
All electrochemical experiments were performed in a conventional three-electrode cell, using a FCFO or modified electrodes (FCF-ADH and FCFO-ADH) as working electrode, an Ag/AgCl/Cl−
(sat) (silver, silver chloride in
saturated KCl) reference electrode and a platinum wire (0.5 cm2) as counter electrode. For this, an Autolab
PGSTAT128N Potentiostat-Galvanostat was employed. The bioelectrocatalysis experiments were carried out using cyclic voltammetry in the presence of an ethanol substrate. Cyclic voltammetry and chronoamperometry were employed and several concentrations of ethanol were also evaluated. Sodium phosphate buffer (0.1 mol L-1,
pH 7.5) was used as the electrolyte in the presence of 0.6 mmol L-1 NAD+. The electrolyte was purged with
nitrogen for at least 10 minutes prior to the measurements. Electrochemical measurements were also carried out to obtain the bioelectrooxidation of ethanol at different temperatures (from 10 to 60 ºC) and pH (from 6.0 to 9.0). The temperature of the electrolyte was varied by using a high precision thermostatic bath (GE-MultiTemp IV Thermostatic Circulator).
Results and Discussion
Surface morphology and composition of pristine FCF and FCFO
As the reaction of carbon atoms from pristine FCF with permanganate ions in solution is concerned, it is expected that the chemical oxidation of carbon surface generates significant changes, especially, in the surface atoms (composition and structure) and the morphology of the oxidized carbon. Both of these effects are present in the oxidized fibers, as discussed below.
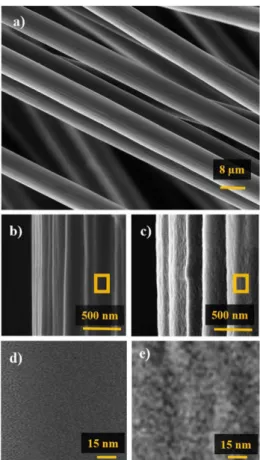
SEM image of fibers arrays electrode is shown in Figure 2a, and FEG-SEM of pristine and treated FCF single fibers are shown in Figures 2b and 2c, respectively. Compared to the pristine one, FCFO is rougher, the stretches are wider and deeper, and some defects were generated after treatment. Figure 2d shows an amplified region of the FCF that presents a smooth and homogenous surface, while Figure 2e shows details of the defects formed on the surface that exhibit grooves with an average separation
distance of 15 nm. The defects generated are related to the oxidative process, where the basal planes on the surface are cracked allowing separation of the 2D-graphite layers in the exposed edge planes. The oxidation of carbon fibers was confirmed by XPS.
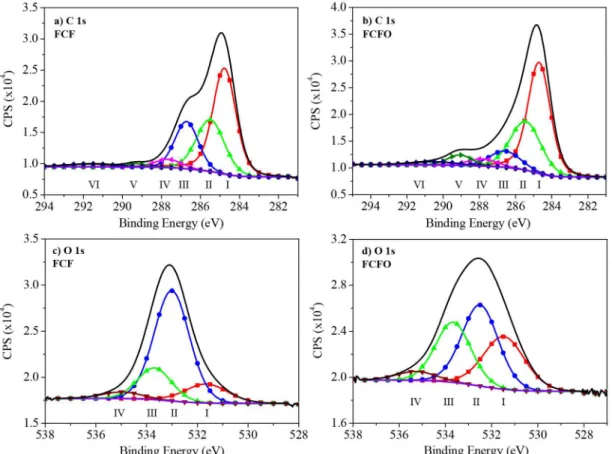
Figures 3a and 3b show the deconvoluted C 1s region of the XPS spectra of FCF and FCFO, respectively. An increase in the number of oxygenated functional groups for FCFO compared with FCF can be seen, which is related to new spectral feature arising near 289.1 eV (peak V) in Figure 3b. This peak confirms that the oxidation process occurred successfully, revealing the presence of carboxylic and ester groups (O−C=O). The two samples maintain their graphitic features, presenting a higher peak at 284.7 eV (peak I) that is related to sp2 carbon atoms. The peak at
285.5 eV is related to sp3 hybridization of carbon. The
other oxygenated functional groups are at peaks 286.7 and 287.9 eV that correspond to C–O and C=O groups, respectively. We also observe peak at 290.4 eV related to the plasmon π-π*. The deconvoluted O 1s region of the XPS spectra of FCF and FCFO are presented in Figures 3c and 3d, respectively. This data corroborate the spectra in the C 1s region, showing an increase in oxidation.
This increase in oxidation can be observed by the decrease in the intensity of the peak at 532.5 eV that corresponds to the C–O groups after treatment. The carbon atoms in C–O have a lower oxidation number when compared with C=O and O−C=O that are at peaks 531.5 and 533.7 eV in the O 1s spectra. The increase of these peaks shows that FCF was oxidized. The peak at 535.3 eV is related to adsorbed water at the FCF surface. This peak is more prominent for FCF, which shows that FCFO has higher hydrophilicity than FCF.
Carbon-oxygen bonds cause partial change of carbon atoms hybridization from sp2 to sp3. The methodology
proposed here based on permanganate ions is a modification of Hummers’ method to produce graphene oxide in suspension. Hummers’ method consists in the oxidation of graphite, introducing molecules of oxygen to the pure carbon graphene, and the oxidation reaction occurs between the graphene and the concentrated sulfuric acid with the potassium permanganate and sodium nitrate acting as catalysts.22 However, here it was not used sodium nitrate.
In addition, our methodology does not promote complete exfoliation of FCF. Our goal is just oxidize partially the surface. For this, chemical surface treatment is carried out by immersion of FCF in a H2SO4/KMnO4 solutionand the
FCF is kept in an ultrasound bath for 3 hours. Regarding contamination, there is no residual MnO2 on FCF surface, at
least not detectable by XPS. The permanganate ion oxidizes the fibers, and according to the XPS results, they mainly promote the increase of the carbonyl group, with a decrease in hydroxyl groups. So far, it is too early to affirm that there is formation of a “specific quinone”, especially those most active for oxidation of NADH (i.e., ortho-quinone). Also, permanganate ion could react with carbon-carbon double bonds to give a metal-oxide complex.23 Although
permanganate ion has been extensively used and studied as an oxidant, there is considerable controversy concerning the oxidation state of the manganese species observed during the oxidation of carbon-carbon double bond.23,24 In another
way, treatments for the purification and cutting of carbon nanotubes with potassium permanganate in either acidic or alkaline conditions allow a controllable degree of oxidation, where the quinone groups formed are intermediates towards oxidation to carboxylic acids in a further step.24,25 There are
several models of graphite oxide structures as presented in literature.26 Even though we will not use some of those
models, the following results (mainly the voltammetry profile) show that the electrooxidation of NADH on FCFO
Figure 3. Deconvoluted XPS spectra. (a) and (c) pristine FCF and (b) and (d) FCFO. (a) and (b) shows the C 1s spectrum and figures; () carbon sp2, () carbon sp3, () C–O, () C=O, () O–C=O, () plasmon π-π*, black line is the total C 1s spectra and purple line the background;
strongly suggests that quinones-like structures may be involved in the electron mediation process.
FCFO play important role on NADH oxidation
Before showing the results related to NADH oxidation on FCFO, it is important to understand the context of our finds. For the bioelectrocatalysis with ADH, NADH is oxidized with the conversion of ethanol in acetaldehyde. In this case, NAD+ is the coenzyme and it is converted to
NADH, which is electrooxidized. The NAD+ reaction and
ethanol oxidation is represented by the simplified reaction shown in equation 1.
CH3CH2OH + NAD+⇌ CH3CHO + NADH + H+ (1)
Our goal is to achieve bioelectrooxidation of ethanol, using ADH immobilized by simple physical adsorption on a FCFO electrode, and show that the bioelectrocatalysis is enhanced by FCFO electrode. Also, it is not our intentions (or avoid that) to use other co-immobilizers or redox mediators in solution. The methodology proposed here is robust, easy to handle, and it does not require the use of other complementary materials, such as carbon nanotubes, graphene, nanoparticles, etc. Thus, the FCFO-ADH is the first in this category, in which only the surface oxidation method and enzyme immobilization are required.
XPS survey revealed that the oxidation can promotes the increase of C=O groups on the FCF. As we shall discuss, the electrochemistry of NADH oxidation on FCFO is quite similar to NADH oxidation on quinones-modified electrodes. It appears consensus that the modification of the electrode surfaces with quinones can improve the NADH electrooxidation,27,28 thus enhancing the
bioelectrocatalysis based on NAD-dependent enzymes.28,29
Figure 4 shows the cyclic voltammetry of FCF (Figure 4a) and FCFO (Figure 4b) in 0.001 mol L-1 NADH, where it
can be observed the oxidation of NADH on both electrodes. For FCF, it is observed 0.600 V for the onset potential, while this parameter corresponds to 0.090 V for FCFO. The current related to oxidation of NADH is 8 times higher for FCFO when compared with FCF (i.e., at 0.600 V), as observed in Figure 4c. It is clear that the presence of oxides on FCFO surface affects drastically the NADH oxidation. It is important to note that the voltammogram profile and shape is very similar for the oxidation of NADH in presence of quinones-modified surfaces.29 Different mechanisms
have been proposed for NADH oxidation in the presence of redox mediator, and as bioelectrocatalysis is concerned, redox mediators have been coupled with NAD-dependent enzymes. Several authors have exposed different scenarios
involving the mediated electron transfer, but it seems to be a consensus that the chemical nature of these can lead to different paths.15 For instance, the common classifications
can be related to an intermolecular complex between NADH and mediator (dyes),30,31 a net hydride transfer
(quinones)28,32,33 and two one-electron steps with a proton
transfer to the solvent (polyoxometallates).34,35
Cyclic voltammetry and bioelectrocatalysis of ethanol
Now, we show the bioelectrochemistry of ADH immobilized on FCFO electrode. It is important highlight that ADH is a redox enzyme that catalyzes the oxidation of primary and secondary alcohols to aldehydes and ketones, respectively.36 For instance, this enzymatic reaction can be
utilized for determination of ethanol in alcoholic beverages and food, and has applications in forensic science and toxicology.37,38 ADH is found in many microorganisms,
such as in yeast and the liver of animals. ADH has a high specificity for ethanol and is very stable when isolated from the yeast, Saccharomyces cerevisiae, which was first purified and crystallized by Negelein and Wulff39 in Figure 4. Cyclic voltammograms of (a) FCF and (b) FCFO, both in absence of NADH (black line) and in presence of 0.001 mol L-1 of
NADH (red line); (c) FCF (black line) and FCFO (red line) in presence of 0.001 mol L-1 of NADH in N
2-saturated 0.10 mol L-1 sodium phosphate
buffer (pH 7.5), scan rate: 5 mV s-1, temperature: 25 ºC; (d) zoomed region
1937. The molecular weight of ADH is 150 kDa. It has a tetrameric structure with one NAD+ (nicotinamide adenine
dinucleotide) as coenzyme and Zn2+ atom as cofactor in
each subunit of the enzyme.40 Each of these components is
important for the mechanism of enzymatic catalysis. The features described above make ADH a good enzyme for use in bioanodes of biofuel cells.36,38
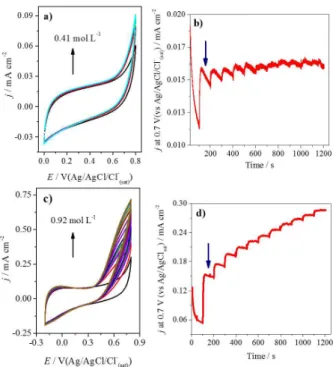
Figure 5 shows the electrochemistry of FCF-ADH (Figures 5a and 5b) and FCFO-ADH (Figures 5c and 5d). Black line corresponds to cyclic voltammograms in absence of ethanol. Subsequent cyclic voltammograms were obtained in presence of ethanol up to 0.41 mol L-1
for FCF-ADH and 0.92 mol L-1 for FCFO-ADH. The
onset potential for ethanol oxidation is 0.630 V for FCF-ADH and 0.250 V for FCFO-ADH. For FCFO-ADH, the substrate saturation is achieved in presence of higher ethanol concentration than for FCF-ADH. In order to verify the influence of NAD+, cyclic voltammograms were
recorded using FCFO-ADH in the absence of NAD+. A
catalytic current from ethanol oxidation was not observed (data not shown). A faradaic current from NAD+ on the
FCFO electrode in the presence of 0.6 mmol L-1 NAD+
and 0.49 mol L-1 of ethanol (without ADH), was also not
observed, indicating that the ethanol oxidation, in the present potential range, occurs just in the presence of ADH.
Thus, as expected, NAD+ and FCFO-ADH is required for
ethanol oxidation.
It has not escaped our notice that the equation 1 refers to global reaction of ethanol oxidation catalyzed by ADH. However, approaches more sophisticated related to the kinetic mechanism of ADH have been described in several studies.41-47 As reactions pathways are concerned, enzyme
follows the steady-state random mechanism on the alcohol side, and a steady-state ordered mechanism on the aldehyde side of the catalytic cycle. For the ethanol oxidation, ADH typically operates by a random bi-bi mechanism with a preferred order of addition of reactants on the alcohol side of the reaction, and with the dissociation of coenzyme in the reaction. The steps involved in this mechanism are illustrated in Figure 6. The alcohol-NAD+ reactions indicate
that some dissociations of coenzyme by active ternary complex enzyme-NAD+-alcohol should occur. Thus,
coenzyme probably first binds to the enzyme (ADH-NAD+),
with subsequent substrate binding (ADH-ethanol), thereby forming a ternary complex (ADH-NAD+-ethanol). In the
structure of ADH, the adenosine binding site is easily available to the solution, while the substrate binding site situated next to the zinc atom and inside the enzyme structure is quite narrow and almost inaccessible to the solution. After an intramolecular reaction, with the formation of acetaldehyde molecules and NADH species, the ADH-acetaldehyde-NADH complex is formed. The
Figure 5. (a) Cyclic voltammograms of pristine FCF-ADH and (b) amperometric response in the presence of several ethanol concentrations by using the same electrode; (c) cyclic voltammograms of FCFO-ADH and (d) amperometric response for increasing ethanol concentration for FCFO-ADH. All measurements were carried out in N2-saturated,
0.1 mol L-1 sodium phosphate buffer (pH 7.5) containing 0.6 mmol L-1
NAD+ at 25 ºC. For cyclic voltammograms: scan rate: 50 mVs-1, and
for chronoamperometry: applied potential: 0.7 V (vs. Ag/AgCl/Cl− (sat)).
Figure 6. Mechanism for ADH enzyme. This is an illustrated rereading of the mechanism proposed pioneering by Dickenson and Dickinson,42
where the authors carried out the kinetics of ethanol oxidation by NAD+,
and acetaldehyde and butyraldehyde reduction by NADH. If NADH dissociation from ADH-NADH complex is the limiting step (k7), it can
rate-limiting step of ethanol oxidation at neutral pH, is not the chemical reactions (k9), but the dissociation of NADH
from the ADH-NADH complex (k7). Likewise, NAD+
coenzyme is released much faster from the ADH-NAD+
complex (k2) than NADH dissociates from the ADH-NADH
complex (ADH-NADH ⇌ ADH + NADH).45,47 Eys et al.48
report that the regeneration of enzyme-NADH complex is accompanied by a direct competition between NADH and NAD+ to the active site of enzyme.
In terms of kinetic analysis, the NAD+ coenzyme is
treated as a co-substrate. The binding energies for the step between NAD+ and the free enzyme (ADH + NAD+
ADH-NAD+) can be calculated from the equilibrium
constant k1/k2. In the case of NADH dissociation, the binding
energies for NADH can be calculated from the equilibrium constant k8/k7 (Figure 6). Finally, the ratios of rate constants
k1/k2 and k8/k7 may be identified with the equilibrium
association constant for the binding of NAD+ or NADH
to the free enzyme, respectively.49 Therefore, once that the
step of NADH dissociation from ADH-NADH complex is the limiting step, the oxidation of NADH released from this reaction could be used to calculate kinetic parameters. To confirm the better performance of FCFO-ADH, Figures 5b and 5d shows current-time transient at 0.700 V during 1200 s with FCF-ADH (Figure 5b) and FCFO-ADH (Figure 5d), both in the presence of several concentrations of ethanol. The applied potential was chosen because it is the value at which the current reaches a quasi-steady state for the oxidation of ethanol. As observed in Figure 5, the increase in the current when the ethanol concentration increases is higher for FCFO-ADH. Each ethanol addition (blue arrow) corresponds to 200 µL of ethanol 50% (v/v). The apparent Michaelis-Menten constant (KMapp), which
gives an indication of the enzyme-substrate kinetics, can be obtained using equation 2, the electrochemical version of the Lineweaver-Burk equation.50,51
(2)
where ISS is the steady-state current after the addition
of substrate, Imax is the maximum current measured
under saturated substrate conditions, and c is the bulk concentration of substrate. KMapp was found to be
0.26 mmol L-1 for FCFO-ADH and 28.9 mmol L-1 for
FCF-ADH. In a first approximation, this result suggests that for FCFO-ADH the enzyme is highly active. If we consider the general concept of Michaelis-Menten kinetics, ADH have varying tendencies to bind their ethanol substrate (affinities), thus the ADH’s KM describes the substrate
concentration at which half of the active sites of the
enzyme are occupied by ethanol. Examples of other values reported in the literature are 0.91 mmol L-1 for a glassy
carbon electrode modified with toluidine blue diazonium salt,51 0.38 mmol L-1 for multiwalled carbon
nanotube-chitosan-alcohol dehydrogenase nano-biocomposite,52
and 4.95 mmol L-1 for colloidal gold-carbon
nanotube-composite electrode.53 Note that all of these systems used
some kind of the material at electrode/enzyme interface, either nanotubes, redox mediators, or something else. These facts reinforce the importance of our results obtained with FCFO-ADH.
Effect of pH and temperature on the bioelectroactivity
With high stability and bioelectroactivity, FCFO-ADH is a very promising candidate for use in cyclic voltammetry experiments and it can be used to determine thermodynamics and kinetics properties of ADH, for instance optimum temperature and optimum pH. Our goals from here are to show the application capability of FCFO electrode for this purpose.
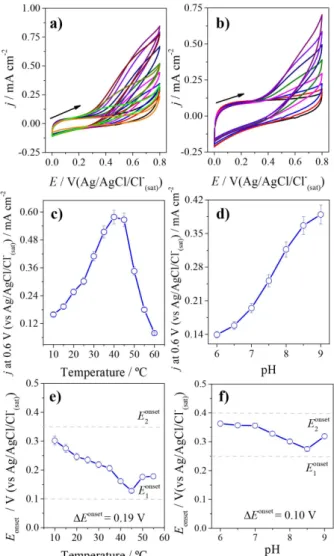
The temperature dependence of ethanol oxidation was investigated, as shown in Figures 7a, 7c and 7e. The temperature stability of ADH on FCFO was determined by observing the remaining oxidative activity for ethanol after a 10 min incubation period at temperatures between 10 and 60 ºC. The oxidation current for ethanol using the FCFO-ADH electrode increases the catalytic current density from 10 to 40 ºC. The current density is 4-times higher at 40 ºC (0.58 ±0.03 mA cm-2) than it is at 10 ºC (Figure 7c).
At a very first analysis, this increase in the catalytic current density can be caused by the enhanced activity of the enzyme and the increased ethanol reaction rate at higher temperatures. Above 40 ºC, however, the catalytic current density decreases in a quasi-linear profile. At 60 ºC, the current density is 7-times lower (0.079 ±0.004 mA cm-2)
than it is at 40 ºC. In addition, it was analyzed the variation of the onset potential with the temperature (Figure 7e), once for bioanodes is interesting the lower onset potential as possible, and the lowest onset potential was obtained at 45 ºC. These results are in agreement with data reported in the literature for homogeneous catalysis using ADH.54,55
However, as bioelectrocatalysis is concerned, it is the first time that the optimum temperature at 40 ºC is obtained for ADH in a non-mediated electrode reaction.
cyclic voltammograms were recorded at 50 mV s-1. In the
case of ADH, it is sensitive to pH variation because the H+ on the enzyme environment affects binding between
enzyme and its substrate, catalytic activity of the enzyme, and mainly the protein structure.56 Furthermore, this
dependence with the pH may have a contribution of the NADH oxidation on FCFO, once we have observed that the electrochemical process is pH dependent (not shown). The catalysis of ethanol oxidation by ADH occurs with the reduction of NAD+ and ADH transfers one proton and two
electrons57 from ethanol to NAD+, utilizing Zn2+ and NAD+
coenzymes. As illustrated in Figure 8, Zn2+ is maintained by
three amino acids (two cysteine and one histidine), which stabilizes enzyme structure allowing proton transference in this reaction.
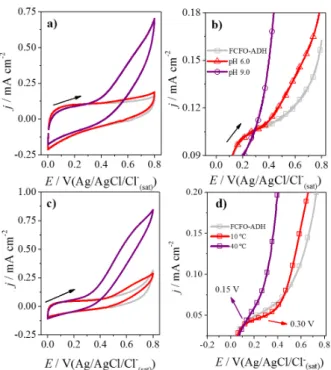
If we observe the voltammograms in extreme values carefully, we will begin to notice differences that are more evident. Thus, the effects of pH and temperature highlighting the extreme values (pH 6.0 and 9.0 and temperatures 10 and 40 ºC) have been considered, as shown in Figure 9.
Figure 9a shows the cyclic voltammograms of FCFO-ADH in presence of 0.6 mmol L-1 NAD+ (grey line) and 0.25 mol L-1
ethanol at pH 6.0 (red line) and pH 9.0 (purple line), while Figure 9b evidence the region of the onset potential. We observed a subtle difference in the onset potential when the pH was altered (∆Eonset = 0.100 ±0.007 V), while the
current densities increase a lot in the same range. On the other side, for temperature dependence (Figures 9c and 9d), a decrease in the onset potential is observed when the temperature increases (∆Eonset = 0.180 ±0.006 V); this is
accompanied by a corresponding decrease in the current density.
Thus, we show that it is possible to evaluate both the effect of temperature and the pH on the electrochemistry of ADH. We do not show here any modeling or molecular interpretation of these effects, because our intention is to evaluate the properties of FCFO front ADH immobilization. However, the results herein open new possibilities to use protein film voltammetry for future studies of enzyme kinetics to elucidate mechanism of catalysis or inhibition, for instance. In this case, steady-state polarization could be applied successfully. Our research group has
Figure 7. (a) Cyclic voltammograms of the FCFO-ADH bioelectrode in N2-saturated 0.1 mol L-1 sodium phosphate buffer (pH 7.5) containing
0.6 mmol L-1 NAD+ without ethanol (black line) and with 0.25 mol L-1
of ethanol at different temperatures. Scan rate: 50 mVs-1; (b) cyclic
voltammograms of the FCFO-ADH bioelectrode in N2-saturated
0.1 mol L-1 sodium phosphate buffer containing 0.6 mmol L-1 NAD+
without ethanol (black line) and with 0.25 mol L-1 of ethanol at different
pH. Scan rate: 50 mVs-1; (c) plot of temperature versus current density of
ethanol oxidation at 0.6 V vs. Ag/AgCl/Cl−
(sat); (d) plot of pH versus current
density of ethanol oxidation at 0.6 V vs. Ag/AgCl/Cl−
(sat); (e) plot of
temperature versus onset potential of ethanol oxidation; (f) plot of pH versus onset potential of ethanol oxidation.
Figure 8. Schematic illustration for ethanol oxidation on FCFO-ADH electrode. ADH is a homotetramer of subunits with 347 amino acid residues (PDB 4W6Z). The catalysis of ethanol oxidation by ADH occurs with the reduction of NAD+. ADH transfers one proton and two electrons
from ethanol to NAD+, utilizing Zn2+ and NAD+ coenzymes present in its
structure. Zn2+ is maintained by three amino acids, two cysteine and one
conducted some experiments of this nature (not shown) and encouraging results are being observed. Thus, here there is a proof of concept that the FCFO-ADH electrode can be used for fundamental studies of enzyme kinetics.
Conclusions
We investigated the application of wet chemical treatment to prepare oxidized flexible carbon fibers, named here as FCFO. From XPS data, it was found clear evidence that the permanganate ions used in the treatment method promoted an increase in carbonyl group on fiber surface. Probably, the presence of C=O species is responsible to enhance the electrooxidation of NADH. We believe that the presence of quinones cannot be ruled out, although additional experiments design for this purpose should be carried out. When FCFO-ADH was applied as a bioelectrode, ethanol could be oxidized at 0.250 V (vs. Ag/AgCl/Cl−
(sat)). FCFO-ADH showed high stability
and bioelectroactivity, which enabled this bioelectrode to be used in cyclic voltammetry experiments. Therefore, the bioelectrooxidation of ethanol by ADH in the presence of
NAD+ and in different conditions of pH and temperature
accredits it as a prospective bioelectrode to develop enzyme biofuel cells.
Acknowledgments
The authors gratefully acknowledge the financial support provided by FAPESP (F. N. Crespilho, project No.: 2015/16672-3 and 2013/14262-7), CNPq (F. N. Crespilho, project No. 478525/2013-3), National Institute of Science and Technology in Organic Electronics (INCT-INEO, Brazil), and Nanomedicine Network (NanoBioMed-Brazil, CAPES). The authors thank Prof Peter Hammer (LEFE) and LCE-DEMa for XPS and FEG-SEM facilities, respectively. A. R. Pereira a c k n ow l e d g e s FA P E S P ( D o c t o r a l F e l l ow s h i p No. 2013/19908-2) for support.
References
1. Mc Creery, R. L.; Chem. Rev. 2008, 108, 2646.
2. Brownson, D. A. C.; Kampouris, D. K.; Banks, C. E.; Chem. Soc. Rev. 2012, 41, 6944.
3. Frank, E.; Hermanutz, F.; Buchmeiser, M. R.; Macromol. Mater. Eng.2012, 297, 493.
4. Martins, M. V. A.; Pereira, A. R.; Luz, R. A. S.; Iost, R. M.; Crespilho, F. N.; Phys. Chem. Chem. Phys. 2014, 16, 17426. 5. Chen, T.; Barton, S. C.; Binyamin, G.; Gao, Z. Q.; Zhang, Y.
C.; Kim, H. H.; Heller, A.; J. Am. Chem. Soc. 2001, 123, 8630. 6. Koushanpour, A.; Guz, N.; Gamella, M.; Katz, E.; ECS J. Solid
State Sci. Technol. 2016, 5, M3037.
7. de Souza, J. C. P.; Iost, R. M.; Crespilho, F. N.; Biosens. Bioelectron. 2015, 77, 860.
8. Updike, S. J.; Hicks, G. P.; Nature 1967, 214, 986.
9. Sales, F. C. P. F.; Iost, R. M.; Martins, M. V. A.; Almeida, M. C.; Crespilho, F. N.; Lab Chip 2013, 13, 468.
10. Iost, R. M.; Sales, F. C. P. F.; Martins, M. V. A.; Almeida, M. C.; Crespilho, F. N.; ChemElectroChem 2015, 2, 518. 11. Pereira, A. R.; de Souza, J. C. P.; Iost, R. M.; Sales, F. C. P. F.;
Crespilho, F. N.; J. Electroanal. Chem. 2016, 780, 396. 12. Luz, R. A. S.; Pereira, A. R.; de Souza, J. C. P.; Sales, F. C. P.
F.; Crespilho, F. N.; ChemElectroChem 2014, 1, 1751. 13. Elving, P. J.; Schmakel, C. O.; Santhanam, K. S. V.; Zuman, P.;
Crit. Rev. Anal. Chem. 1976, 6, 1.
14. Moiroux, J.; Elving, P. J.; Anal. Chem. 1978, 50, 1056. 15. Popescu, I. C.; Dominguez, E.; Narvaez, A.; Pavlov, V.; Katakis,
I.; J. Electroanal. Chem. 1999,464, 208.
16. Zare, H. R.; Golabi, S. M.; J. Electroanal. Chem. 1999,464, 14.
17. Gorton, L.; Dominguez, E.; Rev. Mol. Biotechnol. 2002,82, 371.
Figure 9. (a) Cyclic voltammograms of the FCFO-ADH bioelectrode in N2-saturated 0.1 mol L-1 sodium phosphate buffer containing 0.6 mmol L-1
NAD+ without ethanol (grey line) and with 0.25 mol L-1 of ethanol at
pH 6.0 (red line) and pH 9.0 (purple line); (b) cyclic voltammograms of the FCFO-ADH bioelectrode in N2-saturated 0.1 mol L-1 sodium
phosphate buffer (pH 7.5) containing 0.6 mmol L-1 NAD+ without ethanol
(grey line) and with 0.25 mol L-1 of ethanol at 10 (red line) and 40 ºC
(purple line), scan rate: 50 mVs-1; (c) plot of temperature versus current
density of ethanol oxidation at 0.6 V vs. Ag/AgCl/Cl−
(sat); (d) plot of
pH versus current density of ethanol oxidation at 0.6 V vs. Ag/AgCl/Cl− (sat);
18. Katz, E.; Lotzbeyer, T.; Schlereth, D. D.; Schuhmann, W.; Schmidt, H. L.; J. Electroanal. Chem. 1994, 373, 189. 19. Reuillard, B.; le Goff, A.; Cosnier, S.; Anal. Chem. 2014, 86,
4409.
20. Abdellaoui, S.; Milton, R. D.; Quah, T.; Minteer, S. D.; Chem. Commun. 2016,52, 1147.
21. Iost, R. M.; Crespilho, F. N.; Biosens. Bioelectron. 2012, 31, 1. 22. Hummers, W. S.; Offeman, R. E.; J. Am. Chem. Soc. 1958, 80,
1339.
23. Freeman, F.; Kappos, J. C.; J. Am. Chem. Soc. 1985, 107, 6628. 24. Dash, S.; Patel, S.; Mishra, B. K.; Tetrahedron 2009, 65, 707. 25. Zhang, J.; Zou, H.; Qing, Q.; Yang, Y.; Li, Q.; Liu, Z.; Guo, X.;
Du, Z.; J. Phys. Chem. B 2003, 107, 3712.
26. Szabo, T.; Berkesi, O.; Forgó, P.; Josepovits, K.; Sanakis, Y.; Petridis, D.; Dekany, I.; Chem. Mater. 2006,18, 2740. 27. Tse, D. C. S.; Kuwana, T.; Anal. Chem. 1978, 50, 1315. 28. Carlson, B. W.; Miller, L. L.; J. Am. Chem. Soc. 1985, 107, 479. 29. Jaegfeldt, H.; Torstensson, A. B. C.; Gorton, L. G. O.;
Johansson, G.; Anal. Chem. 1981, 53, 1979.
30. Persson, B.; Gorton, L.; J. Electroanal. Chem. 1990,292, 115. 31. Gorton, L.; Johansson, G.; Torstensson, A.; J. Electroanal.
Chem. 1985, 196, 81.
32. Fukuzumi, S.; Nishizawa, N.; Tanaka, T.; J. Org. Chem. 1984, 49, 3571.
33. Jaegfeldt, H.; Kuwana, T.; Johansson, G.; J. Am. Chem. Soc.
1983, 105, 1805.
34. Keita, B.; Essaadi, K.; Nadjo, L.; Desmadril, M.; Chem. Phys. Lett. 1995,237, 411.
35. Essaadi, K.; Nadjo, K. L.; J. Electroanal. Chem. 1994, 367, 275.
36. Kontani, A.; Masuda, M.; Matsumura, H.; Nakamura, N.; Yohda, M.; Ohno, H.; Electroanalysis 2014, 26, 682.
37. Cai, C. X.; Xue, K. H.; Zhou, Y. M.; Yang, H.; Talanta 1997, 44, 339.
38. Akyilmaz, E.; Dinckaya, E.; Talanta 2003, 61, 113.
39. Negelein, E.; Wulff, H.-J.; Biochem. Z. 1937,293, 351. 40. Presecki, A. V.; Vasic-Racki, D.; Process Biochem. 2005, 40,
2781.
41. Dickinson, F. M.; Monger, G. P.; Biochem. J. 1973, 131, 261. 42. Dickenson, C. J.; Dikinson, F. M.; Biochem. J. 1975, 147, 303. 43. Klinman, J. P.; Crit. Rev. Biochem. Mol. Biol. 1981, 10, 39. 44. Ganzhorn, A. J.; Green, D. W.; Hershey, A. D.; Gould, R. M.;
Plapp, B. V.; J. Biol. Chem. 1987, 262, 3754.
45. Trivic, S.; Leskovac, V.; J. Serb. Chem. Soc. 2000,65, 207. 46. Abuin, E.; Lissi, E.; Leon, L.; Protein J. 2008, 27, 247. 47. Forti, J. C.; Neto, S. A.; Zucolotto, V.; Ciancaglini, P.; de
Andrade, A. R.; Biosens. Bioelectron. 2011, 26, 2675. 48. Eys, J. V.; Ciotti, M. M.; Kaplan, N. O.; J. Biol. Chem. 1958,
231, 571.
49. Leskovac, V.; Trivic, S.; Pericin, D.; Popovic, M.; Kandrac, J.; J. Serb. Chem. Soc. 2010,75, 185.
50. Cass, A. E. G.; Biosensors: A Practical Approach; IRL Press: Oxford, 1990.
51. Nasri, Z.; Shams, E.; Ahmadi, M.; Electroanalysis 2013,25, 1917.
52. Lee, C. A.; Tsai, Y. C.; Sens. Actuators, B 2009, 138, 518. 53. Manso, J.; Mena, M. L.; Yáñez-Sedeño, P.; Pingarrón, J. M.;
Electrochim. Acta 2008,53, 4007.
54. Zanon, J. P.; Peres, M. F. S.; Gattas, E. A. L.; Enzyme Microb. Technol. 2007,40, 466.
55. Neto, S. A.; Forti, J. C.; Zucolotto, V.; Ciancaglini, P.; de Andrade, A. R.; Process Biochem. 2011,46, 2347.
56. Nelson, D. L.; Cox, M. M.; Principles of Biochemistry, 4th ed.;
Freeman and Co.: New York, 2005.
57. Cooney, M. J.; Svoboda, V.; Lau, C.; Martin, G.; Minteer, S. D.; Energy Environ. Sci. 2008,1, 320.
Submitted: November 26, 2016