Nota Técnica
*e-mail: [email protected]
DEVELOPMENT OF A SIMPLE UV-SPECTROPHOTOMETRIC METHOD FOR THE DETERMINATION OF LANSOPRAZOLE AND STUDY OF ITS DEGRADATION PROFILE
Zenita Devi Okram, Basavaiah Kanakapura*, Ramesh Pavagada Jagannathamurthy and Vinay Kanakapura Basavaiah Department of Chemistry, University of Mysore, Manasagangotri, Mysore-570006, India
Recebido em 23/2/11; aceito em 12/7/11; publicado na web em 19/8/11
A UV-spectrophotometric method is described for the determination of lansoprazole (LAN). The method is based on the measurement of the absorbance of LAN solution in acetonitrile at 281 nm. The system obeyed Beer’s law over the concentration range of 1.25-25.0 µg/mL. The degradation behavior of LAN was investigated under dry heat treatment, UV-degradation, acid hydrolysis, alkali hydrolysis and oxidation; and found to degrade extensively under acid hydrolysis, alkali hydrolysis and oxidation. The method was applied to the determination of LAN in capsule and the results were statistically compared with those of the reference method by applying Student’s t-test and F-test.
Keywords: lansoprazole; UV-spectrophotometric determination; degradation study.
INTRODUCTION
Lansoprazole, chemically known as 2-([3-methyl-4-(2,2,2-trifluo-roethoxy)pyridin-2-yl]methylsulfinyl)-1H-benzimidazole, is a strong anti-secretory agent that acts on gastric H+/K+ ATPase of parietal cells.
It is used to treat ulcers, gastroesophageal reflux disease and peptic ulcer caused by stress, non-steroidal inflammatory disease. In addition to its acid-suppressing effects, LAN has been shown to modulate the inflammatory status, oxidative stress and ameliorate mucosal injuries in the esophagus,1-3 intestine4,5 and lungs.6 Very recently, Yuji et al.,7
also demonstrated that LAN can induce several genes, including phase II detoxifying enzyme. LAN is a weak base and breaks down rapidly in an acidic medium and thus must be administrated in the form of enteric-coated granules in capsules, to prevent gastric decomposition and improve their systematic bioavailability.8,9 This drug is official in
the United States Pharmacopoeia10 and the British Pharmacopoeia.11
USP describes a high performance liquid chromatographic method and BP recommends potentiometric titration.
Different analytical methods have been reported in the literature for the assay of LAN in pharmaceuticals and include many techniques as high pressure liquid chromatography,12-18 high pressure thin layer
chromatography,19,20 capillary electrophoresis,21,22 polarography,23-26
voltammetry,24,27 visible spectrophotometry,28-35 kinetic
spectropho-tometry,36,37 flow-injection analysis with UV-detection38 and
UV-spectrophotometry.39-41
For the stability indicating and degradation study of LAN, different techniques such as anodic oxidation at dropping mercury electrode,26 differential pulse polarograhy at the static mercury drop
electrode,42 direct current polarography at dropping mercury
electro-de,43 NMR spectroscopy and TLC,44 RP-HPLC,14 LC/MS with reverse
phase chromatography45 have been reported. Most of the reported
me-thods involving stability and degradation study of LAN are deficient in simplicity, time consuming, use multi or expensive reagents, cum-bersome, require an expertise operational personal and require strict pH control. The methods based on voltammetry and polarography requires rigid pH control. The reliability and precision of the results by polarography depend on the capillary characteristics which are often not reproducible. On the other hand, UV-spectrophotometry is still the technique of choice since it is simple, sensitive, economical,
rapid and more easily manageable. Literature survey revealed that no stability indicating UV-spectrophotometric method has ever been reported for the quantification of LAN.
The present investigation reports the development and validation of a UV spectrophotometric method for quantification of LAN in capsule and study of its degradation profile. Stress testing of LAN was carried out according to International Conference on Harmonization (ICH) guidelines46 entitled ‘stability testing of new drug substances
and products’ and investigates the degradation studies in thermal degradation, UV degradation, acid hydrolysis, alkali hydrolysis and oxidation. The proposed method was demonstrated to be simple, selective and cost-effective compared to many reported methods.
EXPERIMENTAL Instrument
The spectrophotometric measurements were carried out using Shimadzu Pharmaspec 1700 UV/Visible spectrophotometer.
Sample
Pharmaceutical grade lansoprazole (LAN) was received from Cipla Ltd, Bangalore, India. Two brands of capsules namely Lan-15 (Intas Pharmaceuticals, Dehradun, India) and Lanzol-15 (Cipla Ltd, Sikkim, India) were purchased from local commercial sources.
Reagents and chemicals
All reagents and chemicals used were of analytical reagent grade whereas acetonitrile was of HPLC grade. Doubly-distilled water was used to prepare solutions wherever required. Aqueous solutions of 5 M hydrochloric acid, 5 M sodium hydroxide (Merck, Mumbai, India) and 5% H2O2 (Loba Chemie Pvt. Ltd., Mumbai, India; 30%
w/v) were prepared in the usual way.
Standard drug solution
Materials and reagents used in reference method
Apparatus
An Elico 120 digital pH meter provided with a combined glass-SCE electrode system (Equip-Tronics, Mumbai, India) was used for potentiometric titration.
Preparation of glass-saturated calomel electrode
The saturated calomel electrode was filled with aqueous potas-sium chloride solution.
Sodium hydroxide (0.1 M)
The solution was prepared by dissolving calculated quantity of NaOH (Merck, Mumbai, India) in water.
Procedures
Construction of calibration curve
Aliquots of 0.25, 0.5, 1.0, 2.0, 3.0, 4.0 and 5.0 mL of 50 µg/mL LAN standard solution were accurately transferred into a series of 10 mL calibrated flask and made up to the mark with the same solvent. The absorbance of the resulting solution was measured at 281 nm against acetonitrile blank.
Calibration curve was prepared by plotting the absorbance versus concentration of drug. The concentration of the unknown was read from the calibration curve or computed from the regression equation derived using the Beer’s law data.
Procedure for capsules
The contents of 20 capsules were mixed well and pulverized. A weighed quantity of the powder equivalent to 10 mg of LAN was transferred into a 50 mL calibrated flask and 30 mL of acetonitrile was added to the flask and the content was shaken thoroughly for 15-20 min to extract the drug into the liquid phase; the volume was finally diluted to the mark with the same solvent, mixed well and filtered using a Whatman No. 42 filter paper. An aliquot of the filtrate (200 µg/mL in LAN) was diluted to get 50 µg/mL LAN and analysed for LAN following the procedure described above.
Procedure for placebo blank analysis
Placebo blank is a mixture of normally added excipients in formulations. Based on the amount of excipients present in a LAN capsule, a placebo blank of the composition: talc (10 mg), starch (5 mg), acacia (5 mg), methyl cellulose (10 mg), sodium citrate (5 mg), magnesium stearate (10 mg) and sodium alginate (5 mg) was made and its solution was prepared as described under “Procedure for capsules”, and then analysed using the procedure described under “Construction of calibration curve”.
Procedure for the determination of LAN in synthetic mixture To the placebo blank of the composition described above, 10 mg of LAN was added and homogenized, transferred to a 50 mL calibrated flask and the solution was prepared as described under “Procedure for capsules”, and then subjected to analysis by the procedure described under “Construction of calibration curve”. This analysis was performed to study the interference by excipients such as talc, starch, acacia, methyl cellulose, sodium citrate, magnesium stearate and sodium alginate.
Procedure for reference method
Three hundred mg of LAN was accurately weighed and dissolved in 40 mL of ethanol, and diluted to 50 mL with water. The resulting
solution was titrated with 0.1 M sodium hydroxide using glass-saturated calomel electrode. Near the equivalence point, the titrant was added in 0.05 mL increments and after each addition of titrant, the solution was stirred for 30 s and the steady potential was recorded. The titration was continued until there was no significant change in the potential on further addition of the titrant. A blank determination was performed to make necessary correction.
Conduct of stress studies
The stress studies were carried out under the conditions of dry heat, UV-degradation, hydrolysis and oxidation.45 For dry heat
stress testing, solid drug was kept in Petri dish in an oven at 105 °C for 4 h and after cooling to room temperature, 5 mg of LAN was weighed and transferred to a 100 mL calibrated flask, dissolved in acetonitrile and diluted up to the mark with the same solvent. The absorption spectrum was recorded from 240-350 nm. The UV degradation study was carried out by exposing the stock solution of LAN (50 µg/mL) to UV radiation in a UV chamber for 12000 lux h. The same solution was diluted to obtain 10 µg/mL LAN and the absorption spectrum was recorded. For acid, alkali and oxidative degradation studies, 2 mL of 50 µg/mL LAN was taken separately in three 10 mL calibrated flasks and mixed with 5 mL of 5M HCl (acid hydrolysis) or 5M NaOH (alkaline hydrolysis) or 5% H2O2
(oxidative degradation) and kept on hot water bath set at 80 °C for 2 h. Then, the solution was cooled to room temperature and diluted to the mark with acetonitrile and the absorption spectra of the resulting solutions were recorded. The absorbance values obtained in stress studies were compared with the data obtained in calibration curve i.e. in the absence of forced degradation.
RESULTS AND DISCUSSION Spectral characteristics
The absorption spectrum of 10 µg/mL LAN solution in aceto-nitrile was recorded between 240-400 nm and showed an absorp-tion maximum at 281 nm, and at this wavelength acetonitrile had insignificant absorbance. Therefore, 281 nm was used as analytical wavelength (λ
max). Figure 1 represents the absorption spectra of LAN
in acetonitrile along with acetonitrile blank.
Forced degradation of LAN
Forced degradation studies provide an indication of the stability-indicating property of the drug. The study was carried out after sub-jecting LAN to dry heat treatment, UV-degradation, acid and alkali
hydrolysis; and oxidation. The UV spectra of stress LAN samples which were subjected to dry heat treatment and UV-degradation (Figures 2a and 2b) were similar to that of the standard LAN sample (Figure 1) and it showed that LAN did not undergo degradation under these conditions.
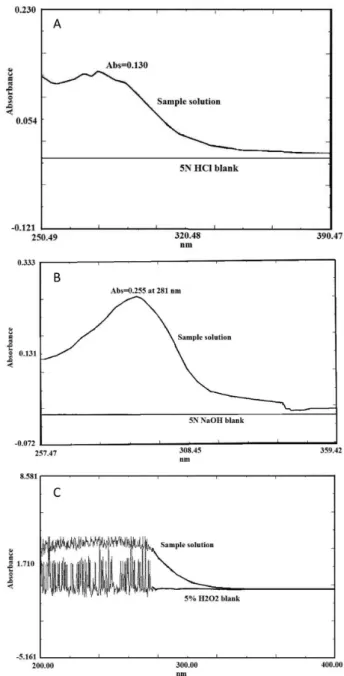
LAN subjected to acid and alkali hydrolysis showed degradation, since the absorbance values obtained under these stressed conditions (Figures 3a and 3b) were smaller than the original value of standard LAN sample (Figure 1). As shown in Figures 3a and 3b, the degrada-tion of LAN is much lesser under basic environment in comparison to acidic condition. The degradation in acid hydrolysis depends mainly on protonation of the imidazole nitrogen because of the high basicity of benzimidazole nitrogen in LAN which has no electron withdrawing group in benzimidazole ring.43
Based on the previous report,43,45 the reaction mechanism on
the formation of degradation product in acidic condition is shown in Figure 4. The absorption spectrum (Figure 3c) obtained under oxidation condition with H2O2 shows complete degradation of LAN.
In an oxidizing environment, the sulfone is produced but it rapidly degrades to the des-sulfur lansoprazole and the mechanism is shown in Figure 5 which was proposed by previous workers.45
Method validation
The proposed method was validated for linearity, sensitivity, precision, accuracy, robustness, ruggedness, selectivity, interference and recovery.
Linearity and sensitivity
Linear correlation was obtained between the absorbance and
Figure 2. Degradation study of LAN solution treated with a. dry heat at 105
oC for 4 h and b. UV radiation for 12000 lux h
Figure 3. Degradation study of LAN solution treated with a. HCl, b. NaOH
and c. H2O2
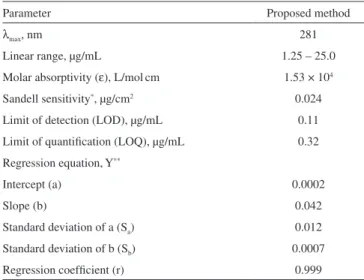
concentration of LAN in the range of 1.25-25.0 µg/mL. Correlation coefficient, intercept and slope for the calibration data are sum-marized in Table 1. Sensitivity parameters such as apparent molar absorptivity and Sandell sensitivity values, the limits of detection and quantification are calculated as per the current ICH guidelines47
are compiled in the same table, speak of the excellent sensitivity of the proposed method.
Precision and accuracy
Intra-day precision and accuracy of the proposed method were evaluated by replicate analysis (n = 7) of calibration standards at three different concentration levels on the same day. Inter-day precision and accuracy were determined by assaying the calibration standards at the same concentration levels on 5 consecutive days. Percentage relative standard deviation (RSD, %) as precision and percentage relative error (RE, %) as accuracy of the proposed method were calculated. These results of accuracy and precision showed that the proposed methods have good repeatability and reproducibility (Table 2).
Robustness and ruggedness
Method robustness and ruggedness were demonstrated by deter-mination of LAN at 3 different concentrations. Method robustness was tested by measuring the absorbance at 280, 281 and 282 nm whereas the method ruggedness was performed by four different analysts, and also with three different instruments by a single analyst. The intermediate precision, expressed as percent RSD, which is a measure of robustness and ruggedness was within the acceptable limits as shown in the Table 3.
Selectivity and interference
The proposed method was tested for selectivity by placebo blank and synthetic mixture analyses. The analysis of placebo blank solution was subjected to analysis according to the recommended procedure described under “construction of calibration curve” and found that there was no interference from the inactive ingredients as indicated by the near blank absorbance. This result shows the selectivity of the method.
A separate experiment was performed with the synthetic mixture. The analysis of synthetic mixture solution yielded percent recoveries which ranged from 104.1-107.6 with standard deviation of 0.89-1.09. The results of this study are presented in Table 4 indicating that the inactive ingredients did not interfere in the assay. These results further demonstrate the selectivity of the proposed method.
Application to capsules
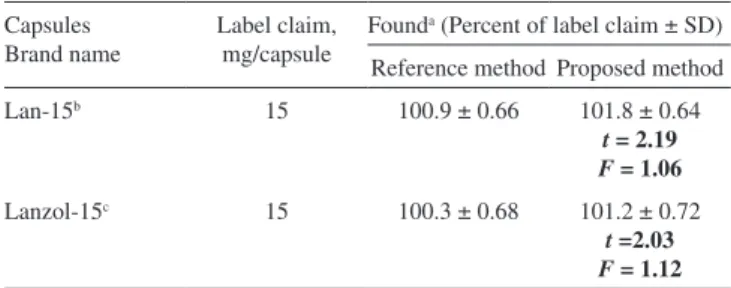
In order to evaluate the analytical applicability of the proposed method to the quantification of LAN in commercial capsules, the results obtained by the proposed method were compared to those of the reference method11 by applying Student’s t-test for accuracy and
Figure 5. Degradation of LAN under oxidation condition with H2O2
Table 1. Sensitivity and regression parameters
Parameter Proposed method
λmax, nm 281
Linear range, µg/mL 1.25 – 25.0
Molar absorptivity (ε), L/molcm 1.53 × 10⁴
Sandell sensitivity*, µg/cm2 0.024
Limit of detection (LOD), µg/mL 0.11 Limit of quantification (LOQ), µg/mL 0.32 Regression equation, Y**
Intercept (a) 0.0002
Slope (b) 0.042
Standard deviation of a (Sa) 0.012
Standard deviation of b (Sb) 0.0007
Regression coefficient (r) 0.999
*Limit of determination as the weight in µg/mL of solution, which corresponds to an absorbance of A = 0.001 measured in a cuvette of cross-sectional area 1 cm2 and l = 1 cm. **Y = a + b X, Where Y is the absorbance, X is concentration in µg/mL, a is intercept and b is slope.
Table 2. Evaluation of intra-day and inter-day accuracy and precision
LAN taken, µg/mL Intra-day accuracy and precision (n = 7) Inter-day accuracy and precision (n = 5)
LAN found, µg/mL %RE %RSD LAN found, µg/mL %RE %RSD
5.0 4.91 1.73 0.99 4.88 2.40 1.16
15.0 15.09 0.65 0.91 15.13 0.87 1.22
25.0 24.80 0.80 0.77 24.77 0.92 1.05
RE: Relative error and RSD: Relative standard deviation.
Table 3. Robustness and ruggedness expressed as intermediate precision (% RSD)
LAN taken, µg/mL
Method robustness
Method ruggedness Parameter altered
Wavelength*, nm, RSD % (n = 3) Inter-analysts’ RSD, % (n = 4) Inter-instruments’ RSD, % (n = 3)
5.0 2.29 0.95 2.21
15.0 2.56 0.84 2.09
25.0 3.38 0.91 2.97
F-test for precision. The results (Table 5) showed that the Student’s t- and F-values at 95% confidence level did not exceed the tabulated values, which confirmed that there is a good agreement between the results obtained by the proposed method and the reference method with respect to accuracy and precision.
Recovery studies
The accuracy and validity of the proposed method were further ascertained by performing recovery studies. Pre-analyzed capsule powder was spiked with pure LAN at 3 concentration levels (50, 100 and 150% of that in capsule powder) and the total was found by the proposed method. The added LAN recovery percentage values ranged from 101.7-103.4% with standard deviation of 0.69-0.78 (Table 6) indicating that the recovery was good, and that the co-formulated substance did not interfere in the determination.
CONCLUSIONS
Stress testing is an important aspect of the drug development process. The present study reports a simple method for quantification of LAN in capsules as well as stress testing study. The previously reported polarographic methods26,42,43 for degradation studies are
complex and cumbersome and are crucially depend on the repro-ducibility of the mercury drop rate and pH of the reaction medium. Even the methods using NMR spectrometry,HPLC and LC-MS require judicious control of pH of the medium besides requiring expensive and sophisticated instruments. In contrast, the present method requires simple and inexpensive instrument and involves minimal manipulation producing relatively more and accurate
results, and thus can be used for the routine determination of LAN in its available dosage forms.
ACKNOWLEDGEMENTS
The authors wish to acknowledge, Cipla Ltd, Bangalore, India, for providing the gift sample of lansoprazole. OZD, PJR and KBV thank the authorities of the University of Mysore, Mysore, for permission and facilities.One of the authors (OZD) also wishes to thank Uni-versity Grant Commission (UGC), New Delhi, India, for the award of UGC Meritorious Research Fellowship.
REFERENCES
1. Yoshida, N.; Uchiyama, K.; Kuroda, M.; Sakuma, K.; Kokura, S.; Ichikawa, H.; Naito, Y.; Takemura, T.; Yoshikawa, T.; Okanoue, T.; Scand. J. Gastroenterol. 2004, 39, 816.
2. Isomoto, H.; Nishi, Y.; Wang, A.; Takeshima, F.; Omagari, K.; Mizuta, Y.; Shikuwa, S.; Murata, I.; Kohno, S.; Am. J. Gastroenterol. 2004, 99, 1063.
3. Isomoto, H.; Nishi, Y.; Kanazawa, Y.; Shikuwa, S.; Mizuta, Y.; Inoue, K.; Kohno, S.; J. Clin. Biochem. Nutr. 2007, 41, 84.
4. Ichikawa, H.; Yoshida, N.; Takagi, T.; Tomatsuri, N.; Katada, K.; Iso-zaki, Y.; Uchiyama, K.; Naito, Y.; Okanoue, T.; Yoshikawa, T.; World J. Gastroenterol. 2004, 10, 2814.
5. Higuchi, K.; Yoda, Y.; Amagase, K.; Kato, S.; Tokioka, S.; Murano, M.; Takeuchi, K.; Umegaki, E.; J. Clin. Biochem. Nutr. 2009, 45, 125. 6. Hendriks, H. J.; van Kreel, B.; Forget P. P.; J. Pediatr. Gastroenterol.
Nutr. 2001, 33, 260.
7. Naito, Y.; Takagi, T.; Yoshikawa, T.;Mol. Cell. Pharmacol. 2010, 2, 53. 8. Garg, S. K.; Chugh, Y.; Tripathi, S. K.; Kumar, N.; Sharma, P. L.; Int. J.
Clin.Pharmacol. Ther. 1993, 31, 96.
9. Spencer, C. M.; Faulds,D.; Indian Drugs 1994, 48, 404.
10. The United States Pharmacopoeia, XXIV Revision, the National For-mulary XIX Rockville, USP Convention, 2000.
11. British Pharmacopoeia, Her Majesty’s Stationery Office, London, 2009, vol. I and II.
12. Prasanna Kumar Reddy, B.; Ramanjaneya Reddy, Y.; Ramachandran, D.; E-J. Chem. 2009, 6,489.
13. Avgerinos, A.; Karidas, T. H.; Potsides, C.; Axarlis, S.; Eur. J. Drug Metab. Ph. 1998, 23, 329.
14. El-sherif, Z. A.; Mohamed, A. O.; El-Bardicy, M. G.; El-Tarras, M. F.; Chem. Pharm. Bull. 2006, 54, 814.
15. Petkovska,R.; Cornett,C.; Dimitrovska,A.; J. Liq. Chromatogr. Relat. Technol. 2008, 31, 2159.
16. Cao, S. X.;Guo,Y. C.; Liao,X. C.; Guo,Y. C.; Ruan, B. Y.; Zhao,Y. F.; Fenxi. Ceshi. Xuebao2006, 25, 41.
17. Patel, B.; Dedania, Z.; Dedania, R.; Ramolia, C.; Vidya Sagar, G.; Mehta, R. S.; Asian J. Research Chem. 2009, 2, 210.
18. Prasanna Reddy, B.; Jayaprakash, M.; Jyothesh Kuamr, K. S. G. T.; Int. J. Appl. Biol. Pharm. Technol. 2010, 1, 683.
19. Susheel, J. V.; Lekha, M.; Ravi, T. K.; Indian J. Pharm. Sci. 2007, 69, 684.
20. Argekar, A. P.; Kunjir,S. S.; J. Planar Chromatgr.-- Mod. TLC1996, 9, 296.
21. Lin, Y. H.; Wu,S. M.; LCGC - Europe2005, 18, 164.
22. Tivesten,A.; Folestad,S.; Schonbacher, V.; Svensson,K.; Chromato-graphia1999, 49, S7.
23. El-Enany,N.; Belal,F.; Rizk, M.; J. Biochem. Biophys. Methods2008, 70, 889.
24. Ozkan,S. A.; Uslu,B.; Aboul-Enein,H. Y.; Crit. Rev. Anal. Chem. 2003, 33, 155.
25. Yardimci,C.; Ozaltin, C.;Analyst2001, 126, 361.
Table 4. Recovery of the drug from synthetic mixture
LAN in synthetic mixture taken LAN recovereda (Percent ± SD)
5.0 107.6 ± 0.94
15.0 104.1 ± 1.09
25.0 106.4 ± 0.89
aMean value of 5 determinations
Table 5. Results of analysis of capsules by the proposed method
Capsules Brand name
Label claim, mg/capsule
Founda (Percent of label claim ± SD) Reference method Proposed method
Lan-15b 15 100.9 ± 0.66 101.8 ± 0.64
t = 2.19 F = 1.06
Lanzol-15c 15 100.3 ± 0.68 101.2 ± 0.72
t =2.03 F = 1.12
aMean value of 5 determinations. bIntas Pharmaceuticals, Dehradun, India; cCipla Ltd, Sikkim, India. The value of t (tabulated) at 95% confidence level and for 4 degrees of freedom is 2.77. The value of F (tabulated) at 95% con-fidence level and for 4 degrees of freedom is 6.39.
Table 6. Accuracy assessment by recovery experiments
Capsule studied LAN in capsule, µg/mL Pure LAN added, µg/mL Total found, µg/mL Pure LAN recovereda Percent ± SD
Lanzol-15 10.12 5.0 15.29 103. 39 ± 0.73
10.12 10.0 20.80 106.79 ± 0.69
10.12 15.0 25.31 101.27 ± 0.78
26. Belal, F.; El-Enany, N.; Rizk, M.; J. Food Drug Anal. 2004, 12, 102. 27. Radi,A.; J. Pharm. Biomed. Anal. 2003, 31, 1007.
28. Basavaiah, K.; Ramakrishna, V.; Anilkumar, U. R.; Eclet. Quím. 2006, 31, 67.
29. Moustafa, A. A. M.; J. Pharm. Biomed. Anal. 2000, 22, 45.
30. Meyyanathan,S. N.; Raj,J. R. A.; Suresh, B.; Indian Drugs1997, 34, 403.
31. Basavaiah, K.; Ramakrishna, V.; Anilkumar, U. R.; Udaya, K.; Indian J. Chem. Technol. 2006, 13, 549.
32. Basavaiah, K.; Ramakrishna, V.; Anilkumar, U. R.; Acta Pharm. 2007, 57, 211.
33. Akheel Ahmed, S.; Syeda, A.; Indian J. Pharm. Sci. 2008, 70, 507. 34. Akheel Ahmed, S.; Syeda, A.; Bull. Chem. Soc. Ethiop.2007, 21, 315. 35. Basavaiah, K.; Ramakrishna, V.; Anilkumar, U. R.; Somashekar, B. C.;
Eclét. Quím. 2007, 32, 57.
36. Rahman, N.; Kashif, M.; Drug Test. Anal. 2010, 2, 137.
37. Rahman, N.; Bano, Z.; Hejaz Azmi, S. N.; Kashif, M.; J. Serb. Chem. Soc. 2006, 71, 1107.
38. Yeniceli,D.; Dogrukol-Ak, D.; Tuncel,M.; J. Pharm. Biomed. Anal.
2004, 36, 145.
39. Sherje, A. P.; Kasture, A. V.; Gujar, K. N.; Yeole, P. G.; Indian J. Pharm. Sci.2008, 70, 102.
40. Özaltín, N.;J. Pharm. Biomed. Anal. 1999, 20, 599.
41. Wahbi,A. A. M.; Abdel-Razak,O.; Gazy, A. A.;Mahgoub,H.; Moneeb, M. S.; J. Pharm. Biomed. Anal.2002, 30, 1133.
42. Tutunji, M. F.; Qaisi, A. M.; El-Eswed, B.; Tutunji, L.F.; Int. J. Pharm.
2006, 323, 110.
43. Gupta, H. P.; Saini, K.; Dhingra, P.; Pandey, R.; Portugaliae Electrochim. Acta2008, 26, 433.
44. DellaGreca, M.; Iesce, M. R.; Previtera, L.; Rubino, M.; Temussi, F.; Brigante, M.; Chemosphere2006, 63, 1087.
45. Jeffrey, S.; Steven, D.; Jiajie, H.; Kai, L.; Prasanna, S.; Xiaoya, D.; Pharmacopeial Forum2006, 6, 32.
46. ICH-Q1A; Stability Testing of New Drug Substances and Products, International Conference on Harmonisation, Geneva, February 2003. 47. International Conference On Harmonization of Technical Requirements