Absorbance Correction Method for
Simultaneous Estimation of Nifedipine and
Metoprolol Succinate in Their Synthetic
Mixture Using From Spectrophotometry
Sojitra Rajanit1*, Virani Paras1, Hashumati Raj
1*
Department of quality assurance, shree dhanvantry Pharmacy College, Kim, Surat.
ABSTRACT
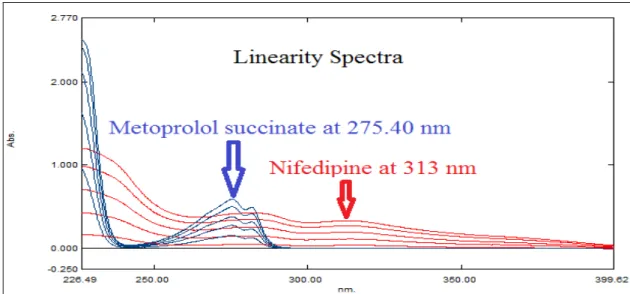
A new simple, economical, precise and accurate method are described for the simultaneous determination of Nifedipine (NIF) and Metoprolol Succinate (MET) in combined tablet dosage form. The proposed method was applied for the determination of Nifedipine and Metoprolol Succinate in synthetic mixture, for determination of sampling wavelength, 10 g/ml of each of NIF and MET were scanned in 200-400 nm range and sampling wavelengths were 313nm for NIF and 275.40nm for MET are selected for development and validation of absorption correction method. For this method linearity observed in the range of 5-25 g/ml for NIF and 25-125 g/ml for MET, and in their pharmaceutical formulation with mean percentage recoveries 100.68 and 100.33, respectively. The method was validated according to ICH guidelines and can be applied for routine quality control testing.
KEYWORDS: Spectroscopic method, absorption corrected method, Nifedipine and Metoprolol Succinate.
1. INTRODUCTION
The aim of the present work was to develop a new simple, rapid, selective method for the simultaneous determination of components having overlapping spectra in binary mixtures, having the advantages of minimal data processing and a wider range of applications over the previously mentioned methods. To prove the ability of the newly described method in resolving the overlapping spectral data and simultaneous determination of each component, it was applied for the analysis of a mixture of Nifedipine (NIF) and Metoprolol Succinate (MET) formulated together in the form of synthetic mixture widely used for the treatment of heart related problems accompanying several hypertension.
Nifedipine is dimethyl 1, 4-dihydro-2, 6- dimethyl-4-(2-nitrophenyl)pyridine-3,5- dicarboxylate.1,2 It is a calcium channel blocker, one of the most widely used coronary vasodilators.3,4 Nifedipine acts by blocking the inward movement of calcium by binding to L-type calcium channels in the heart and smooth muscle of the coronary and peripheral arteriolar vasculature. This causes vascular smooth muscle to relax, dilating mainly arterioles.5,6 Metoprolol succinate is a selective β-adrenergic antagonist, which is used in the treatment of cardiovascular disorders such as hypertension, angina pectoris, cardiac arrhythmias, congestive heart failure and myocardial infarction. Metoprolol is administered orally as tablet. Chemically Metoprolol succinate is (RS)-1- (Isopropylamino)-3-[p-(2-methoxyethyl) phenoxy] propan-2- ol succinate with molecular formula C34H54N2O10.7,8
(A) (B)
1.1. THEORY
• This method is modification of simultaneous equation method. This method uses the absorbances at two selected wavelengths, one at max of one drug where other drug also shows considerable absorbance ( 2) and other being the wavelength at which the first drug has practically nil absorbance ( 1).
• The concentration of two drugs (X and Y) in sample solution was calculated by using following equations:
• Cy = A2 / ay2……… ……… (1)
• Cx = A1-ay1* Cy/ax1... ... (2)
Where, A1 and A2 are the absorbances of mixture at 1 and 2 respectively, ay1 and ay2 are absorptivities of y at 1 and 2 respectively, ax1 is absorptivity of X at 2,
CX is concentration of X, CY is concentration of Y.
2. MATERIAL AND METHOD 2.1. Apparatus
A double beam UV/Visible spectrophotometer (Shimadzu model 2450, Japan) with spectral width of 2 nm, 1 cm quartz cells was used to measure absorbance of all the solutions. Spectra were automatically obtained by UV-Probe system software.
2.2. Reference samples
NIF and MET reference standard are kindly supply by J.B. Chemicals, Ankleshwar and CTX Life Science, Surat as a gift sample respectively.
2.3. MATERIALS AND REAGENTS
Methanol AR grade (RANKEM)
2.4. STANDARD SOLUTIONS
2.4.1. Standard solution of Nifedipine (NIF)
Accurately weighed quantity of N I F 10mg was transferred to 100ml volumetric flask, dissolved and diluted up to mark with Methanol to give a stock solution having strength 100µ g/ml.
2.4.2. Standard solution of Metoprolol succinate (MET)
Accurately weighed quantity of MET 50mg was transferred into 100ml volumetric flask, dissolved and diluted up to mark with Methanol to give a stock solution having strength 500µ g/ml.
2.4.3. Preparation of standard mixture
Pipette out accurately 0.5ml of NIF stock solution (100µ g/ml), 0.5ml of MET stock solution (500µ g/ml) in 10 ml volumetric flask and make up the volume up to the mark with Methanol. It gives solution containing NIF 5µ g/ml, MET 25µ g/ml.
2.4.4. Test sample preparation
Dissolve synthetic mixture formulation in 100ml volumetric flask containing 100ml methanol. Take 1ml mixture sample solution in 10ml volumetric flask and make up volume up to mark with methanol.
2.5. PROCEDURES
2.5.1. Construction of calibration curves (linearity)
This series consisted of five concentrations of standard NIF solution ranging from 5-25 g/ml. The solutions were prepared by pipetting out standard NIF stock solution (0.5ml, 1ml, 1.5ml, 2.0ml, 2.5ml) was transferred into a series of 10ml volumetric flasks and volume was adjusted up to mark with Methanol. A zero order spectra of the resulting solutions were recorded, measured the absorbance at 313nm against a reagent blank solution (Methanol). Calibration curve was prepared by plotting absorbance versus respective concentration of NIF.
FIG. 2 Overlain linear zero order spectra of NIF (Red) and MET (Blue) in 1:5 ratio
2.5.2. Analysis of laboratory-prepared mixtures.
Laboratory-prepared mixtures containing different ratios of NIF and MET were prepared. By applying the procedure under linearity, absorbances at 313nm were recorded for NIF and 275.40nm were recorded for MET. The concentration of each drug in each mixture was calculated from its corresponding Cx and Cy equation. Validity of the method was assessed by spiking the pharmaceutical formulation by known amounts of standard drug powders (standard addition technique). The recovery of the added standards was then calculated after applying the proposed method.
2.5.3. Application of the proposed method for the simultaneous determination of NIF and MET in synthetic mixture.
In that mixture the excipient were like HPMC, silicon dioxide and guar gum were taken as per the required weight. With the Nifedipine and Metoprolol Succinate with the ratio dissolved in methanol with all excipient.
Finally the in the Synthetic mixture had the concentration 100µ g/ml and 500µ g/ml respectively for NIF and MET. After that from this solution 1ml was pipette out and diluted upto 10ml with methanol. So the concentration was 10 µ g/ml and 50 µ g/ml for NIF and MET respectively.
3. RESULTS AND DISCUSSION
The absorbance wavelength for NIF and MET found to be 313nm and 275.40nm, respectively, which are different and hence non-overlapping. Thus simultaneous determination of NIF and MET in bulk mixture-I and synthetic mixture solution-I was found to be successful by absorption corrected.
3.1.Specificity
The specificity of the method was investigated by observing any interference of one drug with other two drugs in bulk mixture and formulation solution. Similarly the interference of excipients of synthetic mixture with drugs was investigated.
3.2. Linearity and Range
The linearity of method is its ability within a given range to obtain test results which are directly or through a mathematical transformation, proportional to the concentration of analyte. Linearity of the method was determined at five concentration levels for NIF and MET independently.
3.3.Accuracy
The accuracy of an analytical method is the closeness of the test results to the true value. It was tested by spiking standard NIF solution in different concentration 80, 100 and 120% to a tablet solution. The synthetic mixture solution was analyzed at 313nm for estimation of NIF. Similarly, the accuracy for MET was determined at 275.40nm, respectively.
3.4.Precision
3.5. LOD and LOQ
The LOD of an analytical method is the lowest amount of analyte in a sample which can be detected but not necessarily quantified. The detection limit (DL) of method was determined by equation, DL = (3.3 σ)/S, where,
σ– standard deviation of blank response, S– slope of the calibration curve. The quantitation limit (QL) of analyte was determined by equation DL = (10 σ)/S, where, σ– standard deviation of blank response, S– slope of the calibration curve
3.6. Robustness and Ruggedness
Robustness and ruggedness of the method has been evaluated at two different levels i.e. change in stock solution and changing the instrument.
4. ANALYSIS OF SYNTHETIC MIXTURE
The proposed method was successfully applied to the analysis of both mixtures in their pharmaceutical preparations. Results obtained were precise and in good agreement with the labelled claim as concluded from the satisfactory values of % recovery and RSD (%) gathered in table 2 and 3. Proposed method is precise and accurate, and give same result in same day and between the day and this data is gathered in table 1. When we change in standard stock concentration or changed the instrument that time also this proposed method give good result this data also gathered in table 4 and 5.
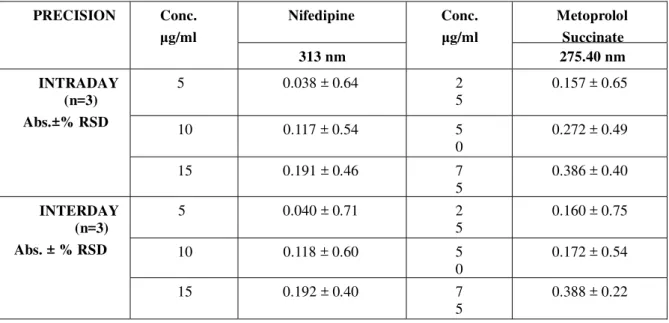
Table 1 Inter day and intraday precision data for Nifedipine and Metoprolol Succinate in three different concentration ranges.
PRECISION Conc.
μg/ml
Nifedipine Conc.
μg/ml
Metoprolol
Succinate
313 nm 275.40 nm
INTRADAY (n=3)
Abs.±% RSD
5 0.038 ± 0.64 2
5
0.157 ± 0.65
10 0.117 ± 0.54 5
0
0.272 ± 0.49
15 0.191 ± 0.46 7
5
0.386 ± 0.40
INTERDAY (n=3)
Abs. ± % RSD
5 0.040 ± 0.71 2
5
0.160 ± 0.75
10 0.118 ± 0.60 5
0
0.172 ± 0.54
15 0.192 ± 0.40 7
5
Table 2 Accuracy data for Nifedipine and Metoprolol Succinate with % recovery and % RSD Level of recovery Initial conc. (µg/ml) Quantity of Std. Added (µg/ml) Total Amoun t (µg/ml)
Result of recovery study
Total Quantit y Found* (µg/ml) ± %RSD
% recovery ± %RSD
LEVEL NIF MET NIF MET NIF MET NIF MET NIF MET
Placebo 10 50 - - 10 50 10.05
± 0.26 50.15 ± 0.30 100.50 ± 0.30 100.30 ± 0.25
80 % 10 50 8 4
0 18 90
18.11 ± 0.16 90.19 ± 0.11 100.61± 0.19 100.46 ± 0.17
100 % 10 50 10 5
0 20 100
20.15 ± 0.19 100.29 ± 0.13 100.68 ± 0.22 100.29 ± 0.15
120 % 10 50 12 6
0 22 120
22.17 ± 0.13 120.47 ± 0.39 100.77 ± 0.15 100.78 ± 0.13
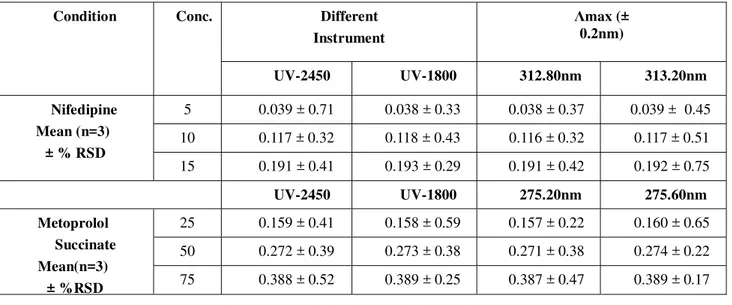
Table 3 Robustness and ruggedness data into that change in instrument and change in (±0.2nm) wavelength of both drug.
Condition Conc. Different
Instrument
Λmax (± 0.2nm)
UV-2450 UV-1800 312.80nm 313.20nm
Nifedipine Mean (n=3)
± % RSD
5 0.039 ± 0.71 0.038 ± 0.33 0.038 ± 0.37 0.039 ± 0.45
10 0.117 ± 0.32 0.118 ± 0.43 0.116 ± 0.32 0.117 ± 0.51
15 0.191 ± 0.41 0.193 ± 0.29 0.191 ± 0.42 0.192 ± 0.75
UV-2450 UV-1800 275.20nm 275.60nm
Metoprolol
Succinate
Mean(n=3) ± %RSD
25 0.159 ± 0.41 0.158 ± 0.59 0.157 ± 0.22 0.160 ± 0.65
50 0.272 ± 0.39 0.273 ± 0.38 0.271 ± 0.38 0.274 ± 0.22
75 0.388 ± 0.52 0.389 ± 0.25 0.387 ± 0.47 0.389 ± 0.17
Table 4 LOD&LOQ data for Nifedipine and Metoprolol Succinate.
Drugs LOD (µg/ml) LOQ (µg/ml)
Nifedipine 0.038 0.066
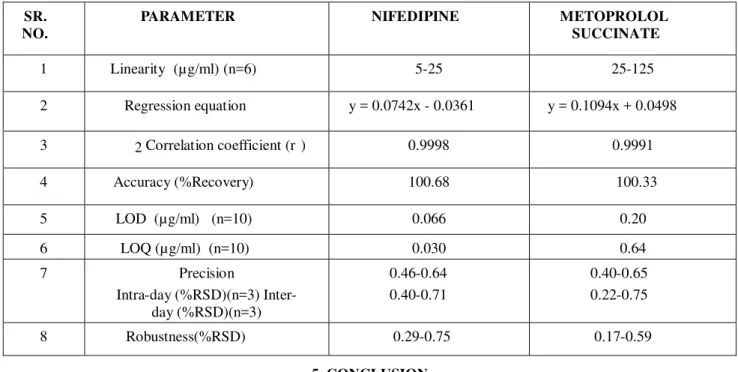
Table 5 Result of all validation and development parameters for this proposed method for Nifedipine and Metoprolol Succinate.
SR. NO.
PARAMETER NIFEDIPINE METOPROLOL
SUCCINATE
1 Linearity (µg/ml) (n=6) 5-25 25-125
2 Regression equation y = 0.0742x - 0.0361 y = 0.1094x + 0.0498
3 2 Correlation coefficient (r ) 0.9998 0.9991
4 Accuracy (%Recovery) 100.68 100.33
5 LOD (µg/ml) (n=10) 0.066 0.20
6 LOQ (µg/ml) (n=10) 0.030 0.64
7 Precision Intra-day (%RSD)(n=3)
Inter-day (%RSD)(n=3)
0.46-0.64 0.40-0.71
0.40-0.65 0.22-0.75
8 Robustness(%RSD) 0.29-0.75 0.17-0.59
5. CONCLUSION
A novel, simple, rapid and sensitive method is proposed for the analysis of two binary mixtures with overlapping spectra. The method involves the generation of absorbance spectra followed by measurement of the absorbance. The proposed method does not require any sophisticated mathematical treatment for the absorption data, and it exhibits several advantages over other spectrophotometric methods for resolution of binary mixtures. The applicability of the developed method was evaluated through the determination of drug combinations in several laboratory-prepared mixtures with good accuracy and precision. Therefore, the presented methodology is adequate for the routine quality control analysis of these fixed-dose combinations.
CONFLICT OF INTEREST
The authors confirm that this article content has no conflict of interest.
ACKNOWLEDGEMENTS
Declared none.
REFERENCES
[1] The European Pharmacopoeia, 7th Edn; Published by the European Directorate for the Quality of Medicines & Health Care, Vol. II,
2011, pp. 2495-2496.
[2] Martindale, Royal Pharmaceutical Society of Great Britain, 34th Edn, The Pharmaceutical press, London, 2005, pp. 966.
[3] Lippincott Williams and Wilkins, Foye’s principles of medicinal chemistry, 5th Edn, 351-west Camden street, 2007, pp. 552.
[4] Brunton L, Parker K and Buxton L, Goodman and Gillman’s manual of pharmacology and therapeutics, 3rd Edn; the Mcgraw – Hill
compnies publication, New York, 2007, pp. 856.
[5] Remington, The Science & Practice of Pharmacy, 21st Edn, Vol. II, pp. 1366.
[6] Lippincott’s Illustrated Reviews, Lippincott Williams & Wilkins, Pharmacology, 5th Edn, pp. 236.
[7] Applied Pharmaceutical Science, The Merck Index: An Encyclopedia of Chemicals, Drugs & Biologicals, Merck Research
Laboratories, Merck and Co. Inc., 2011, pp. 112-115.
[8] Brunton L, Parker K and Buxton L, Goodman and Gillman’s manual of pharmacology and therapeutics, 3rd Edn; the Mcgraw – Hill