Article
0103 - 5053 $6.00+0.00
*e-mail: [email protected]
Reference Concentrations for Trace Elements in Urine for the Brazilian Population
based on q-ICP-MS with a Simple Dilute-and-Shoot Procedure
Bruno L. Batista,a Jairo L. Rodrigues,a Luciano Tormen,b Adilson J. Curtiusb and Fernando Barbosa Jr*,a
aLaboratório de Toxicologia e Essencialidade de Metais, Departamento de Análises Clínicas, Toxicológicas e
Bromatológicas, Faculdade de Ciências Farmacêuticas de Ribeirão Preto-USP, Avenida do Café s/n, Monte Alegre, 14040-903 Ribeirão Preto-SP, Brazil
bUniversidade Federal de Santa Catarina, Departamento de Química, Campus Trindade, 88040-900 Florianópolis-SC, Brazil
O biomonitoramento de elementos químicos é de extrema importância na avaliação da saúde humana. Entretanto, as concentrações dos elementos químicos nos luidos biológicos são afetadas por parâmetros ambientais e isiológicos e, consequentemente, consideráveis variações podem ocorrer entre subgrupos de populações especíicas. O Brasil é um país com ampla diversidade ambiental e existe limitado conhecimento de valores de referência para elementos químicos em luidos biológicos. A espectrometria de absorção atômica (AAS) e a espectrometria de emissão ótica com plasma acoplado indutivamente (ICP-OES) ainda são as técnicas analíticas mais comumente empregadas no biomonitoramento de elementos químicos em amostras clínicas. Entretanto, o uso da espectrometria de massas com plasma acoplado indutivamente (ICP-MS) está se tornando a cada dia mais comum nos laboratórios clínicos. Neste estudo, foi avaliado um método rápido envolvendo simples diluição da amostra para determinação de Al, Ba, Be, Cd, Co, Cu, Cs, Mn, Ni, Pb, Pt, Sb, Se, Sn, Tl e U em urina por ICP-MS. Amostras de urina (500 μL) foram pipetadas em frascos cônicos de 15 mL e diluídas para 10 mL com uma solução contendo 0,5 % (v/v) HNO3 + 0,005% (v/v) Triton X-100.
Ródio, irídio e ítrio foram adicionados como padrões internos. Em seguida, as amostras foram diretamente analisadas por ICP-MS com calibração por ajuste de matriz. Os limites de detecção do método (3s, n = 20) foram da ordem de ng L-1 para todos os analitos em estudo. O método foi aplicado
para a análise de 412 amostras de urina de brasileiros saudáveis e não expostos ambientalmente ou ocupacionalmente a metais para o estabelecimento de valores de referência na população brasileira. A validação dos resultados foi acompanhada pela análise de material de referência certiicada de urina (SRM) 2670a proveniente do National Institute of Standards and Technology (NIST) e de materiais de referência provenientes do Institut National de Sante´ Publique Du Quebec, no Canadá.
Biomonitoring of trace elements is of critical importance in human health assessment. However, trace element concentrations in biological luids are affected by environmental and physiological parameters, and therefore considerable variations can occur between speciic population subgroups. Brazil is a large country with large environmental diversity and with a limited knowledge of the reference values (baseline data) for trace elements in biological luids. Atomic absorption spectrometry (AAS) and inductively coupled plasma emission spectrometry (ICP-OES) are still the dominant analytical techniques used for biomonitoring trace element analysis in clinical specimens. However, the use of ICP-MS is becoming more usual in clinical laboratory analysis. Then, we evaluated here a simple dilute-and-shoot method for sequential determination of Al, Ba, Be, Cd, Co, Cu, Cs, Mn, Ni, Pb, Pt, Sb, Se, Sn, Tl and U in urine by quadrupole inductively coupled plasma mass spectrometry (q-ICP-MS). Urine samples (500 μL) were accurately pipetted into conical tubes (15 mL) and diluted to 10 mL with a solution containing 0.5 % (v/v) HNO3
+ 0.005% (v/v) Triton X-100. Diluted urine samples also contain rhodium, iridium and yttrium added as internal standards. After that, samples were directly analyzed by ICP-MS against matrix-matching calibration. Method detection limit (3s, n = 20) were in the ng L-1 range for all analytes.
The method was applied to the analysis of 412 ordinary urine samples from Brazilian healthy and non-exposed subjects to establish reference values. Data validation was provided by the analysis of the standard reference material (SRM) 2670a toxic elements in urine (freeze-dried) (high and low levels) from the National Institute of Standards and Technology (NIST) and reference urine samples from the trace elements intercomparison program operated by the Institut National de Sante´ Publique du Quebec, Canada.
Keywords: ICP-MS, atomic spectrometry, clinical samples, trace elements, rapid treatment,
Introduction
The signiicance of trace elements in human health and disease has been reviewed in numerous scientiic publications.1,2 Trace elements may be either essential or non-essential. Essential elements are those that are required by an organism to maintain its normal physiological function. This definition of essential elements is based mainly on the observation that inadequate intake causes impairment of human health which can be reversed by administering the element. Many essential trace elements are parts of protein complexes, (e.g., metalloproteins), which are required for enzymatic activities and can play structural roles in connective tissue or cell membranes. Non-essential trace elements are considered toxic and are not required for physiological processes, but essential elements can also cause toxicity when concentrated at excessive levels.3 Without essential elements the organism can not complete its normal life cycle or achieve normal healthy growth. Thus, monitoring the deiciency of essential elements and the exposure to toxic ones is of critical importance in human health. Throughout the world, biomonitoring has become the standard for assessing people’s exposure to toxic substances as well as for responding to serious environmental public health problems.3-5 However, the levels of these elements in biological luids are affected by environmental, dietary habits and physiological parameters, and therefore considerable variations can occur between speciic population subgroups.6 For this reason, several large-scale studies have been undertaken in an effort to establish the baseline ranges of trace elements in speciic populations around the world.7-11 In the United States, the analysis of trace elements in the U.S population, such as lead, cadmium, mercury and selenium, is part of the U.S. National Health and Nutrition Examination Survey (NHANES).12 In European countries, many studies describe baseline levels of essential elements in adults11,13 and children.14,15 However, no large surveys including the determination of trace elements in urine samples have been carried out for Brazilians.
Until very recently, atomic absorption spectrometry (AAS) was the technique of choice in most clinical laboratories specialized in elemental analysis.5,16-20 Nowadays, many clinical laboratories are moving from flame (FAAS) and electrothermal (ETAAS) methods toward methods based on inductively coupled plasma-mass spectrometry (ICP-MS).5,21-23
Compared to AAS, ICP-MS has some distinct advantages, including simultaneous multielement measurement capability coupled with much lower detection
limits.5 Moreover, it offers a wider linear dynamic range which allows the determination of major and trace elements in a same sample aliquot.5 However, for a complete transition from AAS to ICP-MS, the ICP method must be simple and with acceptable uncertainties of the measurements to be considered appropriate in large routine urine analysis of trace elements. Then, the feasibility of methods with minimal sample manipulation and direct sample introduction to the ICP-MS are preferable. However, such methods are still demanding or not in use for routine purposes.
The direct introduction in the plasma of high concentration of organic matrix often results in matrix interferences and/or spectral interferences from polyatomic ions. Moreover, the biological matrix can clog the nebulizer after extended period of analysis. 5,21-23 On the other hand, the sample calibration against matrix-matching associated with the matrix dilution with appropriate reagents to decrease total solids introduction, specialized nebulizers, and lower sample uptake rate may overcome these limitations. Moreover, this approach will reduce clogging of the nebulizer and matrix deposition on the plasma torch and sampler/skimmer cones.5,21-23
Then, in the present work we evaluated the application of a simple dilute-and-shoot procedure for trace elements determination in urine samples by q-ICP-MS looking for preliminary reference values for the Brazilian population.
Experimental
Instrumentation
All measurements were made with an ICP-MS (Elan DRC II Perkin Elmer, Norwalk, CT) operated with high-purity argon (99.999%, White Martins, Brazil). A Meinhard concentric nebulizer (Spectron/Glass Expansion, Ventura, CA, USA) was used and connected to a cyclonic spray chamber. A radiofrequency power of 1100 W was selected. Sample data were acquired using 20 sweeps/reading, 1 reading/replicate and a dwell time of 50 ms on each isotope. All measurements were performed in pulse mode with the autolens function on. Argon nebulizer gas low rate (0.5 - 0.9 L min-1) and lens voltages were optimized daily. Data were acquired in counts per second (cps). The following isotopes were selected: 27Al, 9Be, 59Co, 63Cu, 133Cs, 55Mn, 60Ni, 195Pt, 121Sb, 119Sn, 205Tl,
and 238U. Correction equations were adopted for cadmium: 114Cd − (0.027250×118Sn), lead: (204Pb − [0.230074×202Hg]) +
206Pb + 207Pb + 208Pb), selenium: (
−1.007833×83Kr) and barium: −0.000901×139La
Reagents
All reagents used were of analytical-reagent grade, except HNO3, methanol, ethanol, which were previously puriied in a quartz sub-boiling stills (Kürner) before use. A clean laboratory and laminar-low hood capable of producing class 100 conditions were used for preparing solutions. High purity de-ionized water (resistivity 18.2 MΩ cm-1) obtained using a Milli-Q water puriication system (Millipore, Bedford, MA, USA) was used throughout. All solutions were stored in high-density polyethylene bottles. Plastic bottles and glassware materials were cleaned by soaking in 10% v/v HNO3 for 24 h, rinsing ive times with Milli-Q water and dried in a class 100 laminar low hood before use. All operations and analysis were performed in a clean room class 1000. Multielement stock solutions containing 1000 mg L−1 of each element were obtained from Perkin-Elmer (Perkin Elmer, Norwalk, CT). Matrix-matching calibration curves were prepared daily by spiking a base human urine with the analytes over the range of 0-50 μg L−1 in 0.5% v/v HNO
3 + 0.005% v/v Triton X-100 medium. Rhodium, Ir and Y were added as internal standard at the concentration of 10 μg L-1. Rhodium was selected as internal standard for Al, Ba, Be, Cd, Co, Cu, Mn, Ni, Pb, Pt, Sb, Sn and U, and iridium and yttrium for Tl and Cs, respectively. Rhodium, Ir and Y stock solutions, 1000 mg L−1, were obtained from Perkin-Elmer (Perkin Elmer, Norwalk, CT, USA).
Study population
This study was conducted with subjects from two different Brazilian states (São Paulo and Pará). A total of 835 participants were invited to participate and provide urine samples. They responded to interview-administered questionnaires covering socio-demographics, lifestyle, dietary habits, and residential and work history. Based on questionnaire, we selected 412 volunteers (aged 15 to 60, 41% men and 59% women) for the reference range estimation. From the selected population 63% were from São Paulo State and 37% from Pará State. The criteria of exclusion were: 1) Volunteers diagnosed with diabetes, cancer, hypertension or any other cardiovascular disease; 2) Past history of internal tissue surgeries; 3) pregnancy or sports training; 4) Occupational exposure to metals; 5) Any use of drugs containing chemical elements. The specimens had been obtained every morning (from 10:00 to 12:00) with informed consent from the subjects in accordance with procedures approved by our Institutional Review Board.
Ethical approval was obtained from the Ethics Review Board at the University of São Paulo in Ribeirão Preto (Brazil).
Sample collection
Urine samples were collected in polyethylene containers (Sarstedt, Germany) and stored at 4 °C. Following collection, urine from each donor was mixed and acidiied to 1% v/v acid nitric and then storage frozen at −80 °C before analysis.
Sample preparation and analysis
Urine samples (500 μL), were pipetted into (15 mL) conical tubes. Then, the volume was made up to 10 mL with a solution containing 0.5 v/v HNO3 + 0.005% v/v Triton X-100. Rhodium, Ir and Y were added as internal standards to get 10 μg L-1 inal concentration. Afterwards, samples were directly analyzed by ICP-MS.
Calibration was performed against matrix-matching. A pool of base human urine was prepared after the collection of urine from three presumably healthy adult volunteers into pre-cleaned plastic containers. The pre-collected urine was then pooled and acidiied to 2% v/v with nitric acid. The resulted urine (2 L) was iltered and kept frozen (−20 °C) until analysis.
Data validation
In order to verify the accuracy of our data, the Standard Reference Material (SRM) 2670a Toxic Elements in Urine (Freeze-Dried) (high and low level) from the National Institute of Standards and Technology (NIST) were analyzed. For additional validation, previously analyzed reference urine samples obtained from the Institut National de Sante´ Publique (INSP) du Quebec in Quebec, Canada as part of the external quality assessment schemes (EQAS) were also analyzed.
Statistical analysis
Descriptive data analysis was completed for all trace element levels. Statistical procedures were performed using Statview for Windows version 5.0.1 and JMP 5.0.1a (SAS Institute Inc.) and GraphPad Prism Version 4.0. Multiple regression analysis was performed using log-transformed metal concentrations as the dependent variable and age (or age group) and sex as the independent variables.
Results and Discussion
Method set up for the determination of trace elements in urine
dilution with a solution containing nitric acid (0.5% v/v) plus Triton X-100 (0.005% v/v) was evaluated. For this experiment, three different dilution factors were tested (1:10, 1:20 and 1:50 v/v). To correct for possible isobaric interferences, samples were analyzed against matrix-matching calibration. Moreover, for these preliminary experiments rhodium was used as internal standard. The results were evaluated against the recovery of the analytes in the NIST 2670a SRM (high level) as well as by the precision taken from the mean of three replicates. Using 1:10 (v/v) urine dilution, we observed suitable recoveries and precision (< 5%) for only a small number of analytes (Pb, Cd, Pt and Cs). On the other hand, 1:20 (v/v) SRM urine dilution with 0.5% (v/v) HNO3 + 0.005% (v/v) Triton X-100 provided suitable recoveries of the 16 analytes in study associated with very good precision. Same results were obtained with respect to 1:50 (v/v) urine dilution but with a worse detection limit. Then, for further experiments, urine samples were diluted 1:20 (v/v) and calibration carried out against matrix-matching curves.
Selection of the internal standard
Subsequent experiments were performed to select the internal standard. For ICP-MS analysis, the use of internal standards is recommended in routine analysis to compensate the possible drift during long-term runs. Based on this, the use of three internal standards, namely Rh, Ir
and Y, in the NIST 2670a diluted urine SRM were evaluated in this study. Results are shown in Table 1. For Al, Ba, Be, Cd, Co, Cu, Mn, Ni, Pb, Pt, Sb, Se, Sn and U we obtained better recoveries and precision (based on SRM 2670a analysis) when rhodium was used as internal standard. On the other hand, the use of iridium and yttrium as internal standards provided better results for Tl and Cs, respectively. Then, subsequent experiments were carried out with urine samples and matrix-matching calibration curves diluted to contain 10 μg L-1 of each internal standard.
Analytical characteristics of the method
Method detection limits (MDLs) obtained were 0.05; 0.002; 0.09; 0.01; 0.003; 0.11; 0.05; 0.01; 0.07; 0.03; 0.009; 0.001; 0.05; 0.003; 0.02; 0.002 μg L-1, for Al, Ba, Be, Cd, Co, Cu, Cs, Mn, Ni, Pb, Pt, Sb, Se, Sn, Tl, and U respectively. The MDLs were obtained as 3SD of 20 consecutive measurements of the diluted (1:20 v/v) base urine sample.
Data validation
Validation of the proposed method was accomplished using the NIST SRM 2670a Trace metals in urine (high and low level) as well two secondary reference materials, provided by the the external quality assessment scheme (EQAS) for trace elements operated by the Institut National de Sante´ Publique du Quebec (INSP), Canada.
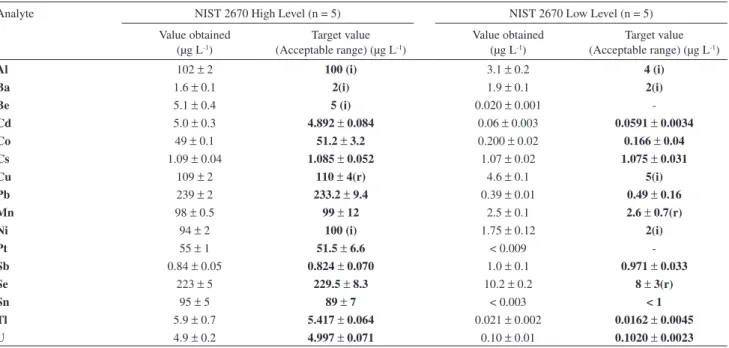
Table 1. Data validation with the use of the ICP-MS method. Results are based on the determination of trace elements in the NIST 2670a Urine Standard
Reference Material (n = 4, mean ± SD)
Analyte NIST 2670 High Level (n = 5) NIST 2670 Low Level (n = 5)
Value obtained (μg L-1)
Target value (Acceptable range) (μg L-1)
Value obtained (μg L-1)
Target value (Acceptable range) (μg L-1)
Al 102 ± 2 100 (i) 3.1 ±0.2 4 (i)
Ba 1.6 ± 0.1 2(i) 1.9 ± 0.1 2(i)
Be 5.1 ± 0.4 5 (i) 0.020 ± 0.001
-Cd 5.0 ± 0.3 4.892 ± 0.084 0.06 ± 0.003 0.0591 ± 0.0034
Co 49 ± 0.1 51.2 ± 3.2 0.200 ± 0.02 0.166 ± 0.04
Cs 1.09 ± 0.04 1.085 ± 0.052 1.07 ± 0.02 1.075 ±0.031
Cu 109 ± 2 110 ± 4(r) 4.6 ± 0.1 5(i)
Pb 239 ± 2 233.2 ± 9.4 0.39 ± 0.01 0.49 ±0.16
Mn 98 ± 0.5 99 ± 12 2.5 ± 0.1 2.6 ±0.7(r)
Ni 94 ± 2 100 (i) 1.75 ± 0.12 2(i)
Pt 55 ± 1 51.5 ± 6.6 < 0.009
-Sb 0.84 ± 0.05 0.824 ± 0.070 1.0 ± 0.1 0.971 ± 0.033
Se 223 ± 5 229.5 ± 8.3 10.2 ± 0.2 8 ± 3(r)
Sn 95 ± 5 89 ± 7 < 0.003 < 1
Tl 5.9 ± 0.7 5.417 ± 0.064 0.021 ± 0.002 0.0162 ± 0.0045
U 4.9 ± 0.2 4.997 ± 0.071 0.10 ± 0.01 0.1020 ± 0.0023
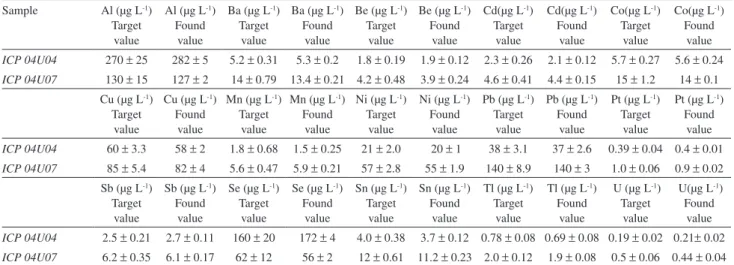
Results for NIST SRM 2670a and the EQAS samples are shown in Tables 1 and 2, respectively. Determined values are in good agreement with established target values.
Most of the analytes in the EQAS samples are not in the same range expected for real urine samples (see analysis of real urine samples below). On the other hand, the majority of the analytes presented in the certiied reference material SRM 2670a (low level) from NIST are in the same range of the baseline values found in real human urine.Then, the analysis of this certiied reference material (low level) may be very useful for method validation.
Uncertainties of the measurements
According to Thompson24 and Spezia et al.25 the simple assessment of the method detection limits for an analytical procedure does not guarantee that all measurements above those limits are satisfactory. Then, it is very important to evaluate overall uncertainties associated with real samples analysis. Based on this, we estimated the uncertainties of the proposed method by the analysis of real urine samples collected from the volunteers used for the reference ranges estimation. The uncertainties of the measurements was evaluated and expressed according to the requirements of EURACHEM/CITAC,26 as a sum of the calibration uncertainty and the repeatability uncertainty (n = 4). Found values are given in Table 3, for the lower and higher value obtained for each element. As it can be seen, for the typical reference values found in real urine samples, associated uncertainties were always lower than 6% for analytes found in higher levels (Al, Cu, Mn and Se) and lower than 35% for analytes found in very lower levels of healthy and non-exposed subjects such as Be, Pt, Tl and U. Based on these data it is demonstrated that the proposed method are
suitable for the analysis of the 16 elements in real urine samples.
Reference ranges in the Brazilian population
Reference range concentrations for environmental contaminants and essential elements serve as an important data in environmental and occupational health as well as nutritional studies. In the case of toxic elements, they provide information about the prevalence and magnitude of exposure, which can be used as a basis for comparing concentrations in subjects who have suspected or known exposure to a point source.
The present study is the irst to provide data for levels of trace elements in urine of the Brazilian population.
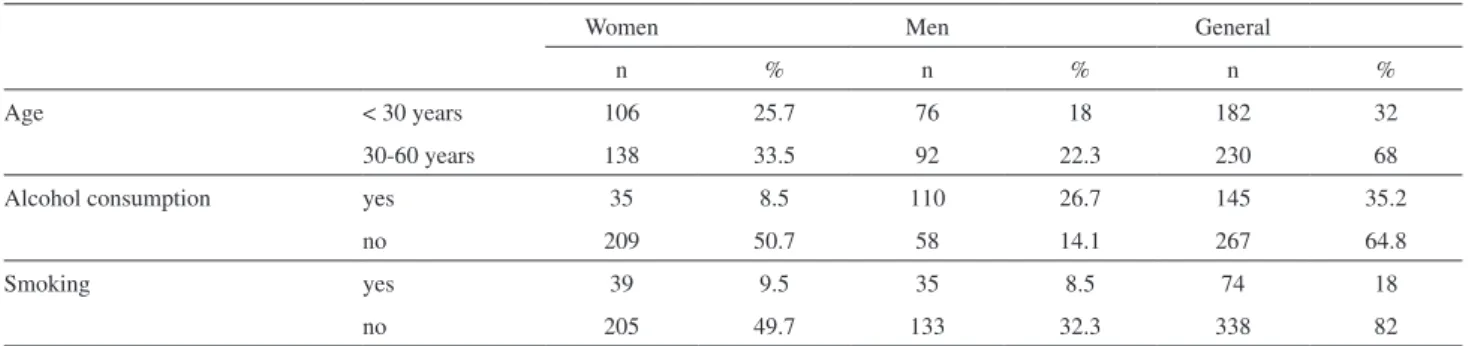
Descriptive data about the study population are shown in Table 3. Age varied from 15 to 60 years (mean: 33.0 years ± 12.7).
The obtained ranges for the trace elements are shown in Table 3 together with reference ranges published in other studies.9,13,28-32 Reference ranges are shown from 5th to 95th percentiles.
For the population in general, the mean concentrations of Al, Ba, Be, Cd, Co, Cu, Cs, Mn, Ni, Pb, Pt, Sb, Se, Sn, Tl and U in urine were 3.4; 1,5; 0.2; 0.3; 0.2; 0.9; 8.2; 0.9; 1.3; 0.8; 0.05; 0.2; 10.1; 2.8; 0.2 and 0.008 μg L-1, respectively. The found values in general are in good agreement with other populations (Table 3).9,13,28-32
The inluence of geographical variation in the concentration of elements in urine
As the reference population came from two different regions of Brazil, it was important to examine if geographic
Table 2. Analytical performance for the determination of trace elements in reference samples (EQAS) from the Institut National de Sante´ Publique du
Quebec (INSP) with the proposed method.(Found values are denoted as mean ± SD, n = 5)
Sample Al (μg L-1)
Target value
Al (μg L-1)
Found value
Ba (μg L-1)
Target value
Ba (μg L-1)
Found value
Be (μg L-1)
Target value
Be (μg L-1)
Found value
Cd(μg L-1)
Target value
Cd(μg L-1)
Found value
Co(μg L-1)
Target value
Co(μg L-1)
Found value
ICP 04U04 270 ± 25 282 ± 5 5.2 ± 0.31 5.3 ± 0.2 1.8 ± 0.19 1.9 ± 0.12 2.3 ± 0.26 2.1 ± 0.12 5.7 ± 0.27 5.6 ± 0.24
ICP 04U07 130 ± 15 127 ± 2 14 ± 0.79 13.4 ± 0.21 4.2 ± 0.48 3.9 ± 0.24 4.6 ± 0.41 4.4 ± 0.15 15 ± 1.2 14 ± 0.1 Cu (μg L-1)
Target value
Cu (μg L-1)
Found value
Mn (μg L-1)
Target value
Mn (μg L-1)
Found value
Ni (μg L-1)
Target value
Ni (μg L-1)
Found value
Pb (μg L-1)
Target value
Pb (μg L-1)
Found value
Pt (μg L-1)
Target value
Pt (μg L-1)
Found value
ICP 04U04 60 ± 3.3 58 ± 2 1.8 ± 0.68 1.5 ± 0.25 21 ± 2.0 20 ± 1 38 ± 3.1 37 ± 2.6 0.39 ± 0.04 0.4 ± 0.01
ICP 04U07 85 ± 5.4 82 ± 4 5.6 ± 0.47 5.9 ± 0.21 57 ± 2.8 55 ± 1.9 140 ± 8.9 140 ± 3 1.0 ± 0.06 0.9 ± 0.02 Sb (μg L-1)
Target value
Sb (μg L-1)
Found value
Se (μg L-1)
Target value
Se (μg L-1)
Found value
Sn (μg L-1)
Target value
Sn (μg L-1)
Found value
Tl (μg L-1)
Target value
Tl (μg L-1)
Found value
U (μg L-1)
Target value
U(μg L-1)
Found value
ICP 04U04 2.5 ± 0.21 2.7 ± 0.11 160 ± 20 172 ± 4 4.0 ± 0.38 3.7 ± 0.12 0.78 ± 0.08 0.69 ± 0.08 0.19 ± 0.02 0.21± 0.02
Table 4. Descriptive data about the study population
Women Men General
n % n % n %
Age < 30 years 106 25.7 76 18 182 32
30-60 years 138 33.5 92 22.3 230 68
Alcohol consumption yes 35 8.5 110 26.7 145 35.2
no 209 50.7 58 14.1 267 64.8
Smoking yes 39 9.5 35 8.5 74 18
no 205 49.7 133 32.3 338 82
Table 3. Estimation of reference values (μg L-1) for the Brazilian population
Element Uncertainty of ICP-MS measurements
for the lower level
(%) [24,25]
Uncertainty of ICP-MS measurements
for the higher level
(%) [24,25]
Brazilian population 5th-95th
percentile (n = 412)
US Population
25th-95th
percentile (n = 500) [31, 32]
UK Citizens (n = 224)
[13]
German population
(n = 14) [29,30]
French population
5th-95th
percentile (n = 100)
[9]
Swedish population (n = 19)
[28]
Al 4.9 1.0 0.22-17.5 - 1.2-168 - 0.16-11.2 < 2.1-16.4
Ba 6.8 0.3 0.2-5.3 < 0.1-8.65 0.5-14.6 - 0.17-3.85 < 0.2-3.3
Be 28.3 5.0 < 0.09-0.65 < 0.07-0.79 - - - < 0.031-0.041
Cd 9.2 4.1 0.05-0.83 - 0.06-1.64 0.06-0.48 0.06-0.79 0.044-0.358
Co 4.7 1.2 0.32-3.7 < 0.7-8.30 0.12-2.05 - 0.16-1.14 0.06-0.51
Cs 10.8 2.3 < 0.05-18.7 < 0.2-11.75 - - - 3.8-17.4
Cu 2.8 0.1 2.2-18.4 - 4.6-40.4 - 4.3-12.1 1.9-15.9
Mn 5.3 0.1 0.5-4.4 < 0.2-3.33 0.09-7.8 - 0.11-1.32 < 0.27-2.50
Ni 2.9 0.5 0.1-4.2 - 0.3-59.0 0.6-3.4 0.59-4.06 0.27-3.68
Pb 11.7 0.6 < 0.03-2.96 1.4-6.40 0.5-30 0.09-0.83 0.01-2.14 0.3-2.0
Pt 27.6 2.5 < 0.009-0.6 < 0.4-4.22 - < 0.010 0.002-0.036 < 0.0016
Sb 20.9 4.2 0.03-2.14 < 0.3-4.17 - 0.01-0.17 0.02-0.08 0.012-0.223
Se 1.6 0.1 5.2-98.9 - 4.0-58.1 - 10.5-45.5
-Sn 3.8 0.4 0.8-12.4 1.7-20.08 - 1.0-2.7 0.05-2.28 < 0.3-5.5
Tl 31.1 5.7 0.08-1.34 0.1-1.18 0.03-0.67 0.05-0.40 0.07-0.84 0.03-0.62
U 34.7 2.1 0.003-0.056 0.004-0.034 - - 0.0002-0.008 < 0.0014-0.0174
or regional environmental factors would have any inluence on the measured values. A comprehensive scan of the data revealed differences in selenium and zinc concentrations between regions of Brazil. Statistical analysis showed urine selenium and zinc levels to be signiicant higher in population from the North of Brazil. In a recent study, our group observed higher levels of Zn in the blood of the same population from the north of Brazil.33 These geographical differences may relect variations in Se and Zn concentrations and/or bioavailability in soils and the differences in food habits. In regions where large variations in Se intake have been observed, it has usually been attributed to locally produce staple food, grown in soils with
varying Se concentrations. 34 Moreover, consume of Brazil nuts, a well-recognized rich source of Se, by the population living in the north of Brazil is common and could explain part of the higher levels in this population.
Smoking status and alcohol consumption
This is in agreement with White and Sabbioni13 indings with a British population. Smoking has being considered an important source of Cd exposure.35 On the other hand, the group who reported alcohol consumption had higher levels of urinary Co, 1.3 μg L-1 compared to 0.7 μg L-1 of non-alcohol consumers.
The inluence of age and gender in the concentration of elements in urine
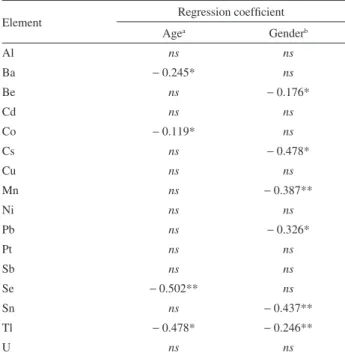
Table 5 lists the results of regression analysis of the logarithm of metal concentration versus age group (< 30 years and > 30 years) and by gender (male = 0; female = 1). The levels of Ba, Co, Se and Tl were signiicantly negatively correlated with age; Be, Cs, Pb, Mn, Tl and Sn were negatively correlated by gender. Although, our indings seems to be interesting it is not clear at this time what physical or physiological meaning should be attached to these observed differences.
Conclusions
In this report, we have presented a simple, fast and accurate procedure for determining 16 elements in urine. A simple 1:20 (v/v) sample dilution followed by analysis using a q-ICP-MS can be performed for approximately 100
specimens per 8-h day. The minimal sample preparation required helps to prevent sample contamination. The method was applied for the analysis of 412 urine samples collected from Brazilians to estimate reference ranges in this population. Obtained data can be used as baseline levels for 16 elements including toxic and essential elements. Moreover, this paper represents an important database for future studies on biomonitoring trace elements exposure and deiciency in the Brazilians.
It should be noted that reference intervals here overlapped the published reference values for other populations, with few minor exceptions.
Acknowledgements
The authors are grateful to Fundação de Amparo à Pesquisa do Estado de São Paulo (FAPESP) and Conselho Nacional de Desenvolvimento Cientíico e Tecnológico (CNPq) for inancial support and fellowships.
References
1. Hambidge, M.; J. Nutr. 2000, 130, 1344S. 2. Hambidge, M.; J. Nutr. 2003, 133, 948S.
3. Bryan, C. E.; Cristopher, S. J.; Balmer, B. C.; Sci. Total Environ.
2007, 388, 325.
4. Angerer, J.; Eweres, U.; Wilhelm, M.; Int. J. Hyg. Environ. Health2007, 210, 201.
5. Parsons, P. J.; Barbosa, F.; Spectrochim. Acta Part B2007, 62, 992.
6. Christensen, J. M.; Sci. Total. Environ. 1995, 166, 89. 7. Cornelis, R.; Sabbioni, E.; Van der Venne, M. T.; Sci. Total
Environ.1994, 158, 191.
8. Gil, F.; Capitan-Vallvey, L. F.; de Santiago, E.; Ballesta, J.; Pla, A.; Hernadez, A..F.; Gutierrez-Bedmar, M.; Fernadez-Crehuet, J.; Gómez, J.; Lopez-Guarnido, O.; Rodrigo, L.; Villanueva, E.;
Sci. Total Environ.2006,372, 49.
9. Goullé, J. P. M.; Mahieu, L.; Castermant, J.; Neveu, N.; Bonneau, L.; Bouige, D.; Lacroix, C.; Forens. Sci. Intern.2005,
153, 39.
10. Kucera, J.; Bencko, V.; Sabbioni, E.; Van der Venne, M. T.;
Sci. Total Environ. 1995, 166, 211.
11. Minoia, C.; Sabbioni, E.; Apostoli, P.; Pietra, R.; Pozzoli, L.; Gallorini, M.; Nicolaou, G.; Alessio, L.; Capodaglio, E;
Sci. Total Environ. 1990, 95, 89.
12. CDC. Centers for the Disease Control and Prevention. www.cdc.gov/nchs/nhanes.htm, accessed in March, 2009. 13. White, M. A.; Sabbioni, E.; Sci. Total Environ. 1998, 216, 253. 14. Bárány, E.; Bergdahl, I. A.; Bratteby, L. E.; Lundh, T.;
Samuelson, A. G.; Schutz, B. A.; Skerfving, S.; Oskarsson, A.;
Environ. Res.2002, 89, 72.
Table 5. Regression results modeling urine concentrations of elements
by age and gender
Element Regression coeficient
Agea Genderb
Al ns ns
Ba − 0.245* ns
Be ns − 0.176*
Cd ns ns
Co − 0.119* ns
Cs ns − 0.478*
Cu ns ns
Mn ns − 0.387**
Ni ns ns
Pb ns − 0.326*
Pt ns ns
Sb ns ns
Se − 0.502** ns
Sn ns − 0.437**
Tl − 0.478* − 0.246**
U ns ns
a Age represented two groups (< 30 years) and (> 30 years). Concentration
of element in the urine is in natural log units. b Gender represented as 0
15. Malvy, D. J. M.; Arnaud, J.; Burtschy, B.; Richard, M. J.; Favier, A.; Houot, O.; Amedeemanesme, O.; Eur. J. Epidem. 1993; 9, 155.
16. Barbosa, F.; Palmer, C. D.; Krug, F. J; Parsons, P. J.; J. Anal. At. Spectrom. 2004, 19, 1000.
17. Loureiro, V. R.; Saleh, M. A. D; Moraes, P. M.; Neves, R. C. F.; Silva F. A.; Padilha, C. C. F.; Padilha, P. M.; J. Braz. Chem. Soc.2007, 18, 1235.
18. Barbosa, F.; Lima, E. C.; Zanão, R. A.; Krug, F. J.; J. Anal. At. Spectrom. 2001, 16, 842.
19. Parsons, P. J.; Slavin, W.; Spectrochim. Acta Part B1993, 48, 925.
20. Zanão, R. A.; Barbosa, F.; Souza, S. S.; Krug, F. J.; Abdalla, A. L.; Spectrochim. Acta Part B2006, 57, 291.
21. Batista, B. L.; Rodrigues, J. L.; Nunes, J. A.; Tormen, L.; Curtius, A. J.; Barbosa, F.; Talanta2008, 76, 575.
22. Rodrigues, J. L.; Nunes, J. A.; Batista, B. L.; Souza, S. S.; Barbosa, F.; J. Anal. At. Spectrom.2008, 23, 992.
23. Palmer, C. D.; Lewis, M. E.; Geraghty, C. M; Barbosa, F.; Parsons, P. J.; Spectrochim. Acta Part B2006, 61, 980. 24. Thompson, M.; Analyst1998, 123, 405.
25. Spezia, S.; Bocca B.; Forte, G.; Gatti, A.; Mincione, G.; Ronchi A.; Bavazzano, P.; Alimonti, A.; Minoia, C.; Rapid Commun. Mass Spectrom.2005, 19, 1551.
26. Quantifying Uncertainty in Analytical Measurement (2nd ed) EURACHEM/CITAC, 2000.
27. Barbosa, F.; Buzalaf, M. R.; Krug, F. J.; Gerlach, R. F.; Santos, J. E. T., Arch. Tox.2006, 80, 633.
28. Rodushkin, I.; Odman, F.; J. Trace Elem. Med. Biol.2001, 14, 241.
29. Wilhelm, M.; Ewers, U.; Schulz C.; Int. J. Hyg. Environ. Health
2004, 207, 69.
30. Schramel, P.; Wendler, I.; Angerer, J.; Int. J. Hyg. Environ. Health 1997, 69, 219.
31. Paschal, D. C.; Ting, B. G.; Morrow, J. C.; Pirke, J. L.; Jackson, R. J.; Sampson, E. J.; Miller, D. T.; Caldwell K. L.; Environ. Res.1998, 76, 53.
32. Ting, B. G.; Paschal, D. C.; Jarret, J. M.; Pirke, J. L.; Jackson, R. J.; Sampson, E. J.; Miller D. T.; Caudill, S. P.; Environ. Res.
1999, 81, 45.
33. Rodrigues, J. L.; Batista, B. L.; Passos, C. J. S.; Fillion, M.; Mergler, D.; Barbosa, F.; Sci. Total Environ. 2009, 407, 4168. 34. World Health Organization (WHO), Environmental Health
Criteria 58: Selenium, International Program on Chemical Safety, Geneva, 1986, 190 pp.
35. Sartor, F.; Rondia, D.; Claeys, F.; Buchet, J.P.; Ducoffre, G.; Lauwerys, R.; Staessen, J.; Amery, A.; IARC Sci. Publ.1992,
108, 101.
Received: January 8, 2009
Web Release Date: July 31, 2009