vol. 38, n. 4, out./dez., 2002
Saccharin analysis in pharmaceutical and cosmetic preparations by
derivative ultraviolet spectrophotometry
Cristina Duarte Vianna-Soares
1*, Jorge Luiz Seferin Martins
21Departamento de Produtos Farmacêuticos, Faculdade de Farmácia, Universidade Federal de Minas Gerais,
2Departamento de Farmácia, Faculdade de Ciências Farmacêuticas, Universidade de São Paulo
Saccharin, a synthetic sweetener constituent of several pharmaceutical and cosmetic preparations, is analyzed qualitatively and quantitatively in the presence of interferences like active ingredients and excipients. A derivative ultraviolet spectrophotometric method employing the second and the fourth orders was used. The calibration data obtained were satisfactory, with a relative precision range of 0.53%-0.72%, and linearity between 0.9998-0.9999. The recovery test results for the toothgel sample ranged between 97.80% and 104.95% in the second order of derivative and between 98.04% and 101.32% in the fourth derivative, respectively, using zero-peak (ZP) and peak-peak (PP) methods. The suspension sample showed values between 97.35% and 104.72% in the second derivative and between 95.94% to 104.41% in the fourth derivative, respectively, employing the zero-peak (ZP) and zero-peak-zero-peak (PP) methods. The proposed method showed precision, accuracy and simplicity.
*Correspondence:
C.D. Vianna-Soares Faculdade de Farmácia
Universidade Federal de Minas Gerais Av. Olegário Maciel, 2360 30112-180 - Belo Horizonte – MG E-mail: [email protected]
Uniterms: • Saccharin
• Derivative ultraviolet
• spectrophotometry • Toothgel
• Suspension • Zero-peak • Peak-peak
INTRODUCTION
From the scientific and technical standpoint the quality control of excipients implies in the verification of specifications that prove the uniformity of their chemical and physical-chemical characteristics. Nevertheless, technological aspects should also guarantee the quality and safety for the employment of the finished product as a whole, comprising active and inactive ingredients. The excipients, however, considered inert under the thera-peutic point of view, do not always offer the purity criteria necessary to the pharmaceutical and food usage.
Lately in Europe, there has been an increasing interest on the quantitative determination of excipients in the
Saccharin, particularly, an artificial sweetener present in several pharmaceutical preparations, showed us much interest due to the fact that it constitutes an excipient when utilized in small concentrations, and also an active ingredient when utilized in greater concentrations, as in table artificial sweeteners (Vianna-Soares, Martins, 1995). Fahlberg and Remsen (1879) reported the synthesis of saccharin (1,2-benzisothiazol-3(2H)-one 1,1-dioxide) (Fabiani, 1981; Merck, 1996). Even though it was widely investigated concerning to toxicological effects, its consumption enhanced greatly in the European west, mainly during the first and second world wars when the sugar cane was not available. Nowadays, Europeans
con-sume less saccharin per capita than North Americans
(Arnold, 1980).
Studies showed later that saccharin is a non-caloric sweetening agent and a non-cariogenic substance (Brandon, Sadler, 1985; Hill, Flaitz, Frost, 1988) opposed to sucrose, which is generally used in liquid preparations such as syrups, oral solutions, drops, suspensions. Saccharin as sucrose substitute has increased in pharmaceutical dosage forms intended for internal administration like those preparations cited as well as for food and for drink purposes. Last but not least, as mouth cleansing products as mouthwash solutions and denti-frices in the form of pastes or gels, do contain saccharin as excipient. The sweetener is, therefore, present in cosmetic preparations, as these products are classified under the Brazilian legislation.
The sweetener chemical structure is shown in Figure 1. It presents a very low absorptivity, and because it is utilized in very small concentrations as an excipient it becomes very difficult and laborious to determine saccharin in a quantitative way.
In the literature, several reviews have been reported and many methods proposed for the identification and quantitation of saccharin, as follows:
- thin layer chromatography (Auricchio, 1987, 1989;
Guven et al., 1984) and paper chromatography
(Ichibagasse, Kojima, 1962; Mitchell, 1955) were described for qualitative analysis mainly in food, beverages, artificial sweeteners and pharmaceutical preparations; high performance liquid chromatography (Hann, Gilkison, 1987; Leunberger, Gauch, Baumgartner, 1979; Szokolay, 1980) and gas chroma-tography (Kacprzak, 1978; Riggin, Kinzer, 1983) show application in beverages, pharmaceutical preparations and food;
- visible spectrophotometry of saccharin involving the formation of colored compounds at 651 nm (Betalgy, 1974), 630 nm; (Hernandez-Cordoba, Lopez-Garcia, Sanches-Pedreno, 1985), 544 nm (Guven et al., 1984) and 685 nm (Ramappa, Nayak, 1983) are described. Zero order ultraviolet spectrophotometry was applied for saccharin determination at 244 nm (Hussein, Jacin, Rodriguez, 1976) in chewing gums. First order derivative ultraviolet spectrophotometry was applied in nickel electroplating solutions (Fix, Pollack, 1980) and
in artificial sweeteners (Korany, 1983).The second
order derivative ultraviolet spectrophotometry for determination of saccharin was employed in artificial sweeteners (Benfenati, 1989; Paseiro Losada, Simal Lozano, Simal Gándara, 1989).
- other techniques outlined for saccharin determination are volumetry in aqueous solution (British, 1988; Garrat, 1964; Hager, 1950; United, 2002), in non-aqueous solution (British, 1988; Vyas, Kharat, 1988) polarography (Neiman, 1955) and gravimetry (Markus, 1973). However, many of them lack selectivity and sensitivity.
Because saccharin appears in very low concentra-tions in pharmaceutical and cosmetic preparaconcentra-tions and presents a very low absorptivity feature, this brings out a problem for its quantitative analysis in the presence of other excipients and active ingredients, if the method used does not show good precision or specificity.
The proposed method describes the application of derivative ultraviolet spectrophotometry in an oral suspension liquid dosage form and in a cosmetic gel dosage form.
MATERIALS AND METHODS
Chemicals and solutions
Saccharin standard solutions containing 40.0 μg.mL-1 and 50.0 μg.mL-1 were prepared in 0.1 M
FIGURE 1 - Chemical structure of saccharin
(1,2-benzisothiazol-3(2H)-one 1,1-dioxide). Molar mass
sodium hydroxide solution. Other reagents used were 3.0 M hydrochloride acid solution and chloroform:ethanol (9+1). A commercial cosmetic sample, a dentifrice in the form of gel containing sodium saccharin, was purchased in the local commerce. The gel sample showed a label claim of 0.21% w/w saccharin. Also a simulated 2.5% w/v fenitoin oral suspension preparation containing 0.2% w/v sodium saccharin was manufactured in-house and used as a pharmaceutical sample. Its exact placebo formulation, containing no saccharin was also prepared in the same manner.
Apparatus
The ultraviolet/visible BECKMAN DU 70 spectro-photometer with 1cm-quartz cuvettes, attached to the printer EPSON FX/850 were used. The instrument slit width was 2 nm and scan-speed range was 60-2400 nm.min-1. The
THORNTON T-14 water bath and FANEM EXCELSA 3 centrifuge were used as auxiliary instruments.
Methods
The working instrumental conditions were de-scribed in previous work (Vianna-Soares, Martins, 1995) as follows: Two orders of differentiation, second and fourth, were selected; the differential wavelength was 4 nm for the second derivative and 12 nm for the fourth derivative; the scan-speed utilized was 120 nm.min-1 and
the ordinate axis for both orders of differentiation was ± 0.025; the wavelength range was 240.0-320.0 ± 0.5 nm and the noise attenuation employed was 11, as shown in the equipment; the selected modes of measurements were zero-peak (ZP) and peak-peak (PP).
Preparation of the calibration graphs
Standard stock solution was prepared by accurately weighing 100 mg of saccharin and transferring to a 100 mL volumetric flask. Volume was filled up with 0.1 M sodium hydroxide solution. Aliquots of 2.0 mL and 5.0 mL were transferred to a 50 mL and a 100 mL volumetric flask, respectively, to make up analytical diluted standard
concentrations of 40 mg.mL-1 and 50 mg.mL-1 of
saccharin. The former diluted standard solution was used for the spectra overlay with toothgel cosmetic sample, and the later was used for the spectra overlay with the oral suspension pharmaceutical sample.
The utilized derivative spectrophotometric methods were standardized in the concentration interval of 28.0-98.0 mg.mL-1 in 0.1 M sodium hydroxide solution after
verification of the linear range in the zero order spectrophotometry through Ringbom curve in the same solvent solution. The results obtained were statistically analyzed by linear regression, using the least squares method (Davis, Thompson, Pardue, 1978).
Preparation of the cosmetic sample
Accurately weighed equivalent amount of 25 mg saccharin were transferred to a 50 mL volumetric flask, dissolved into distilled water and the solution centrifuged for 20 minutes at a speed of 2500 rpm. A 20.0 mL aliquot was taken from the supernatant, acidified with 2 mL 3.0 M hydrochloric acid and extracted in a separation funnel with 100 mL organic immiscible solvent, chloroform:ethanol (9+1), in 4 portions of 40, 20, 20 and 20 mL. The extracts gathered together were residue dried and dissolved with 10 mL of 0.1 M sodium hydroxide solution into a 25 mL volumetric flask. The volume was completed with distilled water. Aliquots of 1.0 mL were transferred to 10 mL volumetric flasks in 0.1 M sodium hydroxide solution and submitted to derivative ultraviolet spectral analysis. Toothgel sample analytical concentration was 40 mg.mL-1
of saccharin.
Preparation of the pharmaceutical sample
For the pharmaceutical preparation, an aliquot of 15.0 mL was transferred to a 50 mL volumetric flask and the volume completed with distilled water. An aliquot of 15.0 mL of the diluted suspension was extracted in a sepa-ration funnel with 100 mL organic immiscible solvent, which thereafter, was discarded. The aqueous extract was transferred into a 50 mL volumetric flask and the volume completed with 0.1 M sodium hydroxide solution. Further dilution of 3.0 mL to 10 mL volumetric flask was ob-tained. Replicates of this solution, with an analytical con-centration of 48.2 mg.mL-1 were analyzed by derivative
ultraviolet spectrophotometry. Placebo sample was treated for dilution and extraction equivalently.
RESULTS AND DISCUSSION
The standardized linear concentration range, 28.0-98.0 mg.mL-1 in 0.1 M sodium hydroxide solution, found
upon previous derivative fundamentals described by Fell (1978) and Shibatta, Furukawa, Goto (1973).
The relative precision (%RSD) of the standardized method varied between 0.53%-0.72% and linearity (correlation coefficient, r) varied between 0.9998-0.9999 in the concentration interval of 28.0-98.0 mg.mL-1 in 0.1
M sodium hydroxide solution. These values indicate a pretty reasonable and acceptable error, below 2%, as well as a good correlation between the measurement modes of the method and the analyte concentration.
The derivative curve features can be visualized in Figure 2, where zero-peak (ZP) is measured by the peak to baseline amplitude and peak-peak (PP) is measured by
peak to peak amplitude. The ZP and PP methods employed for second order (a) and fourth order (b) quantitative determinations of standard saccharin presented a good correlation for quantitative analysis.
While it is acknowledged that analytical background absorption of pharmaceutical preparations accounts for either the presence of inactive ingredients resulting in great interferences or, high drug absorptivity resulting in overlapping curves, the method was applied in cosmetic and pharmaceutical samples, toothgel and oral suspen-sion, to prove the ability of predicting saccharin determi-nations.
It is important to note that interferences usually caused by other excipients or active ingredients may be partially or totally eliminated with sample pre-treatment or separations. In this study centrifugation at 2500 rpm for 20 minutes, and extraction with immiscible solvent were carried out for the toothgel and the oral suspension samples, respectively, with the purpose of eliminating gross interferences and facilitating the analysis.
Figure 3a demonstrates that the conventional zero order ultraviolet spectra of saccharin (Clarke, 1986) from pre-treated toothgel sample in 0.1 M sodium hydroxide solution is still markedly influenced by the presence of excipients and/or active ingredients. Observing the second (b) and fourth (c) orders of derivatives spectra in Figure 3, one can notice that the background interference is com-pletely eliminated, as we verify the coincident overlay of standard solution (P) and the toothgel sample (A) spectra. Although the placebo sample is not shown along with the spectra due to unavailability from the manufacturer, one can verify that the combined procedure of sample pre-treatment and differentiation is capable of eliminating the high background placebo absorption. The same cannot be stated true for the pre-treatment of the toothgel sample solely.
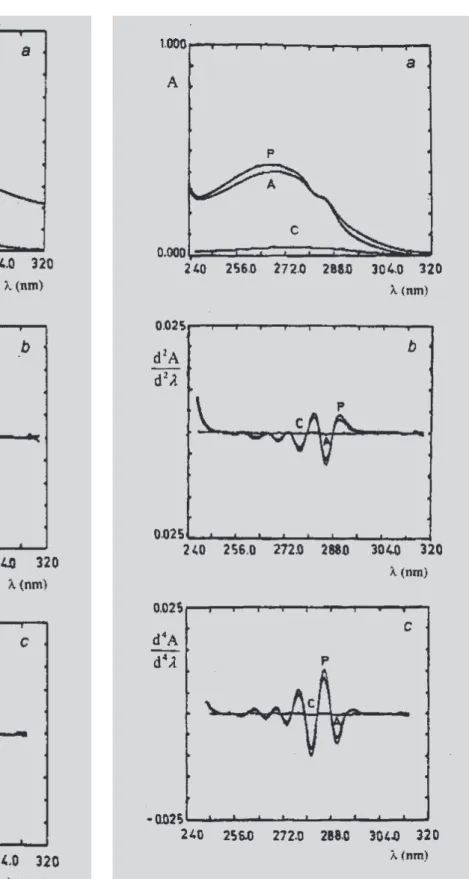
In Figure 4a, the extracted oral suspension sample (A) already shows a great elimination of background absorption compared to the absorption obtained with the suspension simple dilution only (results not shown), however, the placebo sample (C) still biases the analysis with a low absorption even after the extraction procedure. In Figure 4b and c, the spectra differentiation leads to the evident elimination of placebo interference as it is observed from the flat baselines achieved. Despite that, the exact superimposition of the standard (P) and oral suspension sample (A) solutions in the differentiated spectra does not occur due to the lower saccharin concentration in the oral suspension sample (A), compared to saccharin concentration in the standard solution (P). The suspension dosage form itself imposes
FIGURE 2 - Second (a) and fourth (b) derivative
FIGURE 3 - Zero (a), second (b) and fourth (c) derivative ultraviolet spectra of toothgel sample (A) and standard saccharin solution (P), in 0.1 M sodium hydroxide solution at concentration of 40.0 μg.mL-1.
FIGURE 4 - Zero (a), second (b) and fourth (c) derivative ultraviolet spectra of oral suspension sample (A) at a concentration of 48.2 mg.mL-1, standard saccharin solution
at concentration of 50.0 μg.mL-1 (P) and suspension
non-coincidental analytical concentration in the process, meanwhile, the same does not happen with saccharin standard solution, readily prepared from a solid reagent. The method however is precise, showing coeffi-cients of variation (%CV) in an acceptable range. Appli-cation of the second derivative method to the samples re-sulted in satisfactorily precise values of coefficients of variation. The zero-peak and the peak-peak methods pre-sented a precision of 1.60% and 1.22% for toothgel and, 1.39% and 1.57% for the oral suspension respectively. Fourth derivative method yielded coefficients of variation of 0.97% and 0.69% for toothgel, 0.92% and 1.00% for oral suspension, for the zero-peak and peak-peak methods respectively. Precision results were calculated using ten duplicate determinations of the sample solutions around the central point (50.0 mg.mL-1) of the linear interval.
The recovery results (Table I) were obtained according to the methods of standards addition (AOAC, 1990). They ranged from 97.80% to 104.95% in the second derivative and from 98.04% to 101.32% in the fourth derivative, respectively, for zero-peak and peak-peak methods in the toothgel sample. In the oral suspension
sample the recovery values ranged from 97.35% to 104.72% in the second derivative and from 95.94% to 104.41% in the fourth derivative, respectively, for zero-peak and zero-peak-zero-peak methods. The method accuracy was considered to be satisfactory as the values fell in between 95.0-105.0% of the spiked amount in the samples.
CONCLUSIONS
Saccharin can easily be quantitatively determined in pharmaceutical and cosmetic preparations in presence of excipients and active ingredients, by precise and accurate second or fourth order derivative ultraviolet spectro-photometry.
The derivative ultraviolet method may also be useful for saccharin determination in foods when necessary suitable pre-treatment, if required, is executed to help eliminate or diminish gross interferences.
The feasible application of derivative spectropho-tometry characterizes this method as a quick performance, due to the easy maneuverability and the low cost of reagents involved. It also constitutes a simple, useful and
TABLE I - Percentage recovery results* for commercial toothgel and simulated oral suspension samples
SECOND DERIVATIVE
Sample Added (µg.mL-1) Found (µg.mL-1) Recovery %
ZP PP ZP PP
8.0 7.93 8.34 99.17 104.28
Toothgel 16.0 16.53 16.68 103.31 104.28
24.0 23.47 24.17 97.80 100.71
32.0 32.73 33.58 102.27 104.95
5.0 4.88 4.87 97.68 97.35
Oral 10.0 10.46 10.39 104.60 103.98
Suspension 15.0 15.34 15.71 102.28 104.72
20.0 20.92 20.80 104.60 103.98
FOURTH DERIVATIVE
ZP PP ZP PP
8.0 7.99 7.86 99.99 98.25
Toothgel 16.0 15.99 16.14 99.99 100.88
24.0 23.53 24.14 98.04 100.58
32.0 31.99 32.42 99.99 101.32
5.0 4.88 5.15 97.56 102.94
Oral 10.0 9.76 10.44 97.56 104.41
Suspension 15.0 14.39 15.59 95.94 103.92
20.0 20.00 20.74 100.00 103.68
suitable method for saccharin routine quality control in cosmetic and pharmaceutical preparations, compared to more sophisticated techniques such as high performance liquid chromatography or gas chromatography.
ACKNOWLEDGMENTS
This work was possible with a CAPES/Brasilia/Bra-sil fellowship. The authors thank Colgate-Palmolive (Osasco/Brasil) for the kind donation of the toothgel samples.
RESUMO
Análise da sacarina em preparações farmacêuticas e cosméticas por meio da espectrofotometria derivada
no ultravioleta
A sacarina, adoçante sintético constituinte de várias pre-parações farmacêuticas e cosméticas, foi analisada de forma qualitativa e quantitativa na presença de substân-cias interferentes como princípios ativos e excipientes das formulações. Utilizou-se a espectrofotometria derivada no ultravioleta, por meio da segunda e da quarta ordens de diferenciação. Os resultados obtidos na padronização do método foram satisfatórios e mostraram precisão no intervalo de 0,53%-0,72%, e linearidade entre 0,9998-0,9999. O teste de recuperação, aplicado na amostra gel dental situou entre 97,80% e 104,95%, para a segunda ordem, e entre 98,04% e 101,32%, para a quarta ordem de diferenciação, respectivamente, empregando os métodos zero-pico (ZP) and pico-pico (PP). A amostra suspensão oral mostrou valores entre 97,35% e 104,72%, para a segunda ordem, e valores entre 95,94% e 104,41%, para a quarta ordem de diferenciação, respectivamente, empre-gando os métodos zero-pico (ZP) and pico-pico (PP). O método proposto mostrou ser preciso, simples e exato.
UNITERMOS. Sacarina. Espectrofotometria derivada no ultravioleta. Gel dental. Suspensão. Zero-pico. Pico-pico.
REFERENCES
ARNOLD, D. L. et al. Long-term toxicity of
o-toluenesulfonamide and sodium saccharin in the rat.
Toxicol.Appl. Pharmacol., New York, v.52, p.113-151, 1980.
ASSOCIATION of official analytical chemists. Official methods of analysis. 15 ed. Arlington: AOAC, 1990. v. 1, p. XVII.
AURICCHIO, M. T. et al. Pesquisa de adoçantes não
calóricos sintéticos em adoçante natural de Stevia rebaudiana (Bert) Bertoni. Rev. Bras. Farmacogn., São Paulo, v.2-4, p.53-61, 1987-1989.
BENFENATI, L. et al. Dosaggio spettrofotometrico in
derivata seconda in prodotti farmaceutici, dietitici e cosmetici. Boll. Chim. Farm., Milano, v.128, p.18-21, 1989.
BETALGY, Y. A., RIDA, S. M., ISSA, A. Colorimetric determination of probenecid, saccharin, penicillins and some indicators using methylen blue. Pharmazie, Berlin, v.29, p.64-65, 1974.
BRANDON, M., SADLER, E. B. Sugar-free medicines.
Pharm. J., London, v.234, p.824, 1985.
BRITISH pharmacopeia London: Her Majesty’s Stationery Office, 1988. p.495-496.
CLARKE’S isolation and identification of drugs. 2.ed. London: Pharmaceutical Press, 1986. p.963.
DAVIS, R. B., THOMPSON, J. E., PARDUE, H. L. Characteristics of statistical parameters used to interpret least-squares results. Clin. Chem., Winston-Salem, v.24, p.611-20., 1978.
FABIANI, P. Édulcorants de synthese: saccharine et dulcine - donnés chimiques et toxicologiques. Ann. Falsif. Expert. Chim., Paris, v.74, p.273-283, 1981.
FAHLBERG, C., REMSEN, I. Uber die oxydation des orthotoluolsulfamids. Ber. Dtsch. Chem. Ges., Berlin, v.12, p.469-473, 1879.
FELL, A. F. Analysis of pharmaceutical dosage forms by second derivative ultraviolet-visible spectrophotometry.
Proc. Anal. Div. Chem. Soc., London, v.15, p.260-267, 1978.
FIX, G. L., POLLACK, J. D. Determination of saccharin in watts nickel plating solutions by first derivative ultraviolet spectrometry. Anal. Chem., Washington, v.52, p.1589-1592, 1980.
GUVEN, K. C., OZOL, T, EKIZ, N., GUNERI, T. Spectrophotometric determination of sodium cyclamate and saccharin sodium with astrazone pink FG. Analyst, London, v.109, p.969-970, 1984.
HAGER, H. H. J. Tratado de farmácia prática. 3.ed.
Barcelona: Editorial Labor, 1950. p.203-205.
HANN, J. T., GILKISON, I. T. Gradient liquid chromatographic method for the simultaneous determination of sweeteners, preservatives and colours in soft drinks. J. Chromatogr., Amsterdam, v.395, p.317-322, 1987.
HERNANDEZ-CORDOBA, M., LOPEZ-GARCIA, I., SANCHES-PEDRENO, C. Spectrophotometric determination of saccharin in different materials by a solvent extraction method using nile blue as reagent.
Talanta, London, v.32, p.325-327, 1985.
HILL, E. M., FLAITZ, C. M., FROST,. G. R. Sweetener content of common pediatric oral liquid medications. Am. J. Hosp. Pharm., Washington, v.45, p.135-142, 1988.
ICHIBAGASSE, H., KOJIMA, S. Studies on synthetic sweetening agents. I - Paper chromatography of cyclamate sodium, dulcin and saccharin sodium.
Yakugaku Zashi, Tokyo, v.82, p.616-620, 1962.
HUSSEIN, M. M., JACIN, H., RODRIGUEZ, F. B. Quantitative determination of saccharin in food products by ultraviolet spectrophotometry. J. Agric. Food Chem., Washington, v.24, p.36-40, 1976.
KACPRZAK, J. L. Determination of o-toluenesulfonamide in artificial sweeteners containing saccharin. J. Assoc. Off. Anal. Chem., Washington, v.61, p.1528-1532, 1978.
KORANY, M. A. et al. Application of first derivative spectrophotometry to the determination of certain drugs in single component dosage forms. Farmaco Ed. Prat., Pavia, v.39, p.243-252, 1983.
LEUNBERGER, U., GAUCH, R., BAUMGARTNER, E. Determination of food preservatives and saccharin by
high performance liquid chromatography. J.
Chromatogr., Amsterdam, v.173, p.343-348, 1979.
MARKUS, J. R. Gravimetric determination of saccharin in cider. J. Assoc. Off. Anal. Chem., Washington, v.56, p.162-163, 1973.
MERCK index. 12.ed. Rahway: Merck, 1996. p.1430.
MITCHELL, L. C. Separation and identification of cyclohexylsulfamate, dulcin, and saccharin by paper
chromatography. J. Assoc. Off. Agric. Chem.,
Washington, v.38, p.943-947, 1955.
NEIMAN, M. B. Polarographic determination of saccharin.
J. Anal. Chem. USSR Engl. Transl., New York, v.10, p.163-167, 1955.
PASEIRO LOSADA, P., SIMAL LOZANO, J., SIMAL GÁNDARA, J. Determinación de sacarina mediante espectrofotometria UV en productos dietéticos y antiobesidad. An. Bromatol., Madrid. v.41, p.177-188, 1989.
RAMAPPA, P. G., NAYAK, A. N. Rapid spectrophotometric determination of saccharin in soft drinks and pharmaceuticals using azure B as reagent. Analyst, London, v.108, p.966-970, 1983.
RIGGIN, R. M., KINZER, G. W. Characterization of impurities in commercial lots of sodium saccharin produced by Sherwin-Williams process. I. Chemistry.
Food Chem. Toxicol., Oxford, v.21, p.11-17, 1983.
SHIBATTA, S., FURUKAWA, M., GOTO, K. Dual-wavelength spectrophotometry; qualitative and quantitative analysis by means of first-derivative spectra.
Anal. Chim. Acta, Amsterdam, v.65, p.49-58, 1973.
SZOKOLAY, A. M. High performance liquid chromatographic determination of impurities in
commercial saccharin. J. Chromatogr., Amsterdam,
v.187, p.249-254, 1980.
UNITED states pharmacopeia. 25.ed. Rockville: United States Pharmacopeial Convention, 2002. p.1545, 2610.
VIANNA-SOARES, C. D., MARTINS, J. L. S. Derivative ultraviolet spectrophotometric determination of saccharin in artificial sweeteners. Analyst, London, v.120, p.193-195, 1995.
VYAS, P. N., KHARAT, R. B. Conductimetric and enthalpimetric determination of saccharin in acetone. J. Indian Chem. Soc., Calcutta,v.65, p.885-886, 1988.