Effects of urbanization on Neotropical wasp and bee
assemblages in a Brazilian metropolis
L.R.S. Zanette
a,∗, R.P. Martins
a, S.P. Ribeiro
baLaboratorio de Ecologia e Comportamanto de Insetos, ICB, Universidade Federal de Minas Gerias Caixa Postal 486, 30161-970 Belo Horizonte, MG, Brazil
bDepartamento de Ciˆencias Biológicas/ICEB, Universidade Federal de Ouro Preto 35400-000 Ouro Preto/MG, Brazil
Received 23 May 2002; received in revised form 30 May 2003; accepted 18 February 2004
Abstract
The rapid growth of cities in many parts of the world has stimulated an increasing number of ecological studies of urban environments. Here, 12 study sites in the city of Belo Horizonte (MG), southeastern Brazil, were compared to analyze the effects of habitat changes related to urbanization on the species richness and abundance of native wasps and bees. Two spatial scales were considered: large portions of the urban landscape (entire sites) and small areas within these sites (public squares). Overall, the abundance of advanced eusocial bees (i.e. stingless bees), which were the dominant species, was directly affected by the loss of vegetation cover and the increase of buildings associated with urbanization. The magnitude of this effect varied according to the nesting habits of each species. The loss of vegetation cover associated with urbanization also had a negative effect on the abundance and species richness of advanced eusocial wasps. Generalist species of bees and wasps, such as
Trigona spinipesandPolybia occidentalis, were very abundant and not sensitive to the habitat changes related to urbanization. Advanced eusocial bees also responded to small-scale habitat changes (size and vegetation cover of public squares). No relation was found between the solitary and the primitive eusocial wasps and bees and the habitat changes considered here. Conservation strategies in urban environments need to consider different spatial scales in order to maintain or enhance the local diversity of wasps and bees.
© 2004 Elsevier B.V. All rights reserved.
Keywords:Aculeata; Stingless bees; Habitat structure; Public squares
1. Introduction
Urban environments are generally characterized as areas with a high density of buildings exposed to constant and intense human activity (McIntyre et al., 2001). Urbanization, the process by which these
∗Corresponding author. Present address: Department of Biology,
University College London, Wolfson House, 4 Stephenson Way, London NW1 2HE, UK.
E-mail address:[email protected] (L.R.S. Zanette).
environments are generated, can be summarized as a local increase in the density of inhabitants coupled with increased per capita energy consumption and extensive modifications of the environment (includ-ing the microclimate) (Gilbert, 1991; Vitousek et al., 1997). This process generates unstable ecosystems that depend on large inputs of energy, and where great amounts of waste materials are accumulated (Stearns, 1970; McDonnell and Pickett, 1990). Despite cov-ering a small fraction of the Earth’s surface (<5%), urban environments have a widespread influence
on surrounding ecosystems (Vitousek et al., 1997; Goudie, 2000). Half of the world’s population cur-rently lives in urban areas. This proportion is expected to increase to 60% in the year 2030 (United Nations, 1999). In Brazil, approximately 55% of the population was living in cities in 1970. Today, almost 80% of the population is living in urban areas (IBGE, 2001). This fast growth of cities is promoting an increasing interest in urban ecosystems and in the impact of ur-banization on distinct biotas (Gilbert, 1991; Rebele, 1994; Grimm, 1997; Vitousek et al., 1997). Ecologi-cal studies of such ecosystems are essential to reduce local and regional impacts of urbanization (Gilbert, 1991; Bedˆe et al., 1997; Niemelä, 1999).
Different approaches have been used to study the fauna of urban environments (Moore, 1979; McDonnell and Pickett, 1990; Niemelä, 1999). The theory of island biogeography, for instance, has been the foundation for many studies of insect and bird rich-ness in “urban islands” (e.g. parks and public squares) (reviews inDavis and Glick, 1978; McIntyre, 2000). Despite being spatially heterogeneous, urban envi-ronments are structurally well defined (Turner, 1989). Generally, each part (or structural component) of the urban landscape presents clear limits (Wiens et al., 1993; Grimm, 1997). Public squares, for example, are well-defined habitat portions surrounded by a matrix of buildings equally well defined. Although “urban islands” may be easily perceived, this biogeographic approach has some limitations since the permeability of the urban matrix may be highly variable (Niemelä, 1999). Species with great dispersal ability, for exam-ple, may pass through the matrix; consequently they can use a portion of the urban habitat larger than a specific “island”. For these reasons different spatial scales have to be analyzed to study the effects of ur-banization on a particular group of species (Hostetler, 1999). Additionally, it has to be considered that ur-banization is a scale-dependent process. Urban plan-ning and development are done in an hierarchical way (“from the mayor to the gardener”), and consequently, the effects of urbanization can not be fully appreciated by considering only one spatial scale (Savard et al., 2000).
Despite the ubiquity of insects, there are few studies especially concerned with the effects of urbanization on non-pest species, particularly in the Neotropical region (Laroca et al., 1982; Davis, 1982; Ruszczyk
1986a,b,c,d, 1996; Diefenbach and Becker, 1992; McIntyre, 2000). Earlier studies found a relatively high insect diversity in some cities (e.g. London and Rome), suggesting that these habitats may not be as restrictive as expected (Owen and Owen, 1975; Zapparoli, 1997). In addition, it has been observed that species richness and abundance can greatly vary within each city, indicating that different levels of urbanization have distinct effects on the local insect fauna (Owen and Owen, 1975; Frankie and Koehler, 1978; Zapparoli, 1997; McIntyre, 2000; McIntyre et al., 2001).
Information about the responses of wasps and bees to urbanization is important for a number of reasons. Many wasp species, especially the euso-cial ones, are key predators in tropical ecosystems (LaSalle and Gauld, 1993; Raw, 1998b). Bees are the most important pollinators of angiosperms and con-sequently they are also key species in many terrestrial ecosystems (Neff and Simpson, 1993). Wasps and bees are sensitive to variations in abiotic conditions (e.g. temperature, luminosity and moisture), which may be related to changes in the urbanization level (Genise, 1981; Roubik, 1992; Morgan and Jeanne, 1992). In addition, wasps and bees are frequently found in urban environments, efficiently occupying different microhabitats (e.g. walls, roofs, ceilings, etc.) (Nogueira-Neto, 1970; Fowler, 1983; Martins and Pimenta, 1993; Knoll et al., 1994; West-Eberhard et al., 1995; Saure, 1996; Raw, 1998a). Despite their ecological importance and their potential as indica-tors of environmental conditions (Brown, 1991), few authors have analyzed the effects of urbanization on wasp and bee assemblages. The literature suggests considerable variation in the responses of these in-sects to urbanization (Skibinska, 1986; Gayubo et al., 1987; Gayubo and Torres, 1989, 1990, 1991; Torres and Gayubo, 1989; Saure, 1996). In Brazil, previous studies restricted to bees have found a great variation in species sensitivity to urbanization and a consider-able reduction of diversity in highly urbanized areas (Laroca et al., 1982; Bortoli and Laroca, 1997; Knoll et al., 1994).
predicted that less urbanized areas support a greater abundance and species richness of wasps and bees. Our main objective in this paper is to examine these predictions. Additionally, we have attempted to ana-lyze the effects of urbanization at a smaller spatial scale, focusing on the microhabitats of public squares. Based on island biogeography theory, it was assumed that public squares surrounded by an urbanized ma-trix could be considered islands with different lev-els of isolation according to the structural complex-ity of their surroundings. Hence, the following predic-tions were also examined: (1) larger squares support a higher abundance and richness of wasps and bees, and (2) squares with more complex surroundings support a higher abundance and richness of wasps and bees.
2. Material and methods
2.1. Study area
Two regions of the city of Belo Horizonte (19◦52′S,
43◦58′W) in the state of Minas Gerais, southeastern
Brazil were considered in the present study. Founded in 1897, Belo Horizonte was especially planned to be the capital of the state. Today the metropolitan area covers an area of approximately 330.9 km2 and has 6746.79 inhabitants per km2 (IBGE, 2001). In the 1980s, Belo Horizonte was considered to be the fastest growing capital in Brazil (da Silva, 1998). The two regions selected within the city have distinct urbaniza-tion histories. The Centro-Sul region is the oldest part of Belo Horizonte and has been intensively urbanized since the foundation of the capital. Although buildings predominate in the region, mature plant communities can still be found in intensively managed gardens of some old houses and institutional buildings. The ur-ban development of the Pampulha region began in the 1940s, with the creation of the Oscar Niemeyr’s Pam-pulha Complex by the side of an artificial lake, and since then has never stopped (da Silva, 1998). Sev-eral patches of native vegetation can still be found in the region, particularly in vacant lots and some large private gardens subject to infrequent management.
A combination of demographic and socio-economic data were used to selected three areas with different levels of urbanization within the two regions of Belo Horizonte (seeHostetler, 1999; McIntyre et al., 2000):
• L (West Pampulha): low level of urbanization (9.6 inhabitants per hectare and less than one non-residential building per hectare);
• M (East Pampulha): medium level of urban-ization (48.7 inhabitants per hectare and eight non-residential buildings per hectare);
• H (Centro): high level of urbanization (98 inhab-itants per hectare and 48 non-residential buildings per hectare).
Twelve sites were randomly selected for insect sam-pling: four in the L area, three in the M area and five in the H area. In each site one public square and two adjacent streets were sampled. These public squares are intensively managed public gardens of exotic and native ornamental plants. Since each square has a par-ticular structure they provide an ideal situation to an-alyze the effects of small-scale habitat changes.
2.2. Characterization of the sites
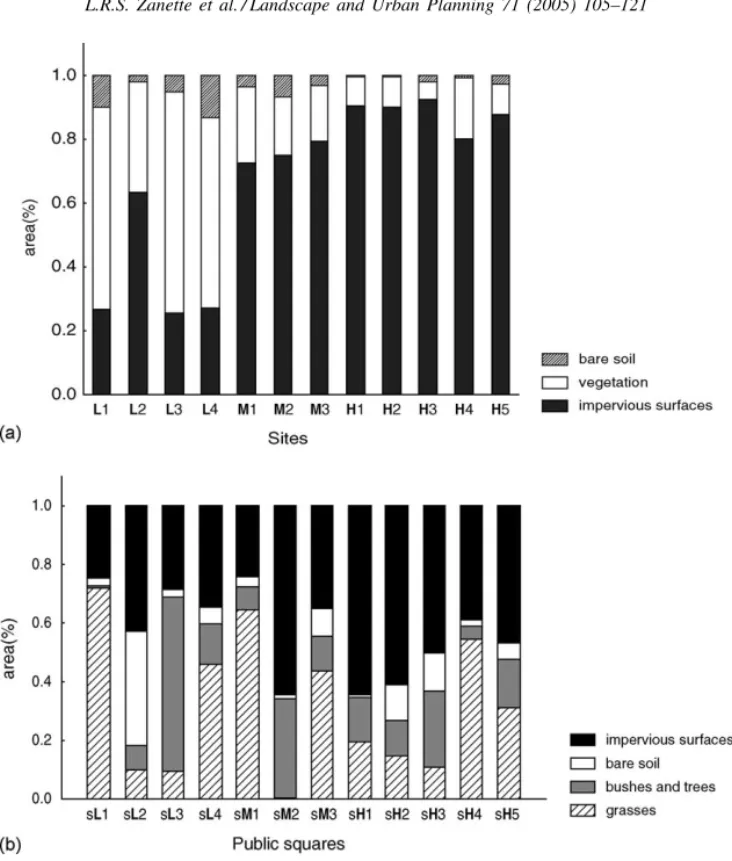
Aerial photographs of the city of Belo Horizonte (scale 1:1000; source Prodabel, 2001) were used to quantify the habitat features of the twelve study sites. For each site, twelve photos were analyzed, each photo corresponding to an area of approximately 15,000 m2. Each photo was analyzed using a grid of 560 square cells (each cell corresponding to 26 m2). Each cell was classified according to the type of ground cov-erage, in one of the following categories: (1) vegeta-tion; (2) buildings or pavements (impervious surfaces) or (3) bare soil (Fig. 1). The last category was in-cluded because it is an important habitat feature for ground-nesting wasps and bees (Michener et al., 1958; Brockmann, 1979). The number of cells in each class was used to estimate the percentages of vegetation cover, impervious surfaces and bare soil at each site (seeRuszczyk, 1986c; Turner, 1998). The coefficient of variation (CV) of the number of cells in each class for each site (i.e. the variation within each set of 12 photos) was used as a simplified measure of spatial variation for the three land cover types.
Fig. 1. Proportion of ground-cover classes measured for each site (a) and for each square (b). Capital letters indicate the urbanization level (low, medium or high) of the area where the site and the squares are located.
measured directly from a map of the city of Belo Hor-izonte (source:Prodabel, 1997; scale 1:5000).
2.3. Characterization of the public squares
The plant species found in each square were iden-tified in loco, with the supervision of botanists of the Belo Horizonte County Public Parks and Gardens De-partment, and thus the total richness of plant species in each public square was obtained.
Plant volume of herbs and shrubs (excluding grasses) was used as an estimate of live non-arboreal plant biomass. Volume was estimated using the height and the perimeter of each plant, which were mea-sured using a metric strip and a compass. Perimeter
measures were used to estimate the area occupied by each plant species using the program AutoCAD14.0. Considering that most plants in the squares were constantly managed, their forms were mostly regular (generally cubic or cylindrical); therefore, they could be easily measured. The coefficient of variation for the plant volumes was used as an estimate of the spa-tial heterogeneity of the non-arboreal plants in each square. The same method used to estimate the area occupied by each plant species was used to estimate the area of bare soil in each square.
diam-eter at chest height (Bonham, 1989). The coefficient of variation of the trunk volumes was used as an indi-rect measure of the spatial heterogeneity of the trees in each square.
The total area and the percentage of each ground cover type in each square were also measured with the program AutoCAD 14.0, using digitized maps of each square (source Prodabel, 2000; scale 1: 2000) (Fig. 1).
2.4. Sampling of wasps and bees
Samples were collected intensively within a short period of time to minimize possible effects of cli-matic variations. Samples were taken on sunny days between 2 April 2000 and 23 July 2000, from 9 a.m. to 4 p.m., the period of more intense activity for most wasp and bee species (Sakagami et al., 1967; Roubik, 1992; Macedo and Martins, 1999; Williams et al., 2001). During each sampling day, three sites were sampled (i.e. three squares and six streets) with an in-terval of 15–20 min between each place. In total, all sites were sampled 12 times (four times in each of the following periods: 9 a.m.–11 a.m.; 11 a.m.–2 p.m.; 2 p.m.–4 p.m.). The sampling schedule for each day was planned using a table of random numbers.
Native wasps and bees seen flying, or on plants, up to a maximum height of 4 m were collected using an entomological hand net. The total area of each square was covered once. In the surrounding streets, the side-walks were sampled once within a 300 m radius from the center of the square. To avoid over sampling a par-ticular place, the maximum time spent at each point (e.g. flowering plant) was 3 min (seeSakagami et al., 1967; Heithaus, 1979). Collected wasps and bees were identified and placed in the entomological reference collection of theLaboratorio de Ecologia e
Compor-tamento de Insetos of the Universidade Federal de
Minas Gerais.
2.5. Data analysis
The occurrence of forager recruitment on the ad-vanced eusocial species of bees and the large number of individuals found in the colonies of advanced euso-cial wasps and bees may greatly increase the chances of capturing these insects using the method described above (Laroca et al., 1982). For this reason, the sub-sequent analyses were done considering two basic
groups: advanced eusocial species and non-advanced eusocial species.
A Jackknife procedure was needed to estimate the species richness, as the number of sampled insects was not very large (Heltshe and Forrester, 1985; Palmer, 1990). The number of species collected each day in each site was used as a value for the Jackknife proce-dure. Confidence limits (at 95%) were calculated for each mean value of richness estimated to allow further comparisons between sites (Zar, 1999).
A Canonical Discriminant Analysis (CDA) was used to test whether the 12 study sites previously separated in groups according to their urbanization level, could also be differentiated using the measured habitat features for each site (Huberty, 1994; Jongman et al., 1995). CDA was also used to test wheter these groups could be separated using the abundance of the species collected at each site. In the latter CDA, locally rare species, which occurred in less than 20% of the sampled places, were not considered (90% of these species were found three times or less).
A simple linear regression between the significant canonical roots extracted in the previously described CDAs was used to test if the abundance of wasps and bees was affected by the habitat changes related to ur-banization. Another simple linear regression between the estimated values of species richness and the signif-icant discriminant root obtained with the habitat fea-tures, was used to test if the richness of wasps and bees was affected by the habitat changes related to ur-banization.
were considered (together representing 90% or more of the total variance in the data) (Valentin, 2000).
In all the analyses percent land-cover values were arcsine transformed and area, distance and abundance values were log transformed (Krebs, 1999).
3. Results
3.1. Abundance and species richness of wasps and bees
Overall, 6268 individuals from 110 species, belong-ing to eleven families in the order Hymenoptera were captured (Figs. 2 and 3). The most abundant families were Apidae (n = 5150) and Vespidae (n = 794). Sixty-nine species were found in the less urbanized area (L), 47 in the area with an intermediate level of urbanization (M) and 56 in the highly urbanized area (H). Only three species were found in all sites, and 58 species were collected in only one site.
A total of 5368 bees from 69 species were captured. Advanced eusocial species were clearly dominant. Ap-proximately 96% of all captured bees (n=5150) were from the family Apidae, 93% (n=4809) of these be-longing to the sub-tribe Meliponina (stingless bees).
Number of species
0 5 10 15 20 25 30 35 40 45
Apidae
Vespidae Halictidae
Crabronidae Colletidae
Pemphredonidae
Andrenidae
Megachilidae
Nyssonidae Astatidae
Philantidae
Fig. 2. Species richness observed for each Hymenoptera family collected.
The most abundant species wereNannotrigona
tes-taceicornis(Lepeletier) and Trigona spinipes
(Fabri-cius) (n=1469 and 1336, 28 and 26% of all Apidae respectively). OnlyTrigona spinipesandTetragonisca
angustula (Latreille) were found in all twelve sites,
Sites
Number of individual
s
Number of specie
s
0 8 16 24 32 40
0 200 400 600 800 1000 1200 1400
L1 L2 L3 L4 M1 M2 M3 H1 H2 H3 H4 H5
Fig. 3. Total abundance (black bars) and species richness (white bars) of wasps and bees observed in each site (total number of individuals=6268. Total number of species=110).
Additionally, 106 solitary wasps from 20 species were captured. Sixty-three belonged to the family Crabronidae, 29 to Pemphredonidae, 12 to Nys-sonidae, 1 to Astatidae and 1 to Philantidae. Liris
sp. was the most abundant species (n= 41; 39% of all solitary wasps), although this group may repre-sent more than one species. No solitary species was captured in all sites and thirteen species were found in only one site. Eleven species were found in the less urbanized area (L), 6 in the area with an inter-mediate level of urbanization and 10 in the highly urbanized area. The observed richness values varied from 1 (sites L1, M2 and H3) to 6 (sites L4 and H1) (Fig. 5b).
3.2. Effects of urbanization
The first canonical root obtained in the CDA of the measured habitat features was significant (eigenvalue = 15.573, χ212 = 25.303, P < 0.013). The habitat features (variables) most strongly cor-related with the first root were the percentage of vegetation cover (r = 0.618) and the percentage of pavement/building cover (r= −0.587) (Table 1). The ordination of the twelve study sites using the first two canonical roots shows an evident separation be-tween the sites in the less urbanized area (L) and the remaining sites (in M and H) (Fig. 6).
No significant roots were obtained when using the abundance data of the non-advanced eusocial species. When considering only the abundances of advanced eusocial bee species, one significant discriminant root was obtained (eigenvalue = 16.639, χ214 = 23.746, P < 0.049). The abundance of Nannotrigona
testa-ceicornis(Lepeletier) was the variable most strongly
correlated with that root (r=0.846) (Table 2). The or-dination of the 12 sites using the first two discriminant axes clearly showed a separation between the sites in the less urbanized area and the others when consider-ing their relative position in the first axis (Fig. 7).
A significant negative relationship was found be-tween the first discriminant root obtained with the habitat features data and the first root obtained with the
Table 1
Correlation between habitat features measured at each site and the two canonical discriminant roots
Habitat featuresa Root 1 Root 2
Percentage of pavements/buildings −0.587 0.587 Percentage of vegetation cover 0.618 −0.559 Distance to large green areas −0.326 −0.003 Variation in the percentage of
pavements/buildings
0.296 −0.206 Variation in the percentage of
vegetation cover
−0.260 0.291
Variation in the percentage of bare soil −0.145 0.570 aThe percentage of bare soil was removed from this analysis
Sites
Number of specie
s
0 4 8 12 16 20
L1 L2 L3 L4 M1 M2 M3 H1 H2 H3 H4 H5
Sites
Number of specie
s
0 6 12 18 24 30 36 42 48
L1 L2 L3 L4 M1 M2 M3 H1 H2 H3 H4 H5
(b) (a)
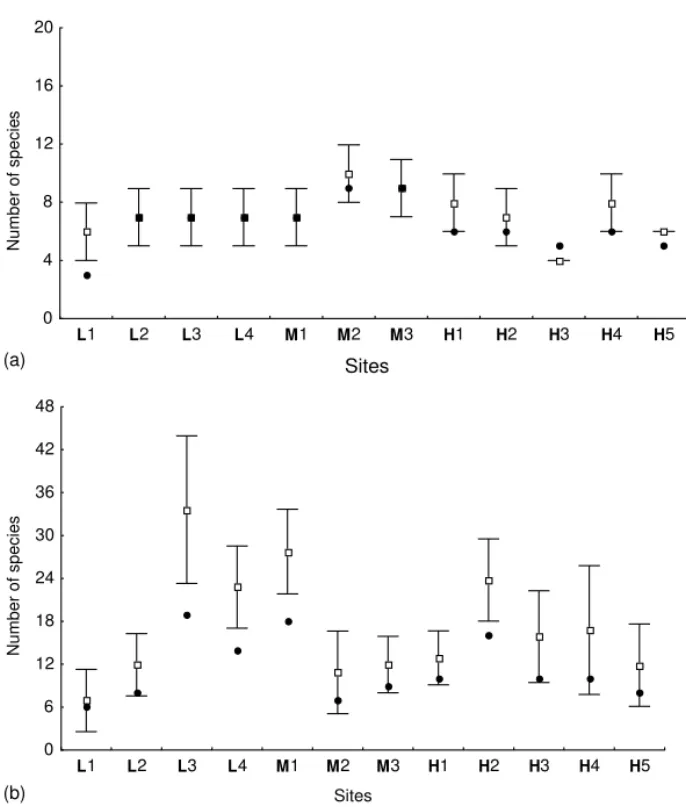
Fig. 4. Plots of estimated species richness of bees (means and 95% confidence limits). Black dots indicate the observed number of species. (a) Advanced eusocial species (i.e. stingless bees). (b) Non-advanced eusocial species. Capital letters indicate the urbanization level of each area (low, medium or high).
abundances of advanced eusocial bees (β = −0.938, r2=0.881,P <0.000) (Fig. 8).
To avoid possible distortions of the results of the CDAs caused by spatial autocorrelation (as defined
Table 2
Correlations between the abundances of species of advanced eu-social bee and the two canonical discriminant roots
Species Root 1 Root 2
Geotrigona subterranea −0.150 −0.437
Nannotrigona testaceicornis 0.846 0.160
Paratrigona lineata −0.100 0.208
Plebeia droryana 0.221 −0.204
Tetragonisca angustula 0.015 0.195
Trigona hyalinata −0.043 −0.551
Trigona spinipes 0.043 −0.272
byLegendre and Legendre, 1998) between the sites in each urbanization group, each CDA was performed several times, subsequently removing one of the sites in each group. The results were considered valid only when the significance of the roots and the order of magnitude and signs of the correlations between vari-ables and discriminant roots were preserved (Manly, 1994).
Sites
Number of specie
s
0 4 8 12 16 20 24 28
L1 L2 L3 L4 M1 M2 M3 H1 H2 H3 H4 H5
Sites
N
u
mber of specie
s
0 4 8 12 16 20 24 28
L1 L2 L3 L4 M1 M2 M3 H1 H2 H3 H4 H5 (a)
(b)
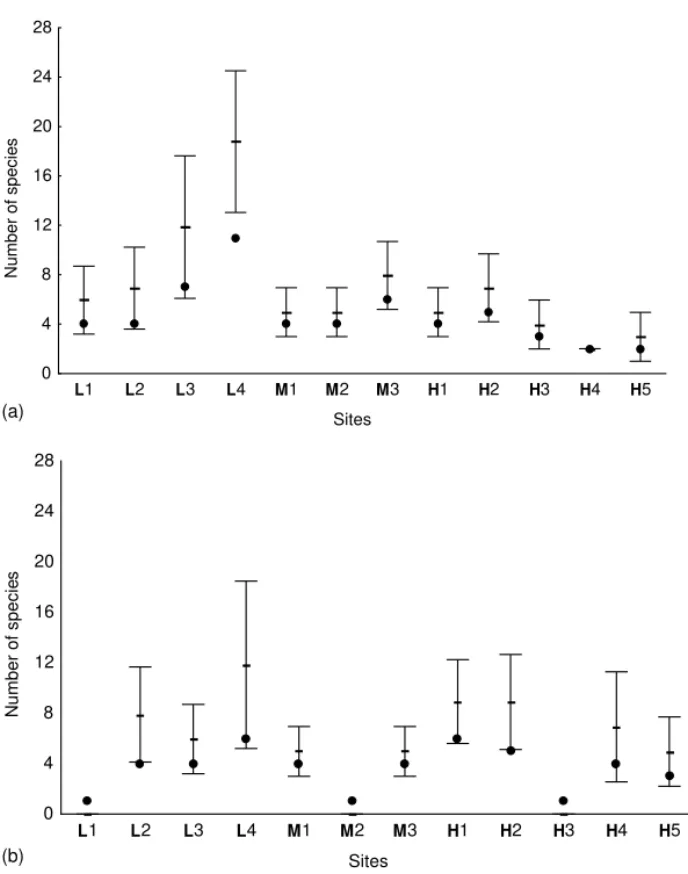
Fig. 5. Plots of estimated species richness of wasps (mean values and 95% confidence limits). Black dots indicate the observed number of species. (a) Advanced eusocial species. (b) Non-advanced eusocial species. Capital letters indicate the urbanization level of each area (low, medium or high).
the squares and tree structural heterogeneity (Table 3). The most important variables for the second factor were the percentage of bare soil, pavements and grass within the square. The herbal/shrub structural hetero-geneity in the square and vegetation heterohetero-geneity in the surrounding area of the square may also be con-sidered relevant (Table 3).
The first two factors obtained from a principal com-ponent analysis of the abundances of advanced euso-cial bees represented 35 and 26% of the variance in the model.Nannotrigona testaceicornisandTetragonisca
angustula(Latreille) were the species (variables) more
relevant for the first factor and Paratrigona lineata
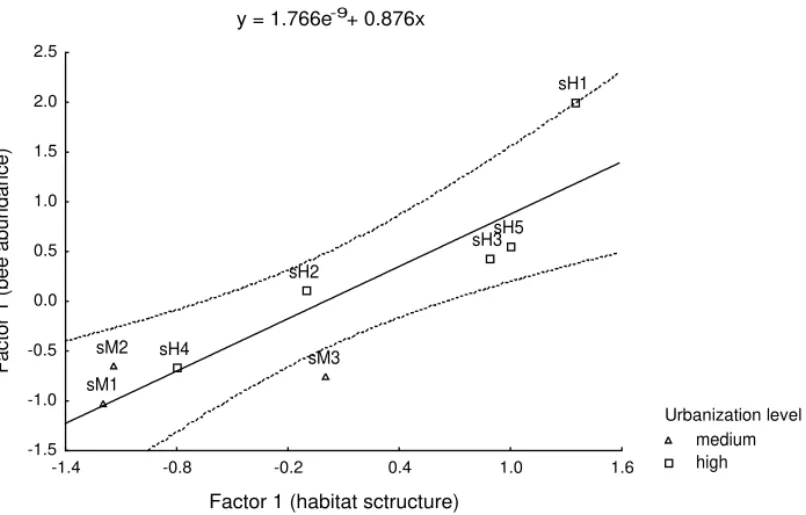
(Lepeletier) and Geotrigona subterranea(Friese) for the second factor (Table 4). The first factor obtained with the habitat features explained positively the vari-ation in the first factor obtained with the abundances of advanced eusocial bees (β = 0.876, r2 = 0.767, P < 0.004) (Fig. 9). No significant relationship was found between the PCA factors based on the habitat features and the PCA factors obtained with the abun-dance data of other insect groups considered here.
low medium high
Root 1
Root 2
L1 L2
L3
L4
M1 M2
M3 H1
H2 H3
H4 H5
-3 -2 -1 0 1 2 3
-8 -6 -4 -2 0 2 4 6 8
Urbanization level
Fig. 6. Ordination plot of the study sites in relation to the two roots (axes) obtained from a canonical discriminant analysis of the habitat features measured at each site. Only the first root was significant (eigenvalue=15.573.χ212=25.303.P <0.013; seeTable 1).
low medium high
Root 1
Root 2
L1
L2
M1
M2
H1
H2 H3 L3
H4
H5
M3 L4
-5 -4 -3 -2 -1 0 1 2 3 4 5
-7 -6 -5 -4 -3 -2 -1 0 1 2 3 4 5 6 7
Urbanization level
Fig. 7. Ordination plot of the study sites in relation to the two roots (axes) obtained from a canonical discriminant analysis of the abundances of advanced eusocial bees (i.e. stingless bees). Only the first root was significant (eigenvalue=16.639.χ2
14=23.746.P <0.049; see Table 2).
the squares and the estimated values (averages) of ad-vanced eusocial bees richness for each square (β = −0.784,r2=0.615,P <0.021) (Fig. 10). No signif-icant relationship was found between the factors ob-tained with the habitat features and the estimated rich-ness of other insect groups.
4. Discussion
low medium high
y = -1.012e-8- 0.969x
Root 1 ( habitat structure)
Root 1 (bee abundance) L1
L2 M1
M2
H1 H2
H3
L3 H4
H5 M3
L4
-8 -6 -4 -2 0 2 4 6
-6 -4 -2 0 2 4 6 8
Urbanization level
Fig. 8. Linear regression plot of the relationship between the significant discriminant root related to habitat features and the significant discriminant root related to the abundances of advanced eusocial bees (i.e. stingless bees). Dotted lines indicate 95% confidence limits (β= −0.938,r2
=0.881,P <0.000).
medium high y = 1.766e-9+ 0.876x
Factor 1 (habitat sctructure)
Factor 1 (bee abundance)
sM1 sM2
sH1
sH2
sH3
sH4
sH5
sM3
-1.5 -1.0 -0.5 0.0 0.5 1.0 1.5 2.0 2.5
-1.4 -0.8 -0.2 0.4 1.0 1.6
Urbanization level
medium high y = 6.802 - 1.378x
Factor 2 (habitat structure)
Es
timated richness
sM1 sM2 sH1
sH2
sH3 sH4
sH5 sM3
3.5 4.5 5.5 6.5 7.5 8.5 9.5 10.5
-2.0 -1.5 -1.0 -0.5 0.0 0.5 1.0 1.5 2.0
Urbanization level
Fig. 10. Linear regression plot of the relationship between the second PCA factor obtained with the habitat features measured at the squares (Table 3) and the estimated richness (mean values) of advanced eusocial bees. Dotted lines indicate 95% confidence limits (β= −0.784, r2=0.615,P <0.021).
Table 3
Factor loadings for the habitat features measured in public squares and their surroundings for the first two factors obtained in the principal component analysis
Habitat features in public squares Factor 1 Factor 2 Total area of the square 0.901 −0.345
Grass percent cover 0.259 −0.647
Bare soil percent cover 0.231 0.810 Pavements percent cover −0.272 0.768
Tree biomass 0.570 −0.385
Tree structural heterogeneity −0.831 −0.310 Tree species richness 0.475 −0.555 Shrub species richness 0.513 −0.169
Shrub biomass 0.848 −0.185
Shrub structural heterogeneity −0.012 0.611 Percentage of pavements/buildings 0.860 0.398 Percentage of vegetation cover −0.854 −0.452 Distance to large green areas −0.458 −0.322 Variation in the percentage of
pavements/buildings
−0.713 −0.143
Variation in the percentage of vegetation cover
0.402 0.607 Variation in the percentage of
bare soil
0.847 −0.287
Variance explained (%) 39 23
In the surrounding area of the squares.
also have found a superior abundance of Meliponini (Laroca et al., 1982; Knoll et al., 1994). However, this pattern is not restricted to urban environments. Studies of the bee fauna of Minas Gerais in non-urban areas have also shown the dominance of stingless bees (Silveira et al., 1993; Silveira and Campos, 1995). Ac-cording toHeithaus (1979), this is a general tendency in bee faunas of the tropics.Roubik (1992)suggested that the dominance of advanced eusocial species is
Table 4
Factor loadings for the abundances of advanced eusocial bee species for the first two factors obtained in the principal compo-nent analysis
Species Factor 1 Factor 2
Friesella schrottky 0.405 −0.011
Geotrigona subterranea −0.383 0.811
Nannotrigona testaceicornis 0.931 −0.086
Paratrigona lineata 0.112 0.821
Partamona helleri 0.683 0.077
Plebeia droryana 0.719 −0.134
Tetragonisca angustula 0.820 0.217
Trigona spinipes 0.214 0.783
related to their great capacity to find and store food, essential in tropical environments where the resource distribution is highly heterogeneous. Such ability may be fundamental in urban environments where floral resources are sometimes scarce. In addition, it must be considered that several of the dominant stingless bees are generalist species, which can use many of the exotic ornamental plants found in the streets and pub-lic squares. Studies with other insect groups that use floral resources (especially Lepidoptera) also suggest that species that can use exotic ornamental plants are favored in urban environments (Ruszczyk, 1986a,b;
Blair and Launer, 1997).
The prediction that more urbanized areas are less complex and for this reason support a smaller abun-dance of wasps and bees was partially confirmed. The less urbanized area (L) could be clearly differentiated from the others by its landscape structure, mostly by the percentage of vegetation cover and the smaller per-centage of impervious surfaces. However, the CDA results have showed that the area with an intermedi-ate level of urbanization (M) and the highly urbanized area (H) can not be differentiated by the measured habitat features (Fig. 6), even if these areas clearly have different levels of urbanization.
The less urbanized area (L) could also be discrimi-nated from the others by the abundances of advanced eusocial bees (i.e. stingless bees), but no discrimina-tion was possible between the other areas (M and H;
Fig. 7). The faunistic and structural similarities be-tween these two areas may be a consequence of the historical differences in their urbanization. The highly urbanized area (H) has been urbanized since the foun-dation of Belo Horizonte (1897) in a highly planned way, and has a large number of public green areas like parks, squares and gardens but a reduced number of private green areas (Horta, 1994). The area with an intermediate level of urbanization (M) has been ur-banized in a less planned way during the last three decades, and consequently has only a few public green areas but has many private green areas and vacant lots (Pedersoli et al., 1996). Therefore, both areas (H and M) may be similar in terms of available habitats and resources for the insect fauna.
The significant relationship observed between the abundance of advanced eusocial bees and the percentages of pavements/buildings and vegetation clearly indicates that habitat changes associated with
urbanization can affect these bees (Fig. 8). However, it also indicates that the magnitude of this effect could vary according to the nesting habits of each species (Table 2). Species that nest in pre-existent cavities,
like Nannotrigona testaceicornis and Plebeia
dro-ryana, were highly abundant in the more urbanized
areas where the high density of buildings provides an extensive range of nesting sites (e.g. walls, eaves and roofs). In contrast, this high density of buildings reduces the availability of nesting sites for ground nesting species, which could explain the reduced abundance of Geotrigona subterraneaand
Paratrig-ona lineatain the two more urbanized areas.Laroca
et al. (1982)suggested that the availability of nesting sites was a limiting factor for several Neotropical bee species found in a highly urbanized area in the city of Curitiba (Brazil).Torres and Gayubo (1989), also have suggested that ground-nesting bees and wasps were more abundant in the less or non-urbanized regions of Salamanca (Spain) in response to bare soil availability. Although no significant relation was found be-tween the abundance of advanced eusocial wasps and the habitat changes related to urbanization, the small abundances observed for almost all species suggest that urban environments are more restrictive to ad-vanced eusocial wasps than bees. The reduction in prey availability caused by the loss of vegetation may be one of the factors responsible for these results (Skibinska, 1986; Gayubo and Torres, 1990; Raw, 1998a). The high values of species richness found in the sites with the highest percentage of vegeta-tion cover, in the less urbanized area, reinforce this hypothesis. In addition, the increase of pavements and buildings coupled with the reduction of vegeta-tion cover, increases the exposure of wasp colonies to possible predators and particularly to humans, which are the major cause of colony mortality in urban environments (Fowler, 1983, Skibinska, 1986; Gunnarsson and Hake, 1999). Despite all these lim-itations, the great abundance of Polybia occidentalis
found in urbanized areas of Salamanca (Spain) were generalists (Gayubo and Torres, 1989, 1990).
The prediction that larger public squares can attract a greater number of insects was confirmed only for the advanced eusocial bees. However, the effect of size was directly related to the biomass of herbs and shrubs in the squares (Table 3). Since most of the floral re-sources available in the squares are concentrated in these plants, large squares offered more resources and consequently could attract more bees. In addition, the analyses with the squares also indicated that the local availability of floral resources (consequently the size of the squares) could be more important than the lo-cal availability of nesting sites for species like
Tetrag-onisca angustula,Friesella schrottky andPartamona
helleri, independently of their nesting habits.
Contrary to what was predicted, the reduction of natural structural complexity in the surrounding area of the squares can have a positive effect on the abun-dance of advanced eusocial bees (e.g. Nannotrigona testaceicornis) (Fig. 9). These results reinforce the hy-pothesis that species that nest in pre-existing cavities could be favored by the increased availability of nest-ing sites associated with higher levels of urbanization. The prediction that species richness could be re-lated to the size of the squares or the structure of their surroundings was not confirmed. However, the nega-tive correlation between the richness of advanced eu-social bee species and the percentage of bare ground and pavements in the squares (Fig. 10), suggests that the total percentage of vegetation in the squares may be affecting local species richness.
Overall, the responses of non-advanced eusocial species to urbanization or to the structural variation in the public squares were not as clear as the responses of advanced eusocial species. One possible explanation is that their responses may occur in spatial scales not considered here. Solitary species, for example, explore a smaller portion of their habitats when compared to a whole colony (considering insects with similar size) (Bohart and Menke, 1976; Roubik, 1992; von Nieuwstadt and Iraheta, 1996). Consequently, their responses to habitat changes are more rapid (Wiens, 1976; Didham et al., 1996). In addition, the spatial scales considered here could be too small to encom-pass the responses of species with great flying ca-pacity. Species likeXylocopa(Neoxylocopa)frontalis
and Bombus (Fervidobombus) morio, for example,
can fly more than 10 km from their nest searching for floral resources (Roubik, 1992). For such species the distances between the study sites (even between the areas) may be not relevant. Therefore, studies of larger portions of urban landscapes are necessary to analyze their responses to urbanization (Lord and Norton, 1990; Wiens et al., 1993; Hostetler, 1999).
4.1. Implications for conservation
The results presented here suggest that some species of advanced eusocial bees (e.g. Geotrigona
subterranea), which are directly affected by the
habi-tat changes related to urbanization, could be used as indicators of habitat conditions (as defined byBrown, 1991). These potential indicators, which are easily identified, could be linked to estimates of habitat or life quality for the local human population (Hostetler, 1999). Such association may be very useful for land-scape planners (and public authorities) interested in monitoring the development of urban environments. In addition, it may provide conservationists with an extra argument when defending a particular wasp or bee species (Hostetler, 1999). Considering that the occurrence of most advanced eusocial wasps was related to the percentage of vegetation cover, they could also be considered as potential habitat quality indicators. However, further studies are necessary to test which species are the best indicators.
The different responses to urbanization presented by wasps and bees at different spatial scales indicate that any conservation initiative in urban environments has to consider distinct spatial scales to be effective (Theobald et al., 1997; Cane, 2001). Considering that the structure and functioning of a city are based on an hierarchical system of decisions, conservation actions may be ‘inserted’ in each level of decisions (Savard et al., 2000). Changes in the vegetation of a private gar-den or a public square (related to local authorities and lot owners), for example, may attract a greater num-ber of stingless bees. Additionally, large scale changes in the urban landscape, like the creation of a public park (related to city authorities), may be essential to maintain or increase the diversity of advanced euso-cial wasps.
and animals (Sukopp and Weiler, 1988; Gilbert, 1991). The public squares studied present many opportuni-ties for direct contact with wasp and bee species, es-pecially and most desirably with the abundant sting-less bees. The results presented here may guide pub-lic authorities interested in increasing the potential of public squares and gardens as localities or direct con-tact with the native fauna. Stingless bees, for exam-ple, could be easily used as flagship species for native bee conservation. The almost harmless stingless bees (Meliponini) are the most charismatic and well known group of tropical bees (Nogueira-Neto, 1970). Adding floral resources to the squares could easily increase the frequency of contacts with these bees. This notion of “faunistic landscaping” is fundamental to develop nature conservation in cities (Ruszczyk, 1986c).
Although overlooked by many conservationists and ecologists, the rapid expansion of cities is a global phenomena and a pressing problem that must be se-riously confronted. Despite the fact that some species may benefit from increased urbanization, overall the results presented here indicate that this process has strong negative effects on key predator and pollina-tor species. Further research must be done urgently in order to find less impacting forms of urbanization.
Acknowledgements
We thank Eduardo A.B. Almeida and Fernando Silveira for bee identification. Servio T.P. Amarante and Orlando Silveira for wasp idendification. Claudia Maria Jacobi, Thomas Michael Lewinsohn and two anonymous referees for comments and suggestions. Belo Horizonte County Parks and Gardens Depart-ment for logistic help. This research was done during the tenure of a master degree scholarship of CAPES. R.P. Martins thanks to Brazilian CNPq and FAPEMIG for grants. This work is a product of the Graduate Program of Ecology, Conservation and Wildlife Man-agement of the Federal University of Minas Gerais (funded by US Fish and Wildlife Preservation Ser-vice).
References
August, P.V., 1983. The role of habitat complexity and heterogeneity in structuring tropical mammal communities. Ecology 64, 1495–1507.
Bedˆe, L.C., Weber, M., Resende, S., Piper, W., Schulte, W., 1997. Manual de mapeamento de Biótopos no Brasil. Fundação Alexandre Brandt, Belo Horizonte, 146 pp.
Blair, R.B., Launer, A.E., 1997. Butterfly diversity and human land use: species assemblages along an urban gradient. Biol. Conserv. 80, 113–125.
Bohart, R.M., Menke, A.S., 1976. Sphecid Wasps of the World: A Generic Revision. University of California Press, Berkeley, 695 pp.
Bonham, C.D., 1989. Measurements for Terrestrial Vegetation. Wiley/Interscience, New York, 338 pp.
Bortoli, C., Laroca, S., 1997. Melissocenologia no Terceiro Planalto Paranaense. I: Abundˆancia relativa de abelhas silvestres (Apoidea) de um biótopo urbano de Guarapuava (PR, Brasil). Acta Biologica Paranaense 26, 51–86.
Brockmann, H.J., 1979. Nest-site selection in the great golden digger wasp, Sphex ichneumoneus L. (Sphecidae). Ecol. Entomol. 4, 211–224.
Brown Jr., K., 1991. Conservation of Neotropical environments: insects as indicators. In: Collins, N.M., Thomas, J.A. (Eds.), The Conservation of Insects and Their Habitats. Academic Press, London, 450 pp.
Cane, J.H., 2001. Habitat fragmentation and native bees: a premature verdict? Conserv. Ecol. 5, 1–12.
da Silva, L.R., 1998. Doce dossiˆe de BH, BDMG Cultural, Belo Horizonte, 269 pp.
Davis, A.M.D., Glick, T.F., 1978. Urban ecosystems and island biogeography. Environ. Conserv. 5, 299–304.
Davis, B.N.K., 1982. Habitat diversity and invertebrates in urban areas. In: BornKamm, R., Lee, J.A., Seaward, M.R.D. (Eds.), Proceedings of the 2nd European Ecological Symposium on Urban Ecology. Blackwell Scientific Publications, Oxford, 63 pp.
Didham, R.K., Ghazoul, J., Stork, N.E., Davis, A.J., 1996. Insects in fragmented forests: a functional approach. Trends Ecol. Evol. 11, 255–259.
Diefenbach, M.G., Becker, M., 1992. Carabid taxocenes of an urban park in subtropical Brazil: II specific diversity and similarity (Insecta: Coleoptera: Carabidae). Stud. Neotrop. Fauna Environ. 27, 189–200.
Fowler, H.G., 1983. Human effects on nest survivorship of urban synanthropic wasps. Urban Ecol. 7, 137–143.
Frankie, G.W., Koehler, L.E., 1978. Ecology of insects in urban environments. Annu. Rev. Entomol. 23, 367–387.
Gayubo, S.F., Torres, F., 1989. Efecto de la presion urbana sobre abejas y avispas (Hymenoptera, Aculeata) en Salamanca. I: Consideraciones generales. Studia Oecologica 6, 347–374. Gayubo, S.F., Torres, F., 1990. Efecto de la presion urbana sobre
abejas y avispas (Hymenoptera, Aculeata) en Salamanca. III: Eumenidae y Vespidae. Studia Oecologica 7, 101–115. Gayubo, S.F., Torres, F., 1991. Efecto de la presion urbana sobre
abejas e avispas (Hymenoptera, Aculeata) en Salamanca. IV: Sphecidae. Bolet´ın de la Real Sociedad Española de Historia Natural 87, 73–92.
Genise, J.F., 1981. Influencia de factores meteorologicos en la actividad de Prionyx bifoveolatus (Tasch.) (Hymenoptera: Sphecidae). Physis 39, 19–24.
Gilbert, O.L., 1991. The Ecology of Urban Habitats. Chapman and Hall, New York, 369 pp.
Goudie, A., 2000. The Human Impact on the Natural Environment. MIT Press, Cambridge, 511 pp.
Grimm, N., 1997. Opportunities and challenges in urban ecological research. In: Proceedings of the Conference on the International Long Term Ecological Research. Forestry Research Institute, Taiwan, 147 pp.
Gunnarsson, B., Hake, M., 1999. Bird predation affects canopy-living arthropods in city parks. Can. J. Zool. 77, 1419– 1428.
Heithaus, E.R., 1979. Community structure of neotropical flower visiting bees and wasps: diversity and phenology. Ecology 60, 190–202.
Heltshe, J.F., Forrester, N.E., 1985. Statistical evaluation of the Jackknife estimate of diversity when using quadrat samples. Ecology 66, 107–111.
Horta, C.A.C., 1994. Belo Horizonte: a construção de um saber geográfico. Tese de mestrado, Universidade Federal de Santa Catarina, 373 pp.
Hostetler, M., 1999. Scale, birds, and human decisions: a potential for integrative research in urban ecosystems. Landscape Urban Plann. 45, 15–19.
Huberty, C.J., 1994. Applied Discriminant Analysis. Wiley/Interscience, New York, 466 pp.
Instituto Brasileiro de Geografia e Estat´ıstica (IBGE), 2001. Demographic census, 2000: preliminary report (on line). Jongman, R.H.G., ter Braak, C.J.F., van Tongeren, O.F.R.,
1995. Data Analysis in Community and Landscape Ecology. Cambridge University Press, Cambridge, 290 pp.
Knoll, F.R.N., Bego, L.R., Imperatriz-Fonseca, V.L., 1994. As abelhas em areas urbanas—um estudo no Campus da Universidade de São Paulo. In: Pirani, J.R., Cortopassi-Laurino, M. (Eds.), Flores e abelhas em São Paulo, 2a ed. EDUSP, São
Paulo, 41 pp.
Krebs, C.J., 1999. Ecological Methodology, 2a ed. Benjamim/
Cummings, Menlo Park, 620 pp.
Laroca, S., Cure, J.R., Bortoli, C., 1982. A associação de abelhas silvestres (Hymenoptera, Apoidea) de uma área restrita no interior da cidade de Curitiba (Brasil): Uma abordagem Biocenótica. Dusenia 13, 93–117.
LaSalle, J., Gauld, I.D., 1993. Hymenoptera: their diversity, and their impact on the diversity of other organisms. In: LaSalle, J., Gauld, I.D. (Eds.), Hymenoptera and Biodiversity. CAB International, Oxon, 260 pp.
Legendre, P., Legendre, L., 1998. Numerical Ecology, second English ed. Elsevier, Amsterdan, 853 pp.
Lord, J.M., Norton, D.A., 1990. Scale and the spatial concept of fragmentation. Conserv. Biol. 4, 197–202.
Macedo, J.F., Martins, R.P., 1999. A estrutura da guilda de abelhas e vespas visitantes florais deWaltheria americanaL. (Sterculiaceae). Anais da Sociedade Entomológica Brasileira 28, 617–633.
Manly, B.F.J., 1994. Multivariate Statistical Methods: A Primer, 2nd. ed. Chapman and Hall, London, 215 pp.
Martins, R.P., Pimenta, H.R., 1993. Ecologia e comportamento de vespas solitárias predadoras. Ciˆencia Hoje 15, 14–19. McDonnell, M.J., Pickett, S.T.A., 1990. Ecosystem structure
and function along urban rural gradients—an unexploited opportunity for ecology. Ecology 71, 1232–1237.
McIntyre, N.E., 2000. Ecology of urban arthropods: a review and a call to action. Annal. Entomol. Soc. Am. 93, 826–835. McIntyre, N.E., Knowles-Yánez, K., Hope, D., 2000. Urban
ecology as an interdisciplinary field: differences in the use of “urban” between the social and the natural sciences. Urban Ecosyst. 4, 5–24.
McIntyre, N.E., Rango, J., Fagan, W.F., Faeth, S.H., 2001. Ground arthropod community structure in a heterogeneous urban environment. Landscape Urban Plann. 52, 257–274. Michener, C.D., Lange, R.B., Bigarella, J.J., Salamuni, R., 1958.
Factors influencing the distribution of bees’nests in earth banks. Ecology 39, 207–217.
Moore, P.D., 1979. Urban ecology. Nature 282, 13–14.
Morgan, R., Jeanne, R., 1992. The influence of temperature on nest site choice and reproductive strategy in a temperate zone
Polisteswasp. Ecol. Entomol. 17, 135–141.
Neff, J.L., Simpson, B.B., 1993. Bees, pollination systems and plant diversity. In: LaSalle, J., Gauld, I.D. (Eds.), Hymenoptera and Biodiversity. CAB International, Oxon, 167 pp.
Niemelä, J., 1999. Ecology and urban planning. Biodiversity Conserv. 8, 119–131.
Nogueira-Neto, P., 1970. A criação de abelhas sem ferrão (Meliponinae). Tecnapis, São Paulo, 365 pp.
Owen, J., Owen, D.F., 1975. Suburban gardens: England’s most important reserve? Environ. Conserv. 2, 53–59.
Palmer, M.W., 1990. The estimation of species richness by extrapolation. Ecology 71, 1195–1198.
Pedersoli, A., Azevedo Júnior, T., Cˆandido, M.I., 1996. Saneamento básico em Belo Horizonte: trajetória em 100 anos (Os serviços de água e esgoto). Fundação João Pinheiro/CEHC, Formato, Belo Horizonte, 40 pp.
PRODABEL—Empresa de Informática e Informação do Munic´ıpio de Belo Horizonte S/A, 1997. Belo Horizonte Map. Scale 1:5000.
Raw, A., 1998a. Population densities and biomass of neotropical social wasps (Hymenoptera, Vespidae) related to colony size, hunting range and wasp size. Revista Brasileira de Zoologia 15, 815–822.
Raw, A., 1998b. The third trophic level of plant defence: neotropical social wasp’s use of odours of freshly damaged leaves when hunting. Revista Brasileira de Zoologia 15, 1075– 1092.
Rebele, F., 1994. Urban ecology and special features of urban ecosystems. Global Ecol. Biogeograph. Lett. 4, 173–187. Roubik, D.W., 1992. Ecology and Natural History of Tropical
Bees. Cambridge University Press, Cambridge, 514 pp. Ruszczyk, A., 1986a. Ecologia urbana de borboletas, I. O gradiente
de urbanização e a fauna de Porto Alegre, RS. Revista Brasileira de Biologia 46, 675–688.
Ruszczyk, A., 1986c. Análise da cobertura vegetal da cidade de Porto Alegre, RS. Revista Brasileira de Botˆanica 9, 225– 229.
Ruszczyk, A., 1986d. Hábitos alimentares de borboletas adultas e sua adaptabilidade ao ambiente urbano. Revista Brasileira de Biologia 46, 409–427.
Ruszczyk, A., 1996. Spatial patterns in pupal mortality in urban palm caterpillars. Oecologia 107, 356–363.
Sakagami, S.F., Laroca, S., Moure, J.S., 1967. Wild bee biocoenotics in São José dos Pinhais (PR), South Brazil. Preliminary report. J. Faculty Sci. (Hokkaido University) 16, 253–291.
Saure, C., 1996. Urban habitats for bees: the example of the city of Berlin. In: Matheson, A., Buchmann, S.L., O’Toole, C., Westrich, P., Williams, I.H. (Eds.), The Conservation of Bees. Academic Press, San Diego, 62 pp.
Savard, J.P.L., Clergeau, P., Mennechez, G., 2000. Biodiversity concepts and urban ecosystems. Landscape Urban Plann. 48, 131–142.
Silveira, F.A., da Rocha, L.B., Cure, J.R., Oliveira, M.J.F., 1993. Abelhas silvestres (Hymenoptera, Apoidea) da Zona da Mata de Minas Gerais. II. Diversidade, abundˆancia e fontes de alimento em uma pastagem abandonada em Ponte Nova. Revista Brasileira de Entomologia 37, 595– 610.
Silveira, F.A., Campos, M.J.O., 1995. A melissofauna de Corumbata´ı (SP) e Paraopeba (MG) e uma análise da biogeografia das abelhas do cerrado brasileiro. Revista Brasileira de Entomologia 39, 371–400.
Skibinska, E., 1986. Structure of wasp (Hymenoptera, Vespoidea) communities in the urban green of Warsaw. Memorabilia Zoologica 42, 37–54.
Stearns, F., 1970. Urban ecology today (AAAS Symposium, 1970 Chicago). Science 170, 1006–1007.
Sukopp, H., Weiler, S., 1988. Biotope mapping and nature conservation strategies in urban areas of the Federal Republic of Germany. Landscape Urban Plann. 15, 39–58.
Theobald, D.M., Miller, J.R., Hobbs, T.N., 1997. Estimating the cumulative effects of development on wildlife habitat. Landscape Urban Plann. 39 (1), 25–36.
Therriault, T.W., Kolasa, J., 2000. Explicit links among physical stress, habitat heterogeneity and biodiversity. Oikos 89, 387– 391.
Torres, F., Gayubo, S.F, 1989. Efecto de la pression urbana sobre abejas y avispas (Hymenoptera, Aculeata) en Salamanca. V: Superfamilia Apoidea. Comunicaciones I. N. I. A. (serie recursos naturales), vol. 54, 49 pp.
Turner, M.G., 1989. Landscape ecology: the effect of pattern on process. Annu. Rev. Ecol. Systematics 20, 171–197. Turner, M.G., 1998. Landscape ecology. In: Dodson, S.I., Allen,
T.F.H., Carpenter, S.R., Ives, A.R., Jeanne, R.L., Kitchell, J.F., Langston, N.E., Turner, M.G. (Eds.), Ecology. Oxford University Press, New York, 122 pp.
United Nations (UN), 1999. World Urbanization Prospects: The 1999 Revision (key Findings). World Populations Trends (on line).
Valentin, J.L., 2000. Ecologia numérica: uma introdução à análise multivariada de dados ecológicos. Interciˆencia, Rio de Janeiro, 117 pp.
Vitousek, P.M., Mooney, H.A., Lubchenco, J., Melillo, J.M., 1997. Human domination of Earth’s ecosystems. Science 277, 494– 499.
von Nieuwstadt, M.G.L., Iraheta, C.E.R., 1996. Relation between size and foraging range in stingless bees (Apidae, Meliponinae). Apidologie 27, 219–228.
West-Eberhard, M.J., Carpenter, J.M., Hanson, P.E., 1995. The vespid wasps. In: Hanson, P.E., Gauld, I.D. (Eds.), The Hymenoptera of Costa Rica. Oxford University Press, Oxford, 587 pp.
Wiens, J.A., 1976. Populations responses to patchy environments. Annu. Rev. Ecol. Systematics 7, 81–120.
Wiens, J.A., Stenseth, N.C., Van Horne, B., Ims, R.A., 1993. Ecological mechanisms and landscape ecology. Oikos 66, 369– 380.
Williams, N.M., Minckley, R.L., Silveira, F.A., 2001. Variation in native bee faunas and its implications for detecting community changes. Conserv. Ecol. 5, 1–19.