UNIVERSITY OF SÃO PAULO
SCHOOL OF ECONOMICS, BUSINESS AND ACCOUNTING DEPARTMENT OF ECONOMICS
GRADUATE PROGRAM IN ECONOMIC THEORY
FORESTS AND CITIES: ESSAYS ON URBAN GROWTH AND DEVELOPMENT IN THE BRAZILIAN AMAZON
Sergio André Castelani
Advisor: Danilo Camargo Igliori
Prof. Dr. Marco Antônio Zago President of the University of São Paulo
Prof. Dr. Reinaldo Guerreiro
Dean of the School of Economics, Business and Accountability
Prof. Dr. Joaquim José Martins Guilhoto Head of the Departament of Economics
Prof. Dr. Márcio Issao Nakane
FORESTS AND CITIES: ESSAYS ON URBAN GROWTH AND DEVELOPMENT IN THE BRAZILIAN AMAZON
Doctoral dissertation submitted to the Department of Economics of the School of Economics, Business and Accounting at the University of São Paulo in partial fulfillment of the requirements for the degree of Doctor of Sciences
Advisor: Danilo Camargo Igliori
Rectified Version
Original Version available at Faculdade de Economia, Administração e Contabilidade - USP
FICHA CATALOGRÁFICA
Elaborada pela Seção de Processamento Técnico do SBD/FEA/USP
Castelani, Sergio André
Forests and cities: essays on urban growth and development in the Brazilian Amazon / Sergio André Castelani. – São Paulo, 2013. 231 p.
Tese (Doutorado) – Universidade de São Paulo, 2013. Orientador: Danilo Camargo Igliori.
1. Econometria 2. Urbanização 3. Insumo-produto 4. Amazônia - Brasil 5. Migração I. Universidade de São Paulo. Faculdade de Economia, Administração e Contabilidade. II. Título.
AGRADECIMENTOS
À minha família por me dar todo o apoio hoje e sempre, em todas as minhas decisões. Em especial aos meus pais Leonice Castelani e Sergio Castelani por todo o suporte e amor durante toda minha vida. Às minhas irmãs Priscila e Cristiane Castelani, por serem pessoas incríveis que eu adoro.
À minha mulher Sara Santos, pelo amor, carinho e paciência nos momentos mais difíceis.
A meu orientador e amigo Danilo Igliori, pela ajuda e paciência, e pelos anos de confiança em mim depositados.
Ao professor e coorientador Joaquim Guilhoto, por toda a ajuda, paciência e suporte prestados. À minha amiga e parceira Ana Barufi, pela parceria importantíssima e ajuda fundamental.
Ao meu grande amigo Thiago “Jesus” Fonseca, por ser amigo, e ter me ajudado muito nas horas difíceis. E pelas infinitas conversas e parcerias musicais. Ao amigo e pesquisador Rafael Barbieri, pelo companheirismo, parcerias e sugestões. À Denise Imori, também pela amizade e cooperação.
À FAPESP, pelo suporte financeiro fundamental para que esta tese fosse possível.
Ao professor André Chagas, pelas sugestões e discussões a respeito deste trabalho.
Ao Eustáquio Reis, pelas idéias e suporte nos congressos. Aos professores Ricardo Abramovay, Carlos Roberto Azzoni e Gabriel Madeira, por toda a ajuda e comentários.
Ao pessoal do projeto RAS (Rede Amazônia Sustentável), em especial ao professor Toby Gardner, pelas sugestões e pela motivação sugerida.
Aos meus amigos e colegas de curso Thiago Angelis, Henrique Vinhais, Paula Pereda.
Aos meus parceiros de música e amigos Pedro Silva, Guilherme Momesso, Fernanda Peviani, Patrick Maia, Jara Arraiz, Thiago Colli, Rodrigo Mozambique, Claudião, Pedro Bezerra, Gustavo Lamounier e Sansão, por me permitirem fazer parte deste mundo incrível da música.
“Think global, act local”
ABSTRACT
The Brazilian Amazon has been undergoing a process of population growth and urbanization in recent decades. Its urban population increased from 42% to 71% between 1960 and 2010, and in the last decade, its overall population grew around 21%. Such rises bring important consequences not only economically, but also in environmental terms, especially considering that the largest remaining rainforest in the world is located within this region. Nevertheless, this scenario is still poorly addressed by literature. Bearing this in mind, this thesis aims to examine some economic and environmental aspects related to this context, and is specifically divided into three essays.
Firstly, a spatial econometric approach is implemented, based on the framework of spatial economics models, in order to investigate whether this process of urbanization has been generating local economic growth and development.
In the second essay, aiming to measure the environmental impacts of such population growth and urbanization, an Interregional Input-Output model is built, for the year of 2004, merging data regarding the productive structure and land use transition in the Brazilian Amazon. Specifically, this method allows the measurement of how much local deforestation may be attributed to the consumption of goods and services demanded by households living within the region, considering all direct and indirect production of inputs and outputs in every region of Brazil. Moreover, in order to capture the effects of local urbanization, special focus is given to the demands of the families living within the five Brazilian Amazon metropolitan regions.
Finally, in the third essay, given that population growth and urbanization processes are directly related to migration flows, an econometric model was implemented in order to investigate the determinants of immigration and emigration flows between the Brazilian Amazon and the rest of Brazil. This estimation allowed the comparison of the reasons that have been driving the exit and the entry of individuals in the region. Such methodology makes use of estimators which take into account econometric problems commonly attributed by literature to the modeling of migration flows, such as the sample selection issue regarding the potential differences in skills between migrants and non-migrants.
RESUMO
A Amazônia Brasileira vem passando por um processo de crescimento populacional e urbanização nas últimas décadas. Sua população urbana passou de 42% para 71% entre 1960 e 2010, e na última década o crescimento populacional da região foi de 21%. Tais processos trazem consigo consequências importantes não apenas em termos econômicos, mas também em termos ambientais, especialmente se considerando que a maior floresta tropical do mundo está localizada nesta região. No entanto, este aspecto é ainda pouco estudado pela literatura econômica.
Tendo isto em vista, este trabalho se propõe a estudar alguns aspectos econômicos e ambientais relacionados este quadro, divididos em três ensaios.
No primeiro, são utilizados métodos de econometria espacial, baseados em modelos de economia espacial, para investigar se este processo de urbanização tem causado crescimento e desenvolvimento econômico local.
No segundo ensaio, a fim de medir os impactos ambientais do crescimento populacional e da urbanização locais, informações a respeito da estrutura produtiva e do uso do solo na Amazônia Brasileira são cruzadas em um modelo Inter-regional de Insumo-Produto, que mede o quanto do desmatamento anual da floresta Amazônica é devido ao consumo de bens e serviços por parte das famílias que vivem na região, considerando toda a cadeia produtiva brasileira. A fim de capturar os efeitos da urbanização, foco especial é dado às demandas das famílias que vivem nas cinco regiões metropolitanas da Amazônia Brasileira.
Por fim, no terceiro ensaio, devido ao fato de que urbanização e crescimento populacional são processos diretamente relacionados à migração de indivíduos, é desenvolvida uma metodologia econométrica que investiga os determinantes dos fluxos imigratórios e emigratórios entre a Amazônia Brasileira e o restante do Brasil, no intuito de comparar os motivos que causam a entrada e saída de pessoas na região. Tal metodologia faz uso de estimadores que levam em conta problemas comumente atribuídos pela literatura na modelagem de fluxos migratórios, como a questão da seleção amostral relativa a potenciais diferenças de habilidade entre populações de migrantes e de não migrantes.
TABLE OF CONTENTS
1. INTRODUCTION ... 7
2. SPATIAL ECONOMICS OF GROWTH AND DEVELOPMENT IN THE BRAZILIAN AMAZON ... 12
2.1. ... Introduction, Motivation and Objective ... 12
2.2. ... Urbanization and Growth: Theory and practice literature ... 16
2.3. ... Historic Background, database and exploratory analysis of the Amazon urbanization process ... 31
2.3.1. Amazon Geography and Historic Background ... 31
2.3.2. Database ... 32
2.3.3. Exploratory Analysis ... 35
2.4. ... Econometric Analysis ... 44
2.4.1. Estimators ... 44
2.4.2. Econometric Results and Discussion ... 50
2.5. ... Conclusions and Final Remarks ... 65
3. LOCAL AND GLOBAL DRIVERS OF DEFORESTATION IN BRAZILIAN AMAZON... 68
3.1. ... Introduction ... 68
3.2. ... Methodology and Theoretical Background ... 73
3.2.1. The Single-Region Basic Leontief Model ... 74
3.2.2. The Inter-regional Input-Output Model ... 77
3.3. ... Empirical Strategy and database ... 79
3.3.1. Regional division of the Inter-regional Input-Output system ... 79
3.3.2. Sectoral Division and Aggregation ... 82
3.3.3. Deforestation data ... 83
3.4. ... Population, History, Socioeconomic and Environmental background. ... 85
3.5. ... The Input-Output Model Results ... 92
3.5.1. .... The 3 Regions Productive Structure ... 92
3.5.2. Impacts of local demand vectors of Brazilian Amazon ... 104
3.5.3. Concluding remarks ... 117
4. COMERS AND GOERS: DISENTANGLING MIGRATION FLOWS IN BRAZILIAN AMAZON... 119
4.1. ... Introduction, Motivation and Objectives ... 119
4.1.1. Brazilian Amazon: Historic occupation based on immigration ... 119
4.1.2. Brazilian Amazon recent migration flows: population increase based on vegetative growth ... 121
4.1.3 Specific objectives and Structure ... 129
4.2. ... Literature review and discussion ... 129
4.2.1 Theoretical models on migration determinants... 129
4.2.2 A brief literature review on migration empirical modeling ... 136
4.3. ... Empirical modeling: methodology ... 142
4.3.1. General approach: the push-pull analysis ... 143
4.3.2. Dealing with the sample selection problem ... 146
4.4. ... Database Sources and Other empirical limitations and advantages ... 158
4.4.1. Database sources... 158
4.5. ... Results and discussion: the determinants of Brazilian Amazon migration flows ... 160
4.5.1. .... Results from the Hierarchical Heckit First Stage ... 160
4.5.2. .... Results from the Hierarchical Heckit Second Stage Regressions ... 164
4.6. ... Conclusions and final remarks ... 185
5. CONCLUSION AND POLICY IMPLICATIONS ... 188
6. BIBLIOGRAPHY ... 198
APPENDIX A.1: DATA AND DEFINITIONS ISSUES REGARDING THE GEOGRAPHIC DIVISION OF REGION 1: THE METROPOLITAN REGIONS OF AMAZON. ... 209
APPENDIX A.3: ESTIMATING THE COSTS OF LIVING PER MUNICIPALITY ... 212
APPENDIX A.4: "HIERARCHICAL HECKIT" FIRST STAGE TABLE WITH THE FULL SET OF EXPLANATORY VARIABLES ... 220
APPENDIX A.5. SPATIAL ECONOMETRIC ESTIMATION OF MIGRATION FLOWS
DETERMINANTS (HIERARCHICAL HECKITS’ SECOND STAGE): REGRESSIONS
LIST OF FIGURES
Figure 2. 1: % of Urban Population evolution in Brazilian Amazon ... 13
Figure 2. 2: Population Growth in Brazil (2000 - 2010) ... 14
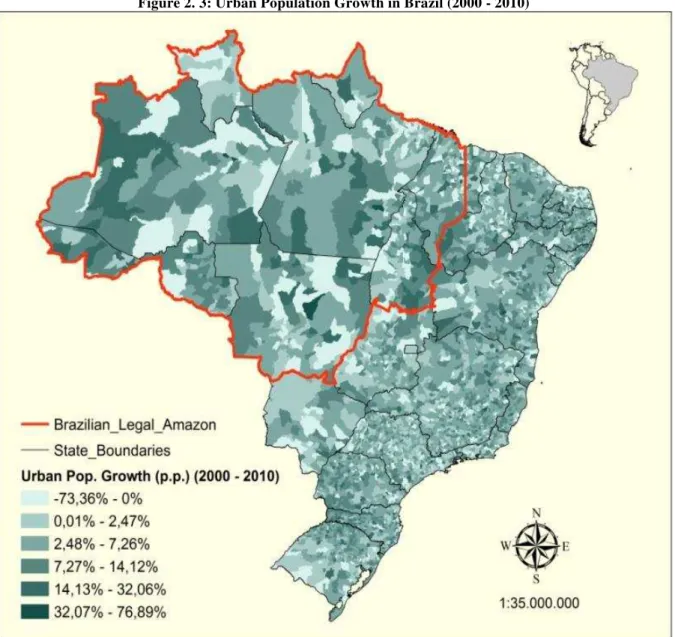
Figure 2. 3: Urban Population Growth in Brazil (2000 - 2010) ... 15
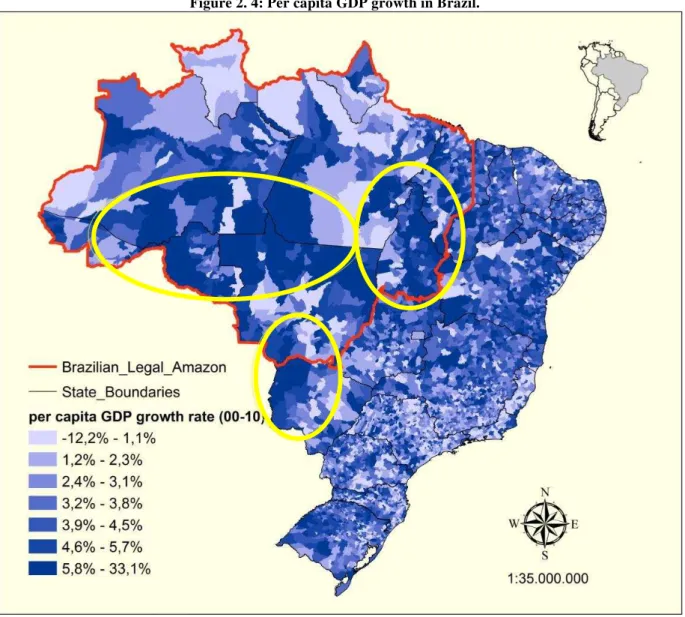
Figure 2. 4: Per capita GDP growth in Brazil. ... 30
Figure 2. 5: % of Urban population in Brazil (2010) ... 37
Figure 2. 6: % of Employment in the terciary sector (2010) ... 38
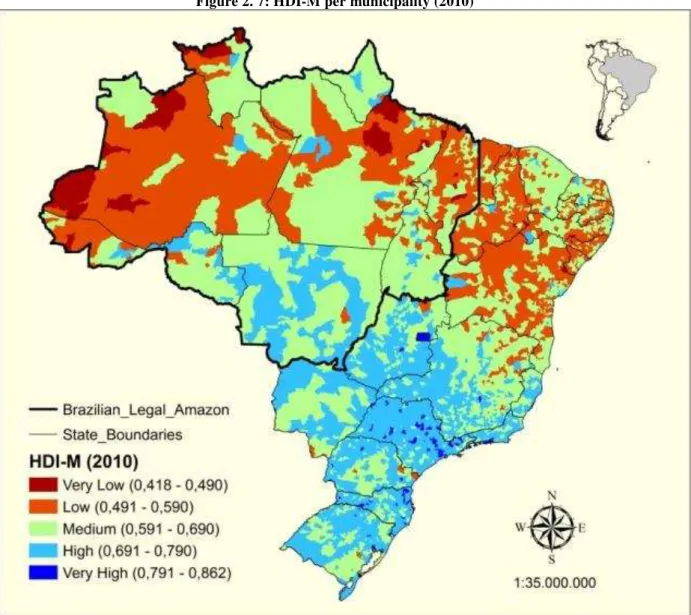
Figure 2. 7: HDI-M per municipality (2010) ... 39
Figure 2. 8: per capita GDP per municipality (2010, Thousands of R$ per year) ... 40
Figure 3. 1: Metropolitan Regions of Brazilian Amazon, the remaining Brazilian Amazon, rest of Brazil ... 80
Figure 3. 2: Output Multipliers of the Metropolitan Regions of Amazon (Region 1) ... 96
Figure 3. 3: Output Multipliers of the Rest of the Amazon (Region 2) ... 97
Figure 3. 4: Output Multipliers of the Rest of Brazil (Region 3) ... 98
Figure 3. 5: Employment Generators of the Metropolitan Regions of Amazon (Region 1) .... 99
Figure 3. 6: Employment Generators of the Rest of the Amazon (Region 2) ... 100
Figure 3. 7: Employment Generators of the Rest of Brazil (Region 3) ... 101
Figure 3. 8: Value Added Generators of the Metropolitan Regions of Amazon (Region 1) . 102 Figure 3. 9: Value Added Generators of the Rest of the Amazon (Region 2) ... 103
Figure 3. 10: Value Added Generators of the rest of Brazil (Region 3) ... 104
Figure 4. 1: Amazon Gross Immigration Flows ... 125
Figure 4. 2: Amazon Gross Emigration Flows ... 126
LIST OF MAPS
Map 3. 1: Manaus Metropolitan Region Sprawl, 2000-2010 ... 87
Map 3. 2: Belém Metropolitan Region Sprawl, 2000-2010 ... 87
Map 3. 3: Cuiabá-Várzea Grande Urban Conglomerate Sprawl, 2000-2010 ... 88
LIST OF TABLES
Table 2. 1: Population and Urbanization in Brazilian Amazon and the Rest of Brazil
(2000-2010) ... 13
Table 2. 2: Description of the variables ... 33
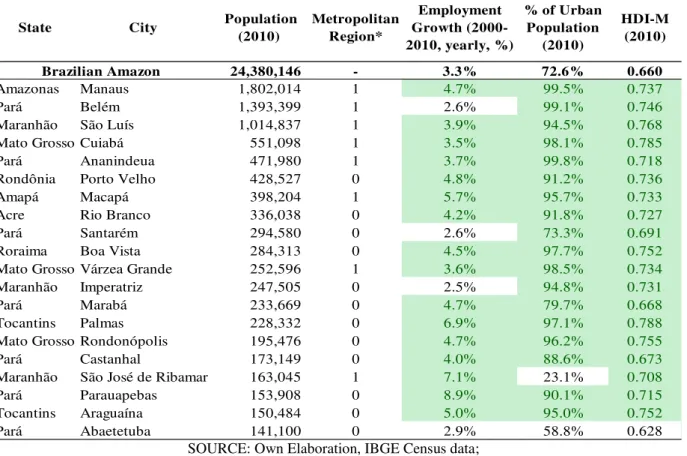
Table 2. 3: Top 20 Population Ranking in Brazilian Amaozn (2010) ... 41
Table 2. 4: Top 20 HDI Ranking in Brazilian Amazon (2010) ... 41
Table 2. 5: Top 20 HDI Ranking (2010) for medium cities in Brazilian Amazon ... 42
Table 2. 6: Determinants of Employment Growth ... 53
Table 2. 7: Determinants of GDP per capita growth ... 54
Table 2. 8: Determinants of HDI-M growth ... 55
Table 2. 9: Marginal effects of Initial urbanization level over Employment growth ... 58
Table 3. 1: Deforestation and Land Transition in Brazilian Amazon (1994-2002) ... 84
Table 3. 2: Current Socioeconomic Aspects of Brazilian Amazon and Brazil ... 91
Table 3. 3: Forest Cover and deforestation in Brazilian Amazon ... 92
Table 3. 4: Output produced in each “key” of the Rest of the Amazon (Region 2), according to its consumption destination ... 105
Table 3. 5: Output generated in each sector of the Rest of the Amazon, considering both direct and indirect production, produced to attend the consumption from families of the Amazon Metropolitan Regions, families of the Rest of the Amazon, families of the Rest of Brazil, and Exportations ... 110
Table 3. 6: Per capita output generated in each sector of the Rest of the Amazon, considering both direct and indirect production, produced to attend the vectors of consumption from families of the Amazon Metropolitan Regions, families of the Rest of the Amazon, families of the Rest of Brazil and Exportations ... 112
Table 3. 7: Deforestation on Brazilian Amazon caused by the demand vectors of each Brazilian region ... 115
Table 4. 1: Amazon Immigration Flows, by Origin Macroregion, 2005-2010 ... 122
Table 4. 2: : Amazon Emigration Flows, by Destination Macroregion, 2005-2010 ... 122
Table 4. 3: Amazon Immigration flows, by Origin State ... 123
Table 4. 4: Amazon Emigration Flows, by Destination State ... 124
Table 4. 5: Migrants' profile of individual characteristics ... 128
Table 4. 6: "Hierarchical Heckit" First Stage: individual probability of migration in Brazil, explained by push factors and individual characteristics ... 161
Table 4. 7: Hierarchical Heckit First Stage Fit: comparing estimated probabilities of migration between Migrants and non-migrants ... 164
Table 4. 8: "Hierarchical Heckit" Second Stage - Migration in Brazil focusing on the Brazilian Amazon Immigration Flows ... 166
Table 4. 10: Average Labor Income and Cost of Living in AMZ destinations, weighted by the
destination inflow of migration ... 169
Table 4. 11: : Average Labor Income and Cost of Living in RoB Origins, weighted by the origin’ outflow of migration ... 169
Table 4. 12: Average Unemployment Rate ... 170
Table 4. 13: % of Employment in the Tertiary sector ... 172
Table 4. 14: Share of Population with College Degree ... 175
Table 4. 15: Share of Population Illiteracy ... 175
Table 4. 16: "Hierarchical Heckit" Second Stage - Migration in Brazil focusing on the Amazon Emigration Flows ... 178
Table 4. 17: Average Labor Income and Cost of Living in RoB destinations, weighted by the destination inflow of migration ... 179
Table 4. 18: Average Labor Income and Cost of Living in AMZ origins, weighted by the origin’s outflow of migration ... 179
Table 4. 19: Average Unemployment Rate ... 181
Table 4. 20: Share of Population with College Degree ... 183
Table 4. 21: Share of Population Illiteracy ... 183
Table A.1. 1 : IBGE’s Micro-Regions and Metropolitan Regions of Brazilian Amazon ... 210
Table A.2. 1 : Sectoral Aggregation Map ... 211
Table A.3. 1: Heckit Hedonic Rent Model ... 216
Table A.4. 1: "Hierarchical Heckit" First Stage: individual probability of migration in Brazil, explained by push factors and individual characteristics (showing with all explanatory variables) ... 220
Table A.5. 1: "Hierarchical Heckit" Second Stage (spatial regression): sample composed only by Brazilian Amazon Immigration ... 231
1.
INTRODUCTION
Brazilian Amazon holds the largest remaining tropical forest in the world, which renders the region a global importance to current and future generations, and its conservation is undoubtedly fundamental to global ecological equilibrium. It is widespread knowledge that
the region’s biodiversity is immense. Also, recent literature found evidence supporting that deforestation in Brazilian Amazon is highly correlated to global warming and climate change. Imori et al. (2011), for example, using an Input-Output model, calculate that deforestation in Brazilian Amazon was responsible for about 58% of total greenhouse gases emissions in Brazil, and about 2% of total global emissions, in the year of 2004. Economically, the region hosts the current agricultural and cattle raising frontiers in Brazil, which holds capital-intensive cultivation of soybeans, whose exports have been boosting the recent surpluses in the Brazilian trade balance (Morton et al. 2006; Vera-Diaz et al. 2009). Politically, it is considered an area of strategic importance, due to its natural resources availability.
In parallel to such environmental and political-economic importance, a less known aspect about the region is that within the last two decades, it has been going through a considerable process of urbanization and population growth. Census data shows that its population grew by more than 4 million inhabitants throughout the last decade, representing an increase rate of 21.08%, which stands for twice the rate for the rest of Brazil. Such expressive growth is flourishing over a process of intense regional urbanization, as urban population grew by 3.7 million inhabitants from 2000 to 2010, representing an increase of 27.35% of this share of the population in the decade. Still, it is reasonable to believe that such urbanization has not yet reached its peak, as the share of urban population within Brazilian Amazon is about 73%, whereas it reaches the rate of 86.11% in the rest of the country, where occupation and urbanization are more consolidated historically (see Becker, 2013).
Furthermore, such urbanization process is not happening only among the region’s biggest cities. São Felix do Xingú, which is a medium-sized municipality located at southern Pará, faced a population increase of 264% in the last decade, jumping from 34,628 to 91,340 inhabitants. This growth was mostly based on urbanization, as its urban population went from
36% of the city’s population in 2000, to almost 50% in 2010. This is only one example among
Despite these recent urban and population growth, however, the region is still among the less socio-economically developed areas of Brazil, only behind the Northeast macro-region. The recently calculated HDI-M (Human Development Index per municipality) for the year of 2010, calculated by PNUD (the United Nations Development Program), presented an average of 0.660 for Brazilian Amazon as a whole, whereas the average index for Brazil is 0.727. For the Southeast Brazilian macro-region, which is the most developed of the country, this index assumes the value of 0.764. Considering that even the overall Brazilian HDI level is still relatively low when compared to developed countries, this evidences that the Brazilian Amazon region still has a gap of social development and economic growth to fulfill.
Given this picture concerning the region’s environmental importance, its strategic political relevance, and its transforming socio-economic structure, these processes of population growth and urbanization bring out important and interrelated questions: 1) What are the environmental impacts related to such urbanization ad population growth, especially in terms of deforestation? 2) Is this urbanization causing economic growth and development in Brazilian Amazon? 3) How much local urbanization and population growth are being determined by immigration and emigration flows recently, and how differences between determinants of these two kinds of flows may be affecting the urban and demographic structure of Brazilian Amazon?
These are relevant questions in regional, national and global scale: in socio-economic terms, their answers may contribute to bring economic development and growth to of one of the poorest regions in Brazil. Environmentally they are fundamental in worldwide terms, as deforestation impacts of this process sprawl throughout the globe, due to its collective nature.
Given such relevance, these are the questions that this work proposes to address and bring its contribution. Specifically, this thesis tries to address these processes of urbanization and population growth taking place in Brazilian Amazon from a perspective which tries to embrace several interrelated aspects.
focusing on the impacts caused by the consumption of goods and services from families living within the Brazilian Amazon metropolitan areas. In chapter 4, we try to investigate how these urban changes may be related to migration flows regarding Brazilian Amazon, by trying to identify and compare what has been causing immigration flows from other parts of Brazil towards the region, and what has been driving emigration flows from Brazilian Amazon to other parts of Brazil. Also, we try to measure how much of the region’s recent population increase may be attributed to migration. In order to do so, we firstly measure the relative size and the recent evolution of these flows. Secondly, we implement econometric methods which allow the comparison of the possible determinants of emigration and immigration. Such econometric methodology tries to account for several estimation problems regarding the use of migration flows as the dependent variable. Finally, in chapter 5, we conclude by summarizing and discussing the main implications of the results from all essays, relating them to literature on the subject. In this final chapter, we also propose some major policy guidelines, also briefly discussing their possible implications and impacts.
Our main results show that even though such urbanization and population growth are still ongoing processes within the region, they already exert relevant impacts in the region’s
economy and environment. Specifically, we find evidence that in the year of 2004, even though Brazilian Amazon’s population represented only 13% of the national total, the consumption vectors from local families could be held responsible for around 30% of the total yearly deforestation taking place within the region, when we account for both direct and indirect production designed to attend such demand. The specific demand vector from families who live within the Amazonian Metropolitan Regions is responsible for more than a half of this 30%, even though only 25% of the local population actually live in these areas. This result may be attributed to an increase in local families’ individual consumption level, generally caused by urbanization (especially in metropolitan regions). Moreover, considering that since 2004 both urbanization and population continued to grow, it seems likely that such deforestation impacts may have become even higher at the present date.
in Brazilian Amazon in 2010 are also the ones with the higher urbanization rates. Moreover, we find evidence that the growth of local population and urban centers are contributing to the emergence of an endogenous growth process of local markets, or put in other words, they are increasing the relative importance of internal markets as foundations for the region’s
economic development dynamic, even though we also find evidence that external markets still remain as important drivers of growth and development of Brazilian Amazon.
Therefore, gathering results concerning environmental and economic impacts of local urbanization brings evidence regarding the existence of an undesirable trade-off: on the one hand, urbanization and population growth seem to be promoting economic progress in one of the poorest regions of Brazil, but on the other, they are also driving higher levels of local deforestation. In terms of policy implications, this means that local sustainable growth will present itself as an environmental dilemma to policy makers in the years to come, especially considering that urbanization is still an undergoing process within the region. Thus, this suggests that new solutions for forest conservation will have to be created and implemented, along with the strengthening of conservation policies such as the increase of legal reserves or the creation of national parks and other conservation areas.
To which concerns the results regarding the role of migration flows on local population growth and urbanization, we firstly have found evidence that although the number of migrants of Brazilian Amazon (both immigrants and emigrants) have been slightly declining since 1995, and even though Amazon immigration and emigration are practically in balance nowadays, population and urbanization continued to grow during the 2000 decade. This suggests that such the recent population growth must be mostly based on vegetative growth, that is, on the reproduction of the population who have already been living within Brazilian Amazon borders throughout the last decades. Nevertheless, we have estimated and compared the drivers of Amazon immigration and emigration flows, in order to be able to trace possible future population trends, and results showed some relevant differences between the determinants of these two kinds of flows.
immigration, as most of the economic theories would predict. On the other hand, Amazon emigration flows are also mostly composed by young individuals moving to highly urbanized areas of Brazil. However, they also tend to leave from more urbanized cities of Brazilian Amazon. Furthermore, in opposition to Amazon immigration flows results, Amazon emigration does not seem to be driven by short run real income differentials between origins and destinations, but instead, our results point that such emigration flows are mostly driven by
the differentials in basic and superior education levels of the migrants’ origins and
destinations. Such result does not necessarily mean that these emigrants move seeking to increase their own educational levels. In fact, it is possible to interpret this evidence in two different ways: a) it is possible that these migrants are in fact seeking to increase their education level, in order to elevate their future (or long run) real income earnings; b) it is possible that these origin and destination municipalities’ education level might be capturing
the effects of other unobserved (and positively correlated to education) explanatory variables which were not included1 in our estimations, such as culture or infra-structure.
Considering that the region’s ongoing urbanization process will probably continue through the next decades, since its urbanization rate has not yet caught up to the average national rate, and as such urbanization seem to be bringing local economic growth and development, then this evidence concerning migration determinants can be interpreted as a sign that the current drivers of immigration flows towards Brazilian Amazon might increase in the years to come.
Finally, to sum up, we conclude that Brazilian Amazon currently faces an increasing trade-off between deforestation and economic growth caused by urbanization and population growth. Apparently, there are no signs that such trade-off will decrease in the short run, as individuals who are moving to the region are being driven by its increasing real income level, which in turn is naturally associated to the economic growth brought by the undergoing urbanization process which the region has been going through recently. Given this scenario, future research is needed to in order to draw specific policies which take this trade-off into account, aiming to avoid the increase of local deforestation, but also without decreasing the pace of its recent economic development.
2.
SPATIAL ECONOMICS OF GROWTH AND DEVELOPMENT IN
THE BRAZILIAN AMAZON
2.1. Introduction, Motivation and Objective
Brazilian Amazon is undoubtedly one of the most important areas of the globe, environmentally. It hosts the largest part of the major remaining rainforest in the world. Its mining resources and biodiversity are almost incommensurable. These are well-known facts
concerning the region’s current reality. Recently, on the other hand, one less known
contextual aspect has been emerging: the region has been undergoing a process of intense population growth and urbanization, which is evidenced by the Brazilian demographic Census databases: from 2000 to 2010, its population grew by more than 4 million inhabitants, representing an increase rate of 21.08%, which equals almost twice the rate for the rest of Brazil (approximately 11%). Such growth has been flourishing over a process of intense urbanization: urban population2 grew by 3.7 million inhabitants from 2000 to 2010, representing an increase rate of 27.35% throughout the decade, which once again was two times larger than the urban population growth in the rest of Brazil. Figure 2.1 shows the evolution of urban population in the Brazilian Amazon Legal Area over the recently: its urban population share rose from 42% in 1970, to 71% in 2007.
Still, one might argue that such urbanization has not yet reached its peak, since urbanization rates in Brazil as a whole were at the rate of 86.11% in 2010, i.e., 15 p.p. higher than the rate of Brazilian Amazon. In a recent publication, Becker (2013) present an argument defending this idea: according to the author, urbanization within the Amazon region has not yet reached the same consolidation level from the rest of Brazil, neither in terms occupation, nor in terms of promoting economic development within the region.
Table 2.1, and figures 2.2 and 2.3 sum up this situation, and bring more detailed information regarding this referred population growth and urbanization process which Brazilian Amazon has been going through recently, also comparing it to data regarding the Rest of Brazil.
Figure 2. 1: % of Urban Population evolution in Brazilian Amazon
SOURCE: IBGE Census data.
Table 2. 1: Population and Urbanization in Brazilian Amazon and the Rest of Brazil (2000-2010)
SOURCE: IBGE 2010 Census data, Own Elaboration
42%
46%
56%
62%
69%
71%
40% 45% 50% 55% 60% 65% 70% 75%
1970 1980 1991 1996 2000 2007
Share (2000) Share (2010) Abolute Growth (00-10)
% Growth (00-10)
% Growth (00-10)
Absolute Growth (00-10)
Rest of Brazil 82.91% 86.11% 19,179,920 15.46% 11.17% 16,713,195 Brazilian Amazon 68.87% 72.44% 3,791,914 27.35% 21.08% 4,243,434
Figure 2. 2: Population Growth in Brazil (2000 - 2010)
Figure 2. 3: Urban Population Growth in Brazil (2000 - 2010)
SOURCE: IBGE Census data, Own Elaboration
Furthermore, and still according to census data, 28.19% of the total Brazilian Amazon population lived within one of its 5 Metropolitan Regions3 in 2010. Also, the private Services sector, which is typically associated to urban agglomerations, has increased its participation on the region’s GDP composition from 30.79% in 1996 to 35.03% in 2007, according to
IBGE’s Regional Accounts. Also, this process has been taking place in cities of all sizes within Amazon. Manaus, which is the largest city within the region, and also the main city of a big metropolitan region, has grown from 1.4 million inhabitants in 2000 to 1.8 million in 2008, which represents an increase rate around 28% in only 10 years. Rio Branco, a smaller State capital located in the State of Acre has experienced a population growth from 253,059
3 The 5 Metropolitan Regions are the following (named usually by the after MR largest city): Cuiabá-Várzea
inhabitants in 2000 to 336 thousand in 2010, which means a raise of around 32%. As an example of medium-sized cities, the town of São Felix do Xingú, located at southern Pará, grew its population by the outstanding rate of 264%, jumping from 34,628 to 91,340 inhabitants in the last decade, with such growth mostly based on the increase of its urban
population, which went from 36% of the city’s population in 2000, to almost 50% in 2010.
Bearing all of that in mind, a question arises: are these demographic changes regarding urbanization and population growth correlated to, or even causing, economic growth and development in the Brazilian Amazon?
To try to answer that question is the main goal of this chapter. More specifically, we have two main objectives. Firstly, as already mentioned, we wish to measure how much of this growing urbanization process is contributing to the region’s economic growth and development, based on historic background, exploratory analysis and econometric methods structured over neoclassical models. Secondly, we aim to measure how much of the local economic growth and development may be attributed to the region’s current internal economic dynamics (in terms of the development of its local markets), comparing it to how much of it still may be attributed to external links and dependence of markets in southern Brazil and foreign countries. Or, put in other terms, our second goal in this chapter is to measure the share of local economic development which may be considered geographically endogenous, as defined by macroeconomic growth theories (see Lucas, 1988; Romer, 1994), and how much still may be considered due to geographically exogenous dependence.
In order to achieve these goals, this chapter is structured in 5 sections, with section 2.1 being this introduction. Section 2.2 presents the literature review of the economic models which will be used as basis to all analysis made throughout the chapter. Section 2.3 presents a historical background of the Brazilian Amazon region, presents the database used in our empirical analysis, and provide an exploratory analysis of this data, bringing the first evidences on the answers to our main questions. Section 2.4 brings a description of the econometric methodology implemented in this chapter, and discusses the results of these regression estimations. Section 2.5 concludes.
2.2. Urbanization and Growth: Theory and practice literature
the world is passing through a shift from agriculture-based economies to urban–based economic systems. These new dynamic systems mostly base their development on the creation of new technologies, mass production and consumption patterns and intensive growth of the services sector. According to the UN (United Nations) Global Health Observatory, more than 50% of the world’s population lived in urban areas in 2012, a statistic which was
around 40% in 1990. Urban residents grew about 60 million people yearly worldwide, on average, and future predictions estimate that urban population share will be around 70% in 2050, around the globe.
Regarding how urban centers may increase in size and dynamics, it is important to understand that urban systems assume different economic structures and shapes, according to their intrinsic characteristics, history, and external economic linkages. One city may grow due to governmental incentives, while other may prosper only due to geographical initial conditions. That being said, and as expected, there is no previously determined recipe on how to promote urbanization and prosperity. Nevertheless, urban nodes development usually share common features which bring some valuable insights on understanding this dynamics: agglomeration externalities and congestion effects, which we discuss in further detail in the following.
Given this picture, economic models regarding the relationship between urbanization and economic development sprawled within the last 60 years. Given the complexity of the subject, we review how economic literature addresses two main aspects of urbanization: 1) What are the causes of urbanization? 2) How urbanization affects economic development and growth? The first question will serve as the basis of this study, while the second will define our methodology, especially concerning the structural form of the econometric analysis we implement in this chapter.
What causes urban growth?
by agglomeration externalities, and also on the costs brought by the congestion effects of conglomerating.
As Ioannides & Rossi-Hansberg (2005) point out, these benefits (positive externalities) encompass the main advantages of conglomerating human activity, and might be classified in 4 categories: a) knowledge spillovers, which is given by the natural sharing of information and knowledge caused by face to face interactions between different agents located in the same spatial area; b) thick markets for inputs, in the sense that specialized laborers tend to agglomerate in urban nodes, so that the respective specialized firms can easily match its needed workforce, therefore, diminishing information frictional costs; c) backward and forward linkages, that is, the advantages which agglomeration bring for both firms and consumers, by respectively reducing transportation costs due to the concentration of the demand vectors in few urban conglomerates; and also due to the greater variety of goods which are available for consumers by the fact that firms are also concentrated at these areas; d) Jacobs externalities: as a consequence of the other three agglomeration forces, urban
environment tend to favor the development of “new work” (see Jacobs, 1970), which
corresponds to the creation of a workforce with higher productivity (due to the more competitive ambient of labor markets in urban areas brought by the higher spatial concentration of workers), which by their turn result in an endogenous reproductive structure
of this labor, due to the economic growth caused by the increase of these laborers’ consumption standards. Therefore, Jacobs’s externalities refer to the creation of endogenous
dynamism propitiated by the urban environment.
According to this literature, the higher the size of these agglomeration externalities, the bigger will be the city size. However, as a city grows, congestion effects also increase. These congestion effects are given by several aspects of urban disposal which poses as costs to the individuals and firms within the urban nodes: elevated traffic which raises transportation costs, air and water pollution, high criminality rates, excesses in labor supply, etc. Therefore,
city size is determined by the individuals’ and firms’ decisions whether to move or to leave
urban areas, according to their perception of the trade-off between these costs and benefits. In this sense, for example, new technologies that reduce congestion effects or increase the size of agglomeration externalities may contribute positively for a city to grow.
urbanization, one must include other “external” elements into the analysis. More specifically,
in order to an urbanization process to occur, one out of two possibilities must happen: it is necessary that agents migrate from rural to urban areas; or it is necessary that population and production increase in both rural and urban areas, resulting in urbanization accompanied by rural growth. In fact, even if the first possibility occurs, it is also necessary that output in rural areas increase in order to sustain the usually higher consumption standards from individuals who live within urban areas. In order to include this aspect into the urbanization analysis, a group of models from the so-called New Economic Geography (NEG) emerged (see, for example, Krugman 1991, Fujita et al. 1999, Henderson & Thisse 2004), which we consider as being the second category of models in our analysis.
These models became known as Core-Periphery, as they are based on a simple dichotomist
division of a municipality into a “core” urbanized (and industrialized) sector, and a
“periphery” agricultural region. The urban sector is considered to be the one that pushes
forward economic activity, as it is assumed to be more dynamic by presenting increasing returns to scale, whereas the rural (agricultural) sector pursue a production function based on constant returns to scale, and exists mostly to sustain both urban and rural population. These increasing returns to scale of the urban sector allows it to pay higher relative wages, which in turn tend to attract workers towards these urban areas, depending on the costs of migration relative to the real income differential. Urban growth, thus, may occur depending on this real wages differential, which by its turn is determined by the size of the increasing returns and other parameters within the model. These parameters may vary from one city to another, which by its turn permits that several equilibriums may occur, each with different levels of population concentration between regions. Therefore, these models bring two very important contributions to understand urban growth: they include the needed rural sustainability aspect of urbanization, and also serve as a baseline to explain the co-existence of cities with different degrees of urbanization.
(and more recent) category of models regarding urbanization growth emerge: the models
which study urban systems as a whole. We refer to this group of models as the “urban
system” ones (see Duranton & Puga, 2001; Duranton, 2007; Findensen & Suedekum, 2008
and Igliori et al., 2012).
This group of models consider urban systems as dynamic entities, with each urban node working as a small open economy, trading firms and workers with other cities. In this sense, cities usually grow according to their capacity of providing technological innovations which attracts firms and/or workers. In this sense, more innovative cities tend to increase by capturing agents from less innovative municipalities. The logic behind this argument is that firms and industries are able to move quickly from one city to another. City growth, however, is slow, due to the fact that, in general, whereas one group of industries prosper, others
decline at the same time. Finally, cities’ size distribution tend to be is still, as most of the
times populations simply move from one city to another, without interfering in the distribution of these.
As a final regard, we remind that this classification of urbanization models in three categories is made only in order to ease the comprehension of the main differences between the several argument presented by literature. However, it is important to highlight that, in fact, all these models are deeply interconnected, and most of the times rely on the same set of hypothesis and conclusions. As Henderson (2010) argue, a good example of this interconnectivity is the explicit link between the Urban models and the NEG Core-Periphery models. According to the author, both of these groups of models rely on knowledge spillovers as being the basic pillar among the urban characteristics, since they are responsible for the attraction of firms and individuals towards cities in Urban models, whereas in the NEG models, they are support the argument that the urban sector presents increasing returns to scale.
How urbanization affects economic growth and development?
the creation of technological innovations, thus resulting in a following increase of regional economic growth. Thick input markets, as another example, tend to reduce costs of
production, therefore also increasing the economy’s output level. Jacobs externalities, in turn,
are naturally associated with creation of knowledge and increases in productivity. And so on.
New Economic Geography models, by their turn, also imply that urbanization comes along with economic development. Population movements towards urban nodes with higher real
wages increase are considered to raise the economy’s overall productivity, as the core urban
sector which absorbs the workforce presents increasing returns to scale, whereas the rural sector is considered to be less productive. Also, some NEG models, such as in Fujita & Thisse (2003), migrants are considered to be more skilled4 workers than non-migrants. And as one of the main results of the NEG models concerns the fact that migrants usually move towards the core urban regions (which are also the more productive ones), such migrations flows tend to lead to an increase of labor productivity, which by its turn ends in elevating economic growth.
Furthermore, “Urban system” models such as Duranton (2007) and Duranton and Puga (2001)
are based on the hypothesis that urbanization is led by industries’ migration flows, which by
their turn follow the pattern of emergence of technological changes throughout space. Thus, urban growth itself is already considered to be a part of technological progress, and therefore, is naturally positively correlated with economic development. Furthermore, in these systems, whereas some industries grow driven by the innovations shocks, others simply grow due to the economic multipliers which are generated by the initial growth of the innovative industries. This, in turn, generates new positive demand shifts for all industries within the municipality, due to the resulting increase in income and employment driven by these initial growth and the economic multipliers generated through the process, in several sectors. All of this dynamic, in turn, results in economic growth and development of the city as a whole.
Furthermore, these “Urban system” models still argue that such growth may not be restricted
to the municipalities where innovations emerge: according to those models, the initial development of one urban node tend to sprawl throughout the whole urban system, due to the several economic linkages between municipalities, such as the trade of goods and services, tourism, neighbor spillovers, and so on.
Finally, other types of models (which do not fit exactly in any of the three categories considered here so far) also agree with the perspective that urbanization and growth are positively correlated (see, for example, Gleaser, 2008; Henderson & Thisse, 2004). Ioannides and Rossi-Hansberg (2005), for example, argue that many economic activities can only take place within urban environments: personal services, financial activities, real estate markets and many others activities depend on face-to-face interactions to exist, and are only feasible in urban conglomerates. These activities, by their turn, create economic multipliers which naturally drive economic growth and development.
Justifying structural forms: Empirical literature on Economic Growth as the dependent variable
As presented in the previous section, theoretical literature about urbanization, in general, seems to converge towards the existence of a positive correlation between urbanization and economic growth. More than that, it is possible to argue that these models imply an even stronger relationship between those two variables: a relationship of causality, in the sense that urbanization causes growth and development. Apparently, such causality seems to be straightforward in the models presented so far: positive agglomeration externalities, increasing returns to scale, knowledge spillovers are all characteristics attributed to urbanization in these models. And these characteristics, by their turn, are the ones which create economic multipliers, which increases real wages and productivity, which reduces costs of transportation and production, and which promote the creation of markets that need face-to-face interactions between agents to exist.
However, due to the complexity of urbanization processes, since they involve many interconnected variables, it is important that we ground the econometric structural form used in this study on empirical models which take such causality into consideration. Keeping it in mind, we review the empirical literature on the determinants of economic growth and development, focusing on how these models include growth and development as endogenous variables caused by exogenous explanatory variables which encompass urbanization representatives among them. This empirical literature will serve as basis to provide the structural forms which we implement on the regressions that we estimate in our econometric approach.
growth models (see Fingleton 2003, Barro and Sala-i-Martin 1995, Armstrong 1995). The basic form of these models refer to Solow (1956) classic macroeconomic growth structure, in which a single economy exhibits a production function involving capital and labor, with constant returns to scale. Output in this economy is of a single sector which produces a homogenous good, which by its turn is either invested or consumed. Investment rate equals savings rate, capital depreciation is constant over time, and both population and workforce growth are determined exogenously at a constant rate. Given those conditions, economy converges to a stable point where investment-depreciation relationship is at balance: if output is above the steady state point, savings are also higher, and due to diminishing productivity of capital (whereas the depreciation rate is constant), such savings will have to decrease in time, for its returns are lower than the depreciation schedule. The opposite similar argument is true if output is below the steady state point. For such, investment-savings rate equals the depreciation rate when convergence is achieved. Also, at this steady state point, when there is no technological progress, consumption, output and capital stock each grow at the same rate of population, which means that per capita values are constant. In other words, in this set up, per capita growth in the long run is only possible if there is also technological progress.
Following Fingleton (2003), we can express this basic model’s steady state growth rate of the
GDP per capita by a Taylor linear approximation around the steady state point. This is expressed in equation 2.1.
(
1
)(
)(ln
ln
*)
1
1 t
t
t
P
P
p
(2.1)In 2.1, ptrepresents the per capita output growth at time t, Pt1is the level of output per capita at t-1, *
1
t
P is the output per capita in steady state equilibrium, is the population (workforce)
growth rate, is the rate of technical progress, is the capital share parameter in a Cobb-Douglas production function, and is the depreciation rate. Integrating 1.1 leads to 1.2:
t T
t T
t
t
P
T
T
P
T
u
P
/
)
/
(
1
exp(
))
ln(
)
/
ln(
(2.2)per capita higher than the steady state level, then GDP per capita must decrease in order to reach the steady state savings-depreciation balance, and vice-versa.
This basic framework represented by equation 2.2 is the most basic convenient reduced form for empirical modeling, for it represents a simple equation with per capita GDP growth rate as the dependent variable regressed against an initial level of GDP. If we were to apply equation 2.2 as the structural form of our regressions, as the units of observation of our sample are the municipalities of Brazilian Amazon, we would be able to say that equation 2.2, as it stands, would be representing a basic neoclassical growth model with the assumption that is the same for any city i in Brazilian Amazon. This, in turn, would mean that we would be
assuming absolute convergence in the long run, because all cities’ economies would be
tending to the same steady state point. However, this is not a very realistic set up, since Amazon cities pursue different rates of investment, initial capital level, depreciation rates, workforce growth, and several other heterogeneities. In order to capture these heterogeneities of the municipalities in the Brazilian Amazon region, and also in order to avoid any kind of omitted variables bias in estimations, we keep on following literature (see Fingleton 2003, Barro and Sala-i-Martin 1995, Armstrong 1995), and assume that each city will be converging to its own steady state. This means assuming the so called relative convergence assumption in growth literature. In order to do so, this literature suggests to include, in equation 2.2, other explanatory variables which capture the specific characteristics of each city, such as economic indicators, geographical characteristics, social patterns, institutional differences, and so on, all referring to the initial period of the analysis. In our estimations, this means expanding equation 2.2 towards equation 2.3.
i t i i
T t i
T t i
t
P
T
T
P
T
X
u
P
,/
,)
/
(
1
exp(
))
ln(
,)
/
,ln(
(2.3)i t i i
T t i
T t i
t
P
T
b
P
X
u
P
,/
,)
/
ln(
,)
,ln(
(2.4)which gives us a linear structural form which clearly can be estimated through standard econometric regressions methods, such as Ordinary Least Squares (OLS).
Therefore, equation 2.4 is the basic structural form which we chose for our estimations. That being put, we now describe specifically the set of variables (dependents and explanatory) which we use in our estimations.
As dependent variables, we chose three different variables whose growth rates represent economic growth and development. The first one is given directly by the left-hand side of equation 2.4 itself, which is the per capita GDP growth rate, used in basic neoclassical growth models (such as the ones presented here). The other two are the employment growth rate, and the HDI-M (Human Development Index per Municipality5) growth rate. Employment growth was chosen because of two main reasons. First of all, employment is a variable which represents labor, which by its turn may be seen as one of the most important elements of growth and development: labor income may be considered the main driver of economic growth, once it is the main source of personal wealth for the majority of the population. Moreover, employment growth is associated with the creation of new jobs, which by its turn represent capital accumulation, according to neoclassic growth models. Also, positive shifts in employment are associated with forward and backward multiplier linkages in the economy, since creation of destruction of jobs openings may be the result of external positive or negative demand shocks, and job creation themselves increase the national income level. The second main reason for the use of employment growth as a dependent variable in our regressions is due to empirical literature (see, for example, Gleaser 1995 and 1991, and Igliori et al 2012, Fingleton, Moore and Igliori, 2003). For instance, equation 2.4 became famous in
literature as the “Barro regression”, with growth being explained by several other initial conditions. And in empirical literature, this “growth” is often represented by employment instead of per capita GDP, not only due to the first reason gave in the previous paragraph, but also many times due to data scarcity of per capita GDP per municipality. In such literature, a structural form identical to 2.4 is used for regression estimations, but with employment in place of per capita GDP, which is also one of the possibilities adopted here.
As for the choice to also estimate regressions with the HDI-M growth rate as the dependent variable, it was made in order to possibly capture aspects of economic development which might not be directly captured by GDP or employment. The reason for that is because the HDI-M index is composed not only by the population income (or employment) level, but also by its educational and health conditions levels. Therefore, in order to analyze if urbanization and other explanatory variables exert influence not only on growth, but also in other aspects of development, we have also estimated these HDI regressions in this study analysis. Furthermore, in order to be able to compare results from the HDI, employment and GDP regressions, we chose to implement the same structural form to HDI growth regressions as the ones used in employment growth and per capita GDP regressions, given by equation 2.4.
At this point, it is important to stress that we are aware that using an index (such as HDI) as an dependent variable may not be considered ideal by literature, mostly because indexes are by construction influenced by many variables included in the explanatory vector (which means that the correlations captured by estimations might be mathematical, and not statistical). However, we highlight that the great majority of the explanatory variables which we have used refer to the initial period of the explained growth rates. This, in turn, means that this kind of endogeneity through reverse causality is mostly being avoided, since it is difficult to argue that variables whose values were defined in previous periods may be explained by values of another variable defined in future periods. On the other hand, empirical literature which uses the HDI or other indexes growth rates as dependent variables is not abundant, which leads us to interpret these group of regression results mostly as complementary, with our main results referring to the per capita GDP and employment growth regressions, even though most of the results in our regressions proved to have similar interpretations for all dependent variables.
As for the explanatory variables, the choice of variables was made according to and the main goals of our analysis, and also based on literature on economic growth. In this sense, besides including the initial level of the dependent variable in the year 2000, we firstly have selected three variables to represent the urbanization rate of each municipality, in order to achieve the main objective of investigating if urbanization has been causing economic growth in Brazilian
Amazon. The first one is the municipality’s share of urban labor force (or the share of urban
within the urban areas6, among all workforce population. The higher this share, the greater the urbanization level. This first measure of urbanization captures the geographic aspect of it, as it is based on a geographical concept of urban areas. The second measure is the share of employment in the terciary sector within the city, and refers mostly to an economic perspective of urbanization, as the terciary sector basically consists of urban economic activities such as personal and public services, culture industry, etc. This aspect may be considered complementary to the first one, since it encompasses a different aspect of urbanization, and it does not rely on any mapping subjective concept. The third measure of urbanization included, by its turn, tries to capture the influence of the most densely and big urban complexes of Amazon, as it is a dummy variable representing whether or not a city belong to a metropolitan region. This effect is also complementary to the other two, since metropolitan regions not only are highly urbanized by definition, but they also exert influence
on their neighbors’ urbanization rate, since spatial spillovers from these areas tend to be
elevated.
In order to be able to compare the relative importance of internal drivers and external drivers over local economic growth, we have also included explanatory variables which represent the
external links of the Amazon municipalities’ economies with the ones from the Rest of Brazil
and the exterior. The main idea behind this inclusion is that, if these variables’ coefficients
prove to be significant, then economic linkages with external economies are to be considered relevant as drivers of growth and development. If coefficients from internal characteristics are also significant, then we may consider that both internal and external economic variables are relevant in terms of promoting growth and development within Brazilian Amazon. In this sense, the specific variables we have included are the amount of output exports from Amazon cities to other countries, and the average transportation costs from each city to São Paulo7. In sum, it is expected that the greater the economic dependency of Amazon on other countries
and regions’ economies, the bigger will be the coefficients of the exports to other countries,
and the more negative will be the coefficient of transportation costs to São Paulo.
6 According to the IBGE criteria of urban areas. This criteria is criticized by Veiga (2002), who argues that it may overestimate the size of brazilian cities urban areas. However, even if this critique is correct, as we use the same criterion for all municipalities, we are most likely committing the same average error to all cities, which means that the variance of this urban explanatory variable may not be altered relevantly by this error. And as the explanatory variables’ variance is what matters for the econometric methods to be consistent, then we argue that this measurement error may not affect our results relevantly.
Furthermore, we also have included other control explanatory variables in our regressions according to their availability, and also to empirical literature recommendations on the subject. In this sense, we have included a set of variables representing the educational level of the municipality, measures of income distribution, the deforestation level of the city and its neighbors, public social policies, labor market characteristics, sectorial GDP shares and spatial neighbor relationships. Education variables are justified because literature indicates that higher education levels may lead to more technical progress and higher productivity (see
Duranton, 2007; Fingleton, 2003; Becker, 2013). The city’s deforestation level, by its turn, is
expected to partially explain growth because deforestation is naturally associated to land-use change and production, thus, cities with higher levels of deforestation are expected to present higher levels of economic development too.
The labor market main characteristic which we have included regards its level of informality, as it is an institutional aspect which measures the degree of maturity of one city’s economy.
Thus, it is expected that more informality in labor markets should lead to lower development. As for the public social policies, in fact we have only included one variable, which is the social assistance program “bolsa família”, which is a social policy of income transfer from
Brazilian Federal government to the poorest share of the population. The main goal of this program is to increase equality in Brazil as a whole, through the direct reduction of poverty. Therefore, it may also be directly connected to growth, as it tends to increase consumption from the poorest share of the population, even though it may also bring a downshift in labor supply, as in any social secure policy.
Even though growth and equality should not present any kind of expected correlation, from a neoclassic microeconomic perspective8, we chose to also include some indicators of inequality within the municipalities as control variables, as they might be associated with other omitted variables which also affect growth. These variables are the Theil index of inequality and the share of the HDI index which refers to income distribution. Also, still following growth literature (see Fingleton, 2003), we have included the shares of each great sector in the GDP composition in the base year of 2000 as explanatory variables. The reason is: by including all three great sectors (agriculture, manufacturing and services) as explanatory variables of growth, we are possibly capturing tendencies of development related to at least one of these sectors. In this sense, for example, if a specific new technology in one of the
three sectors emerges, and this boosts growth in all cities in which this sector has the major share, then this variables will capture this specific effect. As we will see later on, this do not seem the case in our estimations.
Finally, one more time guided by literature, we chose to include spatial neighbor effects among the explanatory vector. The reason for that is because in almost all theoretical models which guide this study, growth and development are spatial phenomena. Empirical literature on the subject shows, most of the times, that growth occur in a clustering dynamics. Among several studies, Fingleton (2003) shows explicitly that the dynamic of per capita GDP growth in Europe, recently, follow a pattern in which one can easily identify spatial agglomerations of the economies with the highest growth rates. Fingleton, Igliori and Moore (2005) find a similar evidence for English cities. According to this point of view, it is impossible to isolate the economic growth of one region (city, country) from its neighbors. And these neighborhood effects are present for several reasons. Cities and countries are small open economies which trade goods and services among themselves, therefore, growth in one region tend to increase its importations of gods and services produced by its neighbors. Also, technological progress in one city creates multiplier effects which sprawls in a geographical scale, inciting migration and capital flows between these economies. In dense metropolitan
areas, it is common that some peripheral cities serve as workers “dormitories”, while central
municipalities cluster the jobs of these individuals, which reflects the neighbors’ influence on
growth as a necessary condition in this case.