BASIC RESEARCH
aExperimental Research Unit (LIM 30), Department of Pediatrics, São Paulo
University Medical School - São Paulo/SP, Brazil.
bDepartment of Pathology, São Paulo University Medical School - São Paulo/
SP, Brazil.
Received for publication on 25/10/07 Accepted for publication on 31/12/07
UTILIZATION OF THE LOWER INFLECTION POINT
OF THE PRESSURE-VOLUME CURVE RESULTS
IN PROTECTIVE CONVENTIONAL VENTILATION
COMPARABLE TO HIGH FREQUENCY OSCILLATORY
VENTILATION IN AN ANIMAL MODEL OF ACUTE
RESPIRATORY DISTRESS SYNDROME
Felipe S. Rossi,aRenata Suman Mascaretti,aLuciana B. Haddad,aNorberto A.
Freddi,aThais Mauad,bCelso M. Rebelloa
Rossi FS, Mascaretti RS, Haddad LB, Freddi NA, Mauad T, Rebello CM. Utilization of the lower inflection point of the pressure-volume curve results in protective conventional ventilation comparable to high frequency oscillatory ventilation in an animal model of acute respiratory distress syndrome. Clinics. 2008;63:237-44.
INTRODUCTION: Studies comparing high frequency oscillatory and conventional ventilation in acute respiratory distress syn-drome have used low values of positive end-expiratory pressure and identified a need for better recruitment and pulmonary stability with high frequency.
OBJECTIVE: To compare conventional and high frequency ventilation using the lower inflection point of the pressure-volume curve as the determinant of positive end-expiratory pressure to obtain similar levels of recruitment and alveolar stability.
METHODS:After lung lavage of adult rabbits and lower inflection point determination, two groups were randomized: conventional (positive end-expiratory pressure = lower inflection point; tidal volume=6 ml/kg) and high frequency ventilation (mean airway pressures= lower inflection point +4 cmH2O). Blood gas and hemodynamic data were recorded over 4 h. After sacrifice, protein analysis from lung lavage and histologic evaluation were performed.
RESULTS: The oxygenation parameters, protein and histological data were similar, except for the fact that significantly more normal alveoli were observed upon protective ventilation. High frequency ventilation led to lower PaCO2 levels.
DISCUSSION: Determination of the lower inflection point of the pressure-volume curve is important for setting the minimum end expiratory pressure needed to keep the airways opened. This is useful when comparing different strategies to treat severe respiratory insufficiency, optimizing conventional ventilation, improving oxygenation and reducing lung injury.
CONCLUSIONS: Utilization of the lower inflection point of the pressure-volume curve in the ventilation strategies considered in this study resulted in comparable efficacy with regards to oxygenation and hemodynamics, a high PaCO2 level and a lower pH. In addition, a greater number of normal alveoli were found after protective conventional ventilation in an animal model of acute respiratory distress syndrome.
KEYWORDS: Acute respiratory distress syndrome. Mechanical ventilation. Ventilation induced lung injury. LIP. Protective ventilation.
INTRODUCTION
Since its initial description, acute respiratory distress
syndrome (ARDS) has been associated with high mortality rates.1 More recently, however, it has been demonstrated that
the choice of ventilation strategy used to treat patients with ARDS can influence the mortality risk.2-4 The same applies
to other forms of acute and severe pulmonary distress.5 This
and lung injury.4 Lesions associated with mechanical
ventila-tion include: barotrauma, which is generated by applicaventila-tion of an excess of pressure during mechanical ventilation;6
volutrauma, which is secondary to an excessive volume of air that penetrates the areas of normal compliance;7
atelec-trauma, which is secondary to maintenance in the area of the collapsed lung at end expiration during mechanical ventila-tion;8 and biotrauma, which describes effects on the lung and
other organs caused by inflammatory mediators released by damaged pulmonary tissue.9,10
In order to minimize these effects, the use of high-frequency oscillatory ventilation (HFOV) with higher mean airway pressures (MAP) has been proposed,11,12 and new
approaches to conventional ventilation have been developed such as permissive hypercapnia,13 open-lung ventilation14 and
protective conventional ventilation (PCV), which is based on a combination of the first two methods.2
HFOV has demonstrated consistently better recruitment and pulmonary stability in the treatment of ARDS than con-ventional mechanical ventilation, which is typically used at low values of positive end-expiratory pressure (PEEP), re-sulting in higher alveolar instability.11,12,15,16 This comparison
could be erroneous if one assumes that HFOV is superior to conventional ventilation for the treatment and prognosis of ARDS.
The objective of this study is to compare, in an ARDS animal model, the efficacy of HFOV to conventional me-chanical ventilation using a PEEP based on the lower inflec-tion point (LIP) of the pressure-volume (PV) curve, associ-ated with the use of low tidal volumes. Recorded outcomes are oxygenation, hemodynamic effects and degree of damage to the pulmonary parenchyma.
MATERIALS AND METHODS
This study was conducted in the laboratory of the Experi-mental Research Unit of the Department of Pediatrics, and the protocol was approved by the Commission of Ethics for Analysis of Research Projects. The established protocol for management of laboratory animals was followed.
Preparation of the animals and establishment of the
ARDS model. Adult New Zealand White rabbits were sedated
(10 mg/kg ketamine and 0.1 mg/kg acepromazine, IM) and the anterior region of the neck was anesthetized (2% xy-locaine), followed by dissection and insertion of 4 French catheters into the carotid artery (for blood pressure and heart rate monitoring and blood gas measurements) and the jugular vein (for continuous infusion of a 5% dextrose solution at 4 ml/kg/h). The trachea was exposed and an endotracheal tube (3.5 mm I.D. or 4.0 mm I.D.) was passed into it and secured.
Blood pressure, heart rate and body temperature were contin-uously monitored. The latter was maintained between 38oC
and 39.5 oC using warming pads. During the entire study, the
animals remained in the dorsal decubitus position.
Generation of the ARDS experimental model was per-formed according to the technique described by Lachmann et al.17 Briefly, successive pulmonary lavages were carried
out with saline at 37 oC for approximately 60 seconds (20 s
for infusion and 40 s for withdrawal, using external thoracic compression movements) in 30 ml/kg aliquots and at a maxi-mum infusion pressure of 40 cm H2O. The procedure was repeated at 3 to 5 minute intervals, until the partial pressure of O2 (PaO2)/fractional inspired oxygen concentration (FiO2) ratio dropped to less than 100. At this moment, the LIP of the PV curve was determined. During the entire lavage procedure, the animals were ventilated as follows: PEEP, 5 cm H2O; respiratory rate, 50 breaths/min; inspiratory time, 0.5 s; FiO2, 100%; and the peak inspiratory pressure was continuously adjusted to achieve a desired and fixed tidal volume (Vt) of 10 ml/kg. In the case of systemic arterial hypotension (defined as a mean systemic blood pressure <50 mm Hg), noradrenaline was used at a starting concentration of 0.2 µg/kg.min.
Determination of the lower inflection point of the
inspira-tory PV curve (LIP). To determine the LIP, a 60 ml syringe
containing pure oxygen was connected to the endotracheal tube and to a closed computerized system for data acquisi-tion (LabView 5.1, Naacquisi-tional Instruments), developed specifi-cally for this purpose (R.A. Eletro Sistemas Ltda, Campinas, Brazil). The pressure was read through a pressure sensor (model DP45-24, Validyne Corp., Northridge, CA), and the volume was measured using a pneumotachometer (model 3700 series, Hans Rudolph Inc., Kansas City, MO).
After aspiration of the endotracheal tube, each animal received pancuronium (0.1 mg/kg, IV) and was disconnected from the ventilator for 2 sec, followed by progressive infla-tion of the lungs with 100% O2 in regular aliquots of 2 ml up to a total volume of 60 ml, and at regular intervals over approximately 40 seconds and a maximum pressure of 25 cmH2O. Using the same data acquisition system, the inspira-tory limb of the PV curve was constructed and the LIP was identified by visual analysis.18 The exact point was defined
Study groups and ventilation strategies. After LIP de-termination, the animals were randomized into two study groups according to the type of ventilation used: protective conventional ventilation (PCV) or high-frequency oscillatory ventilation (HFOV). Animals submitted to PCV were ven-tilated with a time-cycled pressure-limited infant ventilator (Inter 3®, Intermed, Sao Paulo, Brazil). PEEP was set equal
to LIP; Vt, 6 ml/kg; inspiratory time, 0.5 s; respiratory rate, 50 breaths/min.; and FiO2, 100%.
The HFOV group was ventilated with a SensorMedics 3100B ventilator (SensorMedics Critical Care Corp., Yorba Linda, CA) set to deliver a MAP = LIP + 4 cm H2O; respi-ratory rate, 15 Hz; initial amplitude, 15 cm H2O; and FiO2, 100%. The amplitude was modified as necessary in order to obtain a target PaCO2 between 50 and 55 mm Hg.
Arterial blood samples were collected at 30 minute in-tervals (I-Stat®, Abbott Laboratories Inc, East Windsor, NJ,
USA) for blood gas analysis. The indexes and parameters used for oxygenation evaluation were: PaO2/FiO2 ratio, oxy-genation index (O.I. = [(FiO2 x MAP)/PaO2]x100), arterial-alveolar PaO2 ratio (a/A O2) and alveolar-arterial oxygen difference (A-a O2).
Sacrifice of animals and lung processing. After 4 hours
of ventilation, animals were deeply sedated with sodium pentobarbital (25 mg/kg, IV), followed by sacrifice via sev-ering the abdominal aorta. The lungs were removed, weighed and thoroughly lavaged five times with cold saline (4 oC) via
the endotracheal tube. The total alveolar lavage volume was recorded, and aliquots (200 µl) were used for protein content determination according to the method of Lowry.19
Lung histology. Tissue samples from the left lung were
formalin-fixed and paraffin-embedded. Five micron (5 µm) sections were H&E stained. Morphometric study of the lung architecture was performed by optical microscopy at 100x magnification, using a 100-point and 50-line grid of known area in one of the eyepieces. The analysis was blinded and conducted by a single investigator. Areas of normal and abnormal alveolar architecture, alveolar collapse and hy-perdistension were quantified.20 Fifteen microscopic fields
of alveolar parenchyma were read per slide. Values are ex-pressed as percentage.
Data analysis. All values are given as mean ± SD.
Differ-ences over time and between ventilation groups were evalu-ated by two-way analysis of variance (two-way ANOVA) for repeated measurements, where time was the within-subjects factor and treatment was the between-subjects factor. The Student-Neuman-Keuls test was used for post-hoc analysis. When individual time points were compared, differences were analyzed by t-test. Histopathologic data was assessed by the Chi-square or Fisher’s exact test, as indicated. Statisti-cal significance for all analyses was reported at p < 0.05.
RESULTS
Description of the animals: Eight animals were studied
in each group. The variables PaO2/FiO2 ratio and the LIP were comparable in both group (Table 1).
Respiratory status of the animals: The two ventilation
strategies (i.e., choice of PEEP or MAP based on LIP) re-sulted in similar MAPs of approximately 18 cm H2O (Figure 1).
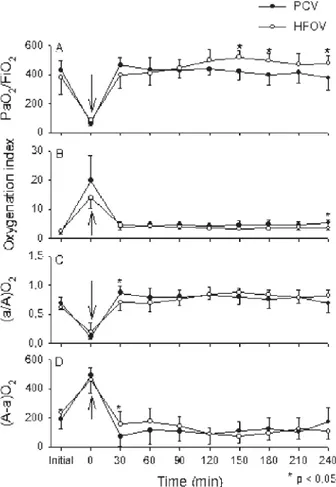
The indexes and parameters used for oxygenation evalu-ation during the 4 hour ventilevalu-ation period are shown in Fig. 2, according to the gasometric values obtained at 30 minute intervals. The PaO2/FiO2 ratio was better in HFOV when compared to PCV at 150, 180 and 240 minutes (Figure 2A). The oxygenation index was also similar with both ventila-tory strategies, except for a small but significant difference at 240 min, with a higher oxygenation index among animals from the PCV group (Figure 2B). When oxygenation was evaluated via the arterial-alveolar PaO2 ratio (a/A O2) and alveolar-arterial oxygen difference (A-a O2), we found a small and transient but significantly higher oxygenation at 30 min. with PCV vs. HFOV (Figures 2C and 2D).
The protective ventilatory approach used for PCV resulted in different PaCO2 levels, with lower values in the HFOV group (Figure 3A). This also resulted in lower pH values among animals from the PCV group, which remained between 7.0 and 7.2 throughout the ventilation time (Figure 3B).
Hemodynamic evaluation: During the entire study period,
no differences were found between the groups with regards to arterial blood pressure and heart rate (Table 2). Noradrena-line was administered to 3 animals in the HFOV group and
Table 1 - Characteristics of the animals in each study group. Values are mean ± SD
Group N Weight (g) Number of lavages PaO2/FiO2 LIP
PCV 8 2625 ± 160* 4.9 ± 1.8 65.5 ± 22.7 14.1 ± 2.5
HFOV 8 3015 ± 320 5.1 ± 0.8 84.3 ± 15.6 14.0 ± 2.0
Figure 2 - Group mean±SD are shown for PCV group (closed circles) and HFOV group (open circles). “Initial” time are values before lung lavage; “zero” time corresponds to values immediately after the installation of the experimental model. The arrow indicates the moment of LIP determination and beginning of both ventilatory strategies. Panel A: PaO2/FiO2. The HFOV
group presented better oxygenation at 150, 180 and 240 min; Panel B: Oxy-genation index; Panel C: (a/A)O2 and Panel D (A-a)O2. Similar increase in
oxygenation with the beginning of ventilatory strategies was seen in both groups, with small but significant difference favoring the HFOV group at 240 min (Panel B) and 30 min (Panel C and Panel D)
Figure 1 - Animals from PCV group (closed circles) and HFOV group (open circles) were ventilated with MAP around 18 cm H2O. Values are expressed
in mean± SD. Both ventilation strategies resulted in similar mean airway pressures (MAP). “Initial” time are values before lung lavage; “zero” time corresponds to values immediately after the installation of the experimental model. The arrow indicates the moment of LIP determination and beginning of both ventilatory strategies
Figure 3 - Group mean±SD are shown for PCV group (close circles) and HFOV group (open circles). “Initial” time are values before lung lavage; “zero” time corresponds to values immediately after the installation of the experimental model. The arrow indicates the moment of LIP determination and beginning of both ventilatory strategies. Panel A: PaCO2. Due to the
protective ventilatory approach adopted, the PaCO2 values were higher among animals from PCV group; Panel B: pH. Significant decrease was seen among animals from PCV group
4 animals in the PCV group to maintain a systemic blood pressure higher than 50 mm Hg.
Evaluation of lung injury: No differences were found
between the groups with regards to lung weight and proteins present in the alveolar lavage, indicating that both ventilation strategies resulted in similar lung damage (Table 2). For the histologic evaluation of lung injury, hyperinflated and col-lapsed alveoli were grouped together and the architecture redefined as abnormal alveoli. The findings from normal and abnormal alveoli were then compared. There were more normal alveoli in the PCV group than in the HFOV group (p < 0.01). Values are presented in Table 3. In both groups, a large number of alveolar neutrophils were identified.
DISCUSSION
The use of experimental models to study ARDS and the impact of mechanical ventilation has been covered by vari-ous publications in the last few years. Several experimental models have been used, including rabbits,12,21-25 pigs,26 rats27,28
and sheep,18 with different techniques for the induction of
compared protective conventional ventilation with HFOV did not use a strategy to avoid alveolar collapse, meaning that it was impossible to accurately compare the two ventilatory techniques.
This study explores the use of the LIP of the PV curve to tailor the ventilator settings such that the comparison be-tween CPV and HFOV is not influenced by the use of PEEP below the opening pressure. Our results demonstrate that in this experimental model of ARDS, the use of conventional mechanical ventilation using the LIP of the PV curve to determine the PEEP associated with a protective strategy is comparable to HFOV. Oxygenation was comparable; neither the hemodynamic status nor the markers of lung injury were altered, suggesting that the use of PEEP equal to the LIP value can result in similar oxygenation and aggravation of the pulmonary parenchyma, as compared with HFOV.
Unlike the strategy used in this study, the adoption of low PEEP values in previous reports might have contributed to the demonstration of advantages with HFOV when com-pared to conventional ventilation, due to the impossibility of obtaining an appropriate alveolar volume at the end of expiration with conventional ventilation.11,23,29
We considered PaO2/FiO2 values around 500 mm Hg25-27
or PaO2 + PaCO2 levels higher than 400 mm Hg30 as “open
lung” indicators, with the selection of PEEP in PCV and MAP in HFOV guided by the LIP of the inspiratory limb of the PV curve. We obtained these values with both ventila-tory strategies at an early stage without requiring alveolar recruitment maneuvers.
A potential bias in this type of study is the method of LIP determination. The software developed for data acquisition and LIP determination is very precise, and the researchers
came up with similar values for the LIP for all animals stud-ied. We found LIP values similar to those described in other studies with this animal species22,24,25 and, more importantly,
the values were much higher than the PEEP used in many studies that compared strategies of conventional mechanical ventilation with HFOV.
The adoption of MAP values in HFOV of 4 cm H2O above LIP was based on the description of Luecke, who obtained better results with this ventilation strategy when compared to a MAP equal to LIP.26
There is a still a significant debate about the ultimately different pulmonary response in pulmonary and extrapulmo-nary ARDS. There are different data that have arisen from animal and clinical studies.31,32 Even the initial approach
to a patient with respiratory distress can have an important influence on the diagnosis of ARDS; thus, it is difficult to determine whether ARDS begins in the lungs or if it is a result of an inflammatory process that starts elsewhere.33-35
Recently, aggressive recruitment maneuvers were able to open very sick lungs in patients with both pulmonary and extrapulmonary early ARDS, suggesting that the aim of the respiratory assistance should be to reverse the airspace col-lapse with a pulmonary shunt.36
The ventilatory strategy adopted to minimize ventilation-induced lung injury through the use of low Vt for animals from the PCV group resulted in higher PaCO2 values, com-pared to the more appropriate values observed in the HFOV group, due to the possibility of adjusting the HFOV to a target PaCO2 around 50 to 55 mm Hg. The pulmonary shunt estimated by (A-a)O2 and (a/A)O2, reflected an appropriate lung response to both ventilatory strategies, with similar re-sults during all ventilation time. Recently, new evidence has suggested a protective and therapeutic role of CO2, including an improvement in surfactant function due to a reduction of inflammatory mediators in the alveolar lavage and a reduc-tion of the intrapulmonary shunt.37,38
In spite of the use of higher PEEP values, no hemody-namic repercussions were observed in either ventilation method. In fact, these are typically associated with the use of high plateau pressures rather than elevated PEEP values.39
Hyperdynamic states have been described as being associ-ated with permissive hypercapnia;39however, this was not
Table 2 - Characterization of the hemodynamic repercussion (mean arterial systemic pressure, and heart rate), lung weight (normalized to body weight) and total protein present in alveolar lavage (normalized to body weight) in both study groups. Values given as mean ± SD
Group N MASP Heart rate Lung weight (g/kg) Protein (mg/kg)
PCV 8 79.2±4.0 199±4 5.9 ± 2.0 38.5 ± 18.6
HFOV 8 98.1±3.9 193±4 6.4 ± 2.2 47.4 ±28.1
MASP: mean arterial systemic pressure; PCV: Protective conventional ventilation; HFOV: High frequency oscillatory ventilation.
Table 3 - Alveolar architecture changes according to the type of ventilatory strategy. Abnormal alveoli were collapsed or hyperinflated. Values expressed as percentages
Group Abnormal alveoli Normal alveoli Total
PCV 43.2% 56.8% 100%
HFOV 51.5% 48.5% 100%
observed in the present study.
The lung weight, as with the total amount of protein in the alveolar lavage, indirectly reflects the intensity of the inflammatory process generated by ARDS and the method of ventilation. This, in the final analysis, indicates the dramatic modifications present in the alveolocapillary membrane in ARDS, with a corresponding loss of selectivity.40The finding
of similar values in both groups supports the observations that both ventilation methods resulted in comparable effects on the lung tissue.
Although there are reports of more frequent lung lesions in animals under conventional mechanical ventilation when compared to those under HFOV,12,23 in the present study, a
comparison of normal and abnormal alveoli suggested that the lungs were better preserved in the PCV group than the HFOV group. This difference, however, was not translated into more favorable gasometric alterations in the PCV group. This finding reinforces the concept that the approach to PCV used in this study attenuates lung lesions.
This experiment yielded two important clinical consid-erations with regards to the determination of the LIP of the PV curve in conventional mechanical ventilation. The first
is the importance of determining the adequate alveolar vol-ume at end expiration when comparing different ventilatory strategies to treat ARDS. Second is the utility of bedside monitoring of respiratory mechanics and using the LIP to adjust ventilator settings in the treatment of ARDS. Our results reinforce the idea that the development of methods for precise LIP determination during severe respiratory insufficiency can improve upon conventional mechanical ventilation by improving oxygenation and reducing ventila-tor induced lung injury.
Based on our data, we conclude that the use of conven-tional mechanical ventilation based on PEEP as determined by the LIP of the PV curve, associated with low tidal-volume as a protective strategy, is comparable to HFOV with regards to oxygenation, hemodynamic status and lung injury in this experimental ARDS model.
ACKNOWLEDGMENTS
The authors thank Dr. Marcelo B. Passos Amato and Susimeire Gomes from the Laboratory of Experimental Pneumology for their assistance during the study.
REFERENCES
1. Ashbaugh DG, Bigelow DB, Petty TL, Levine BE. Acute respiratory distress in adults. Lancet. 1967;ii:319-23.
2. Amato MB, Barbas CS, Medeiros DM, Magaldi RB, Schettino GPP, Lorenzi-Filho G, et al. Effect of a protective ventilation strategy on mortality in acute respiratory distress syndrome. N Engl J Med. 1998;338:347-54.
3. The Acute Respiratory Distress Syndrome Network: Ventilation with lower tidal volumes as compared with traditional tidal volumes for acute lung injury and the acute respiratory distress syndrome. N Engl J Med. 2000;342:1301-8.
5. Park M, Lorenzi-Filho G. Noninvasive mechanical ventilation in the treatment of acute cardiogenic pulmonary edema. Clinics. 2006;61:247-252.
6. Dreyfuss D, Saumon G. Role of tidal volume, FRC and end-inspiratory volume in the development of pulmonary edema following mechanical ventilation. Am Rev Respir Dis. 1993;148:1994-2003.
7. Dreyfuss D, Soler P, Basset G, Saumon G. High inflation pressure pulmonary edema: respective effects of high airway pressure, high tidal volume, and positive end-expiratory pressure. Am Rev Respir Dis. 1998;137:1159-64.
8. Muscedere JG, Mullen JBM, Gan K. Tidal ventilation at low airway pressures can augment lung injury. Am J Respir Crit Care Med. 1994;149:1327-34.
9. Tremblay LN, Slutsky AS. Ventilator-induced injury: from barotrauma to biotrauma. Proc Assoc Am Physicians. 1998;110:482-8.
10. Ranieri VM, Suter PM, Slutsky AS. Mechanical ventilation as a mediator of multi-system organ failure in acute respiratory distress syndrome. JAMA. 2000;284:43-4.
11. Rimensberger PC, Beghetti M, Hanquinet S, Berner M. First intention high-frequency oscillation with early lung volume optimization improves pulmonary outcome in very low birth weight infants with respiratory distress syndrome. Pediatrics. 2000;105:1202-8.
12. McCulloch PR, Forket PG, Froese AB. Lung volume maintenance prevents lung injury during high-frequency oscillation in surfactant-deficient rabbits. Am Rev Respir Dis. 1988;137:1185-92.
13. Hickling KG, Walsh J, Henderson S, Jackson R. Low mortality rate in adult respiratory distress syndrome using low-volume, pressure limited ventilation with permissive hypercapnia: A prospective study. Crit Care Med. 1994;22:1568-78.
14. Amato MBP, Barbas CSV, Medeiros DM, Schettino GPP, Lorenzi-Filho G, Kairalla RA, et al. Beneficial effects of the open lung approach with low distending pressures in acute respiratory distress syndrome. Am J Respirat Crit Care Med. 1995;152:1835-46.
15. Gerstmann DR, Minton SD, Stoddard RA, Meredith KS, Monaco F, Bertrand JM, et al. The provo multicenter early high-frequency oscillatory ventilation trial: improved pulmonary and clinical outcome in respiratory distress syndrome. Pediatrics. 1996;98:1044-57. 16. Moriette G, Paris-Llado J, Walti H, Escande B, Magny J-F, Cambonie G,
et al. Prospective randomized multicenter comparison of high-frequency oscillatory ventilation and conventional ventilation in preterm infants of less than 30 weeks with respiratory distress syndrome. Pediatrics. 2001;107:363-72.
17. Lachmann B, Robertson B, Vogel J. In vivo lung lavage as an experimental model of the respiratory distress syndrome. Acta Anaesthesiol Scand. 1980;24:231-6.
18. Takeuchi M, Goddon S, Dolhnikoff M, Shimaoka M, Hess D, Amato MBP, et al. Set positive end-expiratory pressure during protective ventilation affects lung injury. Anesthesiology. 2002;97:682-92. 19. Lowry OH, Rosenbrough NJ, Farr AL, Randall RJ. Protein measurement
with the folin phenol reagent. J Biol Chem. 1951;193:264-75. 20. Mauad T, Dolhnikoff M. Sao Paulo Bronchiolitis Obliterans Study
Group. Histology of childhood bronchiolitis obliterans. Ped Pulmonol. 2002;33:466-74.
21. Piva J, Chatrkaw P, Choong K, Frndova H, Cox P. Ventilação de alta freqüência por oscilação comparada a ventilação convencional associada a reposição de surfactante em coelhos. J.Pediatr (Rio J.). 2000;76:349-56.
22. Kolton M, Cattran CB, Kent G, Volgyesi G, Froese AB, Bryan AC. Oxygenation during high-frequency ventilation compared with mechanical ventilation in two models of lung injury. Anesth Analg. 1982;61:323-32.
23. Hamilton PP, Onayemi A, Smyth JA, Gillan JE, Cutz E, Froese AB, et al. Comparison of conventional and high-frequency ventilation: oxygenation and lung pathology. J Appl Physiol. 1983,55:131-8. 24. Rotta AT, Gunnarsson B, Fuhrman BP, Hernan LJ, Steinhorn DM.
Comparison of lung protective ventilation in a rabbit model of acute lung injury. Crit Care Med. 2001;29:2176-84.
25. Suh GY, Koh Y, Chung MP, An CH, Kim H, Jang WY, et al. Repeated derecruitments accentuate lung injury during mechanical ventilation. Crit Care Med. 2002;30:1848-53.
26. Luecke T, Meinhardt JP, Herrmann P, Weisser G, Pelosi P, Quintel M. Setting mean airway pressure during high-frequency oscillatory ventilation according to the static pressure-volume curve in surfactant-deficient lung injury. Anesthesiology. 2003;99:1313-22.
27. Hartog A, Vazquez de Anda GF, Gommers D, Kaisers U, Lachmann B. At surfactant deficiency, application of “the open lung concept” prevents protein leakage and attenuates changes in lung mechanics. Crit Care Med. 2000;28:1450-4.
28. Vazquez de Anda GF, Gommers D, Verbrugge SJC, De Jaegere A, Lachmann B. Mechanical ventilation with high positive end-expiratory pressure and small driving pressure amplitude is as effective as high- frequency oscillatory ventilation to preserve the function of exogenous surfactant in lung-lavaged rats. Crit Care Med. 2000;28:2921-5. 29. Rettwitz-Volk W, Veldman A, Roth B, Vierzig A, Kachel W, Varnholt
V, et al. A prospective, randomized, multicenter trial of high-frequency oscillatory ventilation compared with conventional ventilation in preterm infants with respiratory distress syndrome receiving surfactant. J Pediatr. 1998,132:249-54.
30. Barbas CSV, De Matos GFJ, Okamoto V, Borges JB, Amato MBP, De Carvalho CRR. Lung recruitment maneuvers in acute respiratory distress syndrome. Respir Care Clin. 2003;9:401-8.
31. Pelosi P, Gattinoni L. Acute respiratory distress syndrome of pulmonary and extra-pulmonary origin: fancy or reality? Intensive Care Med. 2001;27:457-60.
32. Rocco PRM, Zin WA. Pulmonary and extrapulmonary acute respiratory distress syndrome: are they different? Curr Opin Crit Care 2005;11:10-7.
33. Estenssoro E, Dubin A, Laffaire E, Canales HS, Sáenz G, Moseinco M, Bachetti P. Impact of positive end-expiratory pressure on the definition of acute respiratory distress syndrome. Intensive Care Med. 2003;29:1936-42.
34. TenHoor T, Mannino DM, Moss M. Risk factors for ARDS in the United States: analysis of the 1993 National Mortality Followback Study. Chest. 2001;119: 1179-84.
36. Borges JB, Okamoto VN, Matos GFJ, Caramez MPR, Arantes PR, Barros F, Souza CE, et col. Reversibility of lung collapse and hypoxemia in early acute respiratory distress syndrome. Am J Respir Crit Care Med. 2006;174:268-78.
37. Torbati D. Carbon dioxide: a “waste product” with potential therapeutic utilities in critical care. Crit Care Med. 2003;31:2705-7.
38. Kregenow DA, Swenson ER. The lung and carbon dioxide: implications for permissive and therapeutic hypercapnia. Eur Respir J. 2002;20:6-11.
39. Carvalho CRR, Barbas CSV, Medeiros DM, Magaldi RB, Lorenzi-Filho G, Kairalla RA, et al. Temporal hemodynamic effects of permissive hypercapnia associated with ideal PEEP in ARDS. Am J Respir Crit Care Med. 1997;156:1458-66.