Fisioter. Mov., Curitiba, v. 29, n. 2, p. 229-236, Apr./June 2016 Licenciado sob uma Licença Creative Commons DOI: http://dx.doi.org.10.1590/0103-5150.029.002.AO02
[T]
Comparison of respiratory mechanics measurements in the volume
cycled ventilation (VCV) and pressure controlled ventilation (PCV)
[I]
Comparação das medidas de mecânica respiratória nos
modos volume (VCV) e pressão controlada (PCV)
[A]
Kelser de Souza Kock[a], Beatriz Cardoso da Rosa[a], Natiéle Martignago[a], Cardine Reis[b], Rosemeri Maurici [b]*
[a] Universidade do Sul de Santa Catarina (Unisul), Tubarão, SC, Brazil [b] Universidade Federal de Santa Catarina (UFSC), Florianópolis, SC, Brazil
[R] Abstract
Introduction: Monitoring respiratory mechanics may provide important information for the intensivist, assisting in the early detection of pulmonary function changes of patients hospitalized in ICU. Objective: To compare measurements of respiratory mechanics in VCV and PCV modes, and correlate them with age and oxygenation index. Materials and methods: Cross-sectional study conducted in the adult ICU of the Hospital Nossa Senhora da Conceição, in Tubarão - SC. A hundred and twenty individuals were selected be-tween March and August 2013. The respiratory mechanics measurements were evaluated using compliance and resistance static measures of the respiratory system in PCV and VCV modes between the 1st and 5th day of hospitalization. Simultaneously, the oxygenation index PaO2/FiO2 was collected. Results: The obtained results were: compliance (VCV) = 40.9 ± 12.8 mL/cmH2O, compliance (PCV) = 35.0 ± 10.0 mL/cmH2O, re-sistance (VCV) = 13.2 ± 4.9 cmH2O/L/s, rere-sistance (PCV) = 27.3 ± 16.2 cmH2O/L/s and PaO2/FiO2 = 236.0
230
± 97.6 mmHg. There was statistical difference (p < 0.001) between the compliance and resistance measures in VCV and PCV modes. The correlations between the oxygenation index and compliance in VCV and PCV modes and resistance in VCV and PCV modes were, respectively, r = 0.381 (p < 0.001), r = 0.398 (p < 0.001), r = -0.188 (p = 0.040), r = -0.343 (p < 0.001). Conclusion: Despite the differences between the respiratory me-chanics measurements the monitoring using VCV and PCV modes seems to show complementary aspects.
Keywords: Mechanical ventilation. Respiratory mechanics. Intensive care.
Resumo
Introdução: A monitorização da mecânica respiratória pode fornecer informações importantes para o intensivis-ta, auxiliando na detecção precoce de alterações da função pulmonar do paciente hospitalizado em UTI. Objetivo: Comparar medidas de mecânica respiratória nos modos VCV e PCV, e correlacioná-las com a idade e índice de oxigenação. Materiais e Métodos: Pesquisa transversal realizada na UTI adulto do Hospital Nossa Senhora da Conceição, localizado em Tubarão – SC. Foram selecionados 120 indivíduos hospitalizados entre março e agosto de 2013. As medidas de mecânica respiratória foram realizadas através de medidas estáticas da complacência e resistência do sistema respiratório nos modos VCV e PCV, entre o 1º e o 5o dia de internação. Simultaneamente à medida da mecânica respiratória, foi coletado o índice de oxigenação PaO2/FiO2. Resultados: Os resultados obtidos foram: complacência (VCV) = 40,9 ± 12,8 mL/cmH2O, complacência (PCV) = 35,0 ± 10,0 mL/cmH2O, re-sistência (VCV) = 13,2 ± 4,9 cmH2O/L/s, rere-sistência (PCV) = 27,3 ± 16,2 cmH2O/L/s e PaO2/FiO2 = 236,0 ± 97,6 mmHg. Houve diferença estatística (p<0,001) entre as medidas de complacência e resistência nos modos VCV e PCV. As correlações entre o índice de oxigenação e a complacência nos modos VCV e PCV e resistência nos modos VCV e PCV foram, respectivamente, r = 0,381 (p < 0,001), r = 0,398 (p < 0,001), r = -0,188 (p = 0,040), r = -0,343 (p < 0,001). Conclusão: Apesar das diferenças encontradas entre as medidas de mecânica respiratória, a monitor-ização através dos modos VCV e PCV parece demonstrar aspectos complementares.
Palavras-chave: Respiração artificial. Mecânica respiratória. Terapia intensiva.
Introduction
Mechanical ventilation can be defined as a tech -nique of artificial respiration, mainly for respiratory rescue intervention in patients unable to maintain ventilatory demand, in patients under anesthesia, or as a strategy for energy saving in severely ill pa-tients. Used since the early twentieth century, it has greatly evolved in recent years, through the acquired knowledge related to the interaction between the cardiopulmonary and respiratory mechanics and computer and electronic revolution (1).
However, this type of ventilatory support can also cause changes in the cardiopulmonary dynamics, due to its non-physiological operation. Changes are de-scribed in the cardiovascular system, inflammatory lung injury induced by mechanical ventilation, oxygen toxicity, barotrauma, traumatic complications for the management of artificial airway and lung infection (2).
From this perspective, knowledge of respiratory mechanics can facilitate the detection of changes
in the respiratory status and allow a proper set of the ventilation parameters, as well as promote adequate therapeutic intervention to the patient (3). As it is performed at bedside, it does not in-volve patient transport and has no financial cost for its implementation.
The respiratory mechanics measuring methods can be performed in a dynamic or static manner. In the dynamic measurement, when the flow is not in -terrupted, the mechanical ventilator uses the curves combining the equation of motion. In the static moni-toring the flow is stopped, obtaining directly the value of lung compliance and airway resistance (4).
231
Another important parameter, initially designed for acute respiratory distress syndrome (ARDS), is the relative arterial oxygen pressure, fraction of in-spired oxygen (PaO2/FiO2). Nowadays, this blood oxygenation index is used routinely as hypoxic gravity parameter in critically ill patients. It is assessed by arterial blood gases and oxygenation level (FiO2) set on mechanical ventilation (6).
Thus, the objectives of the study were to com-pare the respiratory mechanics measurements in the VCV (Volume Cycled Ventilation – Volume Controlled Ventilation) and PCV (Pressure Controlled Ventilation) modes and correlate them with age and oxygenation index PaO2/FiO2.
Materials and methods
It was a cross-sectional study conducted in the adult ICU of the Hospital Nossa Senhora da Conceição (HNSC), in Tubarão - SC. Hospitalized individuals were selected from March to August 2013, between the 1st and 5th day of ICU admission, who needed in-vasive ventilatory support and whose family mem-bers signed an informed consent form. The research project was submitted and approved by the Research Ethics Committee from the Universidade do Sul de Santa Catarina (12.460.4.08.III).
The resistance and compliance of the respiratory system were evaluated in the VCV and PCV modes. The patient should be sedated according to the Ramsay scale from 5 to 6 (7), and the ones who had respiratory drive were excluded.
Height and weight were assessed directly, using a tape, and indirectly, using equations, respectively (8):
Men: Weight (kg) = 50 + 0.91 x (height in cm – 152.4) Women: Weight (kg) = 45.5 + 0.91 x (height in cm – 152.4)
For the respiratory mechanics data the parameters set in the PCV mode by the intensivists, according to the ICU routine, were recorded. The respiratory rate was maintained or changed (RR) to 14 cycles/min and the inspiration: expiration ratio to 1:2. Subsequently, the PCV mode was switched to the VCV mode using the inspiratory pause of 1 second, to obtain the pla-teau pressure. After 3 minutes the parameters were recorded and returned to the initial ventilation mode. Simultaneously, the oxygenation index PaO2/FiO2 was collected. A single measurement was performed on each patient.
The respiratory mechanics were evaluated ac-cording to (9):
PCV mode:
CRS = VT
Pinsp - PEEP
RRS = Pinsp - PEEP
Vmax1.75
VCV mode:
C = V P - PEEP
R = P- P V
Where,
Crs= Respiratory system compliance (ml/cmH2O)
Rrs = Respiratory system resistance (cmH2O/L/s)
VT = Tidal volume (ml)
PPeak= Peak pressure (cmH2O)
PPlateau = Plateau pressure (cmH2O)
V = Inspiratory flow (L/s)
Pinsp = Inspiratory pressure (cmH2O)
PEEP = Positive end-expiratory pressure (cmH2O)
Vmax = Maximum inspiratory flow (L/s)
Data was stored and analysed using Excell® and SPSS 20.0® softwares, respectively, and expressed by absolute numbers, percentages, central tendency and dispersion measures. The compliance and resis-tance of the respiratory system in the PCV and VCV modes were compared using the Mann-Whitney U test (p < 0.05). Pearson's correlation (p < 0.05) was used between the oxygenation index and respiratory mechanics values in the PCV and VCV modes.
Results
Between March 3rd, 2013 and August 25th, 2013, 184 hospitalized patients were evaluated in the Hospital Nossa Senhora da Conceição ICU, in Tubarão – SC. Eighteen patients were excluded for having respiratory drive or not being well sedated.
Of the 166 analyzed individuals, 100 (60.2 %) were male and 66 were female (39.8 %), with mean age of 60.0 ± 18.6 years old, height of 175.8 ± 179 cm and ideal weight of 71.3 ± 16.3 kg. The leading causes for hospitalization were: circulatory (34.9%) and respiratory diseases (16.9%), injuries, poi-soning and other consequences of external causes (8.4%), digestive tract disease (7.2%), and others
.
.
.
232
Figure 1 – Correlation between PaO2/FiO2 and compliance - VCV. r =0.381; p < 0.001
Note: Source: Elaborated by the authors, 2013.
(31.6%). The severity classification in the first 24 hours of admission, assessed by the APACHE II, was of 27.8 ± 6.7 points, with a minimum of 8 and maximum of 47. The mainly mechanical ventilators used were servo S® (74.2 %), servo 900® (16.7%) and Dixtal® (9.2%).
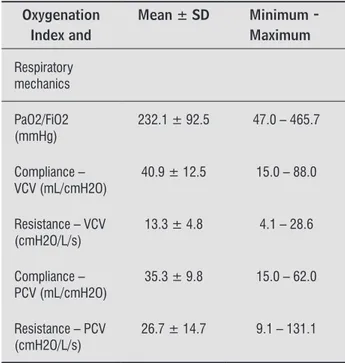
A hundred and sixty-six respiratory mechanics measurements were carried out between the 1st and 5th day of ICU admission, being one per patient. The respiratory mechanics values in the PCV and VCV modes and oxygenation index are shown in Table 1.
Table 1 - Respiratory mechanics and oxygenation index
Oxygenation Index and
Mean ± SD Minimum - Maximum
Respiratory mechanics
PaO2/FiO2 (mmHg)
232.1 ± 92.5 47.0 – 465.7
Compliance – VCV (mL/cmH2O)
40.9 ± 12.5 15.0 – 88.0
Resistance – VCV (cmH2O/L/s)
13.3 ± 4.8 4.1 – 28.6
Compliance – PCV (mL/cmH2O)
35.3 ± 9.8 15.0 – 62.0
Resistance – PCV (cmH2O/L/s)
26.7 ± 14.7 9.1 – 131.1
Note: Source: Elaborated by the authors, 2013.
By correlating the compliance values of the VCV and PCV modes, it was observed a statistical sig-nificant (p < 0.001) and strong positive correlation (r = 0.83). When correlating the resistance in the VCV and PCV modes, it was observed a statistical significant (p < 0.001) and weak positive correlation (r = 0.28). Comparing these variables from another point of view, it was demonstrated a statistically sig-nificant difference (p < 0.001) between the compliance and resistance measures in the VCV and PCV modes.
The correlations among the PaO2/FiO2, compli-ance and resistcompli-ance in the PCV and VCV modes are shown in Figures 1, 2, 3 and 4.
100,0 90,0 80,0 70.0 60,0 50,0 40,0 30,0 20,0 10,0 0,0
0,00 100,0 200,00 300,00 400,00 500,00
PaO2/FiO2(mmHg)
Figure 2 - Correlation between PaO2/FiO2 and compliance - PCV. r = 0.398; p < 0.001
Note: Source: Elaborated by the authors, 2013.
40,0 35,0
30,0 25,0
20,0 15,0
10,0 5,0 0,0
0,00 100,0 200,00 300,00 400,00 500,00
PaO2/FiO2(mmHg)
Figure 3 – Correlation between PaO2/FiO2 and resistance – VCV r = -0.188; p = 0.040
Note: Source: Elaborated by the authors, 2013.
70,0
60,0
50,0
40,0
30,0
20,0 10,0 0,0
0,00 100,0 200,00 300,00 400,00 500,00
233
oxygenation. However, there is no evidence to sup-port that data. Pinheiro et al. (13), in seven canine models with induced lung injury, found no significant differences in the oxygenation, both in VCV and PCV modes. On the other hand, Cadi1 et al. (14) evaluated 36 patients using mechanical ventilation during lapa-roscopic bariatric surgery, and demonstrated that the PCV mode showed oxygenation indexes and blood gas parameters higher than the VCV mode.
However, in Garneroa et al. (15) review, which discusses the evidence and ventilation peculiarities in VCV and PCV modes, the researchers comment that there is no superiority of one mode. There are advantages and disadvantages. For example, in the PCV mode, they can prevent lung overdistention by limiting the peak pressure and reducing ventilatory asynchrony, but the control of the tidal volume and the blood pressure values of carbon dioxide (PaCO2) is variable, making the VCV mode a better choice for this case. The authors finish describing the impor -tance of distinguishing the choice of ventilation mode according to the patient's condition and his lung me-chanics. In individuals who require strict control of PaCO2 levels, and patients with respiratory acidosis, it would be interesting the management in VCV and, in those cases, that need a lung protective strategy to control the peak pressure, as in ARDS, it would be indicated the PCV mode.
When correlating age with oxygenation index and respiratory mechanics, it was also observed physi-ological aspects of aging, with negative association between age and the oxygenation index and compli-ance - PCV and positive association with resistcompli-ance - VCV. Ruivo et al. (16) compared pulmonary function measurements in 35 elderly and 35 young people using spirometry. The researchers found significant differences between the forced vital capacity (FVC) and forced expiratory flow between 25 and 75% of FVC, which is related to expansion/compliance and pulmonary resistance, respectively. In a review by Fernandes and Ruiz Neto (17) of anesthetic compli-cations in elderly patients, low oxygenation and care for mechanical ventilation is discussed. These data corroborate the present study, indicating reduced lung function with aging.
Classically, these measurements are done in the VCV mode, with a square flow waveform and in -spiratory pause of 1-2 seconds (4). However, it has been proposed to monitor respiratory mechanics by the PCV mode, using algebraic manipulation of Figure 4 - Correlation between PaO2/FiO2 and resistance – PCV
r= -0.343; p < 0.001
Note: source: Elaborated by the authors, 2013.
Age correlated with the PaO2/FiO2 index (r = -0.183; p = 0.043), with compliance in the PCV mode (r = -0.180; p = 0.049) and resistance in the VCV mode (r = 0.206; p = 0.024).
Discussion
Respiratory mechanics data revealed difference when measured by different methods. Although there are strong positive correlations in the compliance measures in the VCV and PCV modes, the same did not occur for the resistance. The compliance measures seemed to be underestimated and the resistance val-ues overestimated when monitored in the PCV mode compared to the VCV mode.
However, when correlating the respiratory me-chanics data with the oxygenation index, there was a slightly greater association in the PCV mode than in the VCV mode. This can be mostly related to the characteristics of the inspiratory flow in the two ventilation methods. While in the VCV mode flow is generally used in a square shape, practically con-stant, in the PCV mode it is variable with the shape resembling a triangle with an initial peak flow and almost linear fall (5, 9). These aspects of air inlet in the respiratory system generate different pressure curves, which are closely related to the diffusivity of gases in the alveolar-capillary level. Then, the fact that the pressure may remain more constant over time in the VCV mode may provide greater gas exchange and correlate better with the oxygenation index.
This fact is widely discussed in other studies (10, 11, 12)presenting theoretical justifications for the PCV mode superiority in improving ventilation and
140,0
120,0
100,0
80,0
60,0
40,0
20,0
0,0
0,00 100,0 200,00 300,00 400,00 500,00
234
individuals. The Cst was monitored by esophageal balloon before the ventilatory support. The cutoff was set to 25 ml/cmH2O for individuals with low and high compliance. In conclusion, the group with Cst > 25ml/cmH2O presented favorable aspects, with statistical difference for the incidence of pneumonia associated with mechanical ventilation, need for in-tubation, tracheostomy, mortality, time in mechanical ventilation and ICU, when compared to the group with low pulmonary compliance.
Regarding this study limitation it should be noted that the respiratory mechanics measurements were performed in patients with sedation, but not with neuromuscular blocker. This may have influenced the measures, even with imperceptible respiratory drive.
Conceptually, the pressure applied to the respira-tory system (PRS) depends on the ventilatory pressure (PV) and muscle pressure (Pmus) (28, 29). So, to calcu-late correctly the respiratory mechanics variables it is necessary that the (PRS) depends only on the (PV), i.e., the (Pmus) should be excluded. In practical terms, a necessary condition for the patient not to actively participate in the breath.
So, to perform these measures the patient should preferably be sedated and paralyzed. In order to avoid discomfort for the hospitalized patient in intensive care, Ramsay et al. (7) proposed a scale that grades the level of sedation. The scale is from one to six, cor-responding to a lot or little sedation, respectively. According to Wit et al. (30) the level of sedation reduc-es rreduc-espiratory muscle effort, reducing or canceling the participation of the individual in the respiratory cycle.
Conclusion
Monitoring of respiratory mechanics performed in VCV and PCV modes showed some peculiarities, perhaps indicating the non-linearity of these vari-ables or the complementary aspect of them. In this sense, it is recommended to use these measures in the two ventilation modes for more information on the patient ventilatory status.
The results showed that respiratory mechanics adjusted to the physiological aspects of oxygen dif-fusion, implying favorably in its routine use as ad-ditional information about the lung condition in ICU patient admission.
The authors believe that this measure provides data on lung function and can describe the mechanics the motion equation and conversion of the
nonlin-ear down flow to linnonlin-ear flow (9). The results of this study, assessing 12 mechanically ventilated individu-als, showed strong correlation between compliance and resistance measures in VCV and PCV modes (r2 = 0.73 and r2 = 0.51, respectively).
In the same study (9), the mean values in the VCV mode were 36.93 ± 12.18 mL/cm H2O for compli-ance, and 12.50 ± 2.99 cmH2O/L/sec for resistance. However, the normal range is described with a wide range of variation, comprising 50 to 100 mL/cmH2O for compliance and between 2 and 5 cmH2O/L/sec for the respiratory system resistance (18).
In some cases, such as ARDS, compliance can be reduced (35 to 44 mL/cmH2O) and the resistance increased (12 and 15 cmH2O/L/sec). And in patients with obstructive pulmonary disease the compliance (66 mL/cmH2O) and resistance are increased (26 cmH2O/L/sec) (19).
The main applications for respiratory mechanics monitoring are for patients with obstructive pulmo-nary diseases (16) and ARDS (20). Some studies also discuss the importance of these measures in patients with pulmonar fibrosis (21) or with the human im -munodeficiency virus (HIV) and pneumonia (22).
In obstructive pulmonary diseases, the flow versus volume curve provides information about the airway patency and the complacency (CRS) and resistance (RRS) product of the respiratory system that originates the time constant (τ), related to the expiratory time to deflate. Thus, as one of the main problems in obstructive diseases is hyperinflation, the respiratory mechanics monitoring is very impor-tant to avoid air trapping, which would lead to an increased intrinsic positive end-expiratory pressure and respiratory work (19, 23, 24).
In ARDS the pressure versus volume curve analy-sis asanaly-sists the respiratory monitoring, as well as the calculation of (CRS) helps to choose the best PEEP and FiO2 (20, 25). In pulmonary fibrosis, the low (CRS) is associated with hypoventilation and hypercapnia (21, 26). In individuals with HIV and pneumonia, changes in lung mechanics are similar to patients with ARDS, i.e., low (CRS) and (CRS) (22).
235 11. Muñoz J, Guerrero JE, Escalante JL, Palomino R, De
La Calle B. Pressure-controlled ventilation versus controlled mechanical ventilation with decelerating
inspiratory flow. Crit Care Med. 1993; 21(8):1143-8.
12. Abraham E, Yoshihara G. Cardiorespiratory effects of pressure controlled ventilation in severe respiratory failure. Chest. 1990; 98(6):1445-9.
13. Pinheiro BV, Holanda MA, Larges CM, Beppu OS. Ven-tilação mecânica volume-controlada versus pressão controlada em modelo canino de lesão pulmonar aguda: efeitos cardiorrespiratórios e sobre o custo de oxigênio da respiração. J Pneumol. 2002; 28(1):15-22.
14. Cadi1 P, Guenoun T, Journois D, Chevallier JM, Diehl JL, Safran D. Pressure-controlled ventilation improves oxygenation during laparoscopic obesity surgery compared with volume-controlled ventilation. Br J Anaesth. 2008; 100(5):709–16.
15. Garneroa AJ, Abbonab H, Gordo-Vidal F, Hermosa-Gel-bardc C. Pressure versus volume controlled modes in invasive mechanical ventilation. Med Intensiva. 2013; 37(4):292-8.
16. Ruivo S, Viana P, Martins C, Baeta C. Efeito do envel-hecimento cronológico na função pulmonar. Compa-ração da função respiratória entre adultos e idosos saudáveis. Rev Port Pneumol. 2009;15(4):629-53.
17. Fernandes CR, Ruiz Neto PP. Sistema Respiratório e o Idoso: Implicações Anestésicas. Rev Bras Anestesiol. 2002; 52(4): 461-70.
18. Sarmento, G. Fisioterapia respiratória no paciente crítico: rotinas clínicas. Barueri: Manole; 2005.
19. Dhand R. Ventilator Graphics and Respiratory Me-chanics in the Patient With Obstructive Lung Disease. Respir Care. 2005; 50(2):246-61.
20. Koutsoukou A, Perraki H, Orfanos SE, Koulouris NG, Tromaropoulos A, Sotiropoulou C, Roussos C. History of mechanical ventilation may affect respiratory me-chanics evolution in acute respiratory distress syn-drome. J Crit Care. 2009; 24(4):626.e1– 626.e6.
21. Nava S, Rubini F. Lung and chest wall mechanics in ventilated patients with end stage idiopathic
pulmo-nary fibrosis. Thorax. 1999;54(5):390-5.
of chronic respiratory diseases and its exacerbations. It is hoped that other studies use this information about respiratory mechanics for prognosis and clini-cal management of mechaniclini-cally ventilated patients in the ICU.
References
1. Hamed HMF, Ibrahim HG, Khater YH, Aziz ES. Ventilation and ventilators in the ICU: What very intensivist must know. Curr Anaesth Crit Care. 2006; 17(1-2):77-83.
2. Sandur S, Stoller JK. Pulmonary complications of mechanical ventilation. Clin Chest Med. 1999; 20(2): 223-47.
3. Polak AG. Analysis of multiple linear regression al-gorithms used for respiratory mechanics monitoring
during artificial ventilation. Comput Meth Prog Bio.
2011; 101(2):126-34.
4. Lucangelo U, Bernabe F, Blanch L. Respiratory Me-chanics Derived From Signals in the Ventilator Circuit. Respir Care. 2005; 50(1):55-67.
5. Jubran A. Monitoring patient mechanics dur-ing mechanical ventilation. Crit Care Clin. 1998; 14(4):629-53.
6. Sánchez Casado M, Díaz Q, Palacios D, Hortigüela V, Schul-ke CM, García J, et al. Relación entre el gradiente alveolo-arterial de oxígeno y la PaO2/FiO2 introduciendo la PEEP en el modelo. Med Intensiva. 2012; 36(2):329-34.
7. Ramsay MA, Savege TM, Simpson BRJ, Goodwin R. Controlled sedation with alphaxalone-alphadolone. Br Med J. 1974; 2(5920):656-9.
8. Ventilation with lower tidal volumes as compared with traditional tidal volumes for acute lung injury and the acute respiratory distress syndrome. N Engl J Med. 2000; 342(18):1301-8.
9. Nassar BS, Collett ND, Schmidt GA. The flow-time waveform predicts respiratory system resistance and compliance. J Crit Care. 2012; 27(4):418.e7–418.e14.
236
27. Matic I, Pavicic F, Sakic-Zdravcevic K, Danic D, Jurjevic M. Pulmonary Compliance Values Provide Prognosis in Mechanically Ventilated Patients - A Randomized Prospective Study. Coll Antropol. 2007; 31(3):829-36.
28. Henderson, WR, Sheel AW. Pulmonary mechanics dur-ing mechanical ventilation. Respir Physiol Neurobiol. 2012; 180(2-3):162-72.
29. Grinnan DC, Truwit JD. Clinical review: Respiratory mechanics in spontaneous and assisted ventilation. Crit Care. 2005; 9(5):472-84.
30. Wit M, Pedram S, Best AM, Epstein SK. Observational study of patient-ventilator asynchrony and relation-ship to sedation level. J Crit Care. 2009; 24(1):74-80.
Received: 06/13/2014
Recebido: 13/06/2014
Approved: 08/14/2015
Aprovado: 14/08/2015 22. D'Angelo E, Calderini E, Robatto FM, Puccio P,
Milic-Emili J. Lung and chest wall mechanics in patients
with acquired immunodeficiency syndrome and se -vere Pneumocystis carinii pneumonia. Eur Respir J. 1997; 10(10):2343–50.
23. Antonaglia V, Ferluga M, Capitanio G, Lucangelo U, Piller F, Roman-Pognuz E, Biancardi B, Caggegi GD, Zin WA. Respiratory mechanics in COPD patients who failed non-invasive ventilation: role of intrinsic PEEP. Respir Physiol Neurobiol. 2012 Oct 15;184(1):35-40.
24. Carvalho CRR, Toufen Junior C, Franca SA. III Consenso Brasileiro de Ventilação Mecânica: Ventilação
mecâni-ca: princípios, análise gráfica e modalidades venti -latórias. J Bras Pneumol. 2007; 33(Supl 2):S54-S70.
25. Loring SH, Malhotra A. Driving pressure and respira-tory mechanics in ARDS. N Engl J Med. 2015 Feb 19; 372(8):776-7.
26. Wesołowski S, Meleniewska-Maciszewska A,
Korzeniewska-Koseła M, Kuś J, Radwan L. Dyspnea, respiratory mechanics
and gas exchange in patients with idiopathic pulmonary