Institute of Orthopedics and Traumatology, Hospital das Clínicas, São Paulo University Medical School - São Paulo/SP, Brazil.
Email: [email protected]
Received for publication on August 31, 2005. Accepted for publication on November 28, 2005.
ORIGINAL RESEARCH
ONCOLOGIC PROGRESSION OF BONE
PLASMACYTOMAS TO MULTIPLE MYELOMA
Fernanda Bertanha, Gabriela Boufelli, Olavo Pires de Camargo, André Mathias Baptista, Marcelo Tadeu Caiero, Claudia Regina GCM de Oliveira, and Renée Filippi
Bertanha F,Boufelli G,Pires de Camargo O, Baptista AM, Caiero MT, de Oliveira CRGCM,et al. Oncologic progression of bone plasmacytomas to multiple myeloma. Clinics. 2006:61(2):139-46.
PURPOSE: To evaluate the clinical aspects, diagnoses, prognostic factors, and percent progression of plasmacytoma to multiple myeloma.
MATERIALS AND METHODS: 103 medical records of patients suspected of plasmacytoma were surveyed covering the period between 1950 and 1998, and 30 were selected for analysis. Patients were classified into 2 groups: patients who did (n = 17) and did not (n = 13) progress to multiple myeloma. Comparative statistics regarding a variety of clincial aspects were developed.
RESULTS: Patients who progressed to multiple myeloma were younger than those who did not (52.3 ± 2.6 vs 62.6 ± 3.4 years; mean ± SEM; P = 0.02). There were no significant differences in gender between groups. A higher incidence of multiple recurrence
was observed in patients who progressed to multiple myeloma (75%, P = 0.049). Both groups showed a prevalence of vertebral
column injuries. No significant differences were found between groups regarding the disease period (from the onset of symptoms until diagnosis) (P = 0.20) and survival (P = 0.34). The average time to progression from plasmacytoma to myeloma was 41 ± 39
months (mean ± SD), and the progression rate was 57%.
CONCLUSION: Patients who progressed to multiple myeloma were younger than those who did not. No significant differences were found between groups regarding sex, time from symptom onset to diagnosis, and survival time. In both groups, the most affected anatomic location was the vertebral column, and most affected sex was male. The average time to progression to multiple myeloma was 41 months. It was not possible to determine the factors that influenced the survival of patients with plasmacytoma or for those who progressed to multiple myeloma.
KEYWORDS: Plasmacytoma. Multiple myeloma. Clinical progression. Prognosis. Plasma cells.
INTRODUCTION
MacIntyre1 described in 1850 the first case of
Molli-ties et Fragilitas Ossium, and in 1873 Rustizky2 wrote the
first definitive pathological description of the disease, pro-posing the name myeloma, which was consolidated by Kahler3 in 1889. Multiple myeloma was recognized as
hav-ing a combination of indicators, includhav-ing osseous
deform-ity, fragility and pain, cachexia, and Bence Jones protein in the urine.
Later, the use of radiography facilitated diagnosing the disease. Radiographic evaluation showed that the disease is characterized by well-defined osteolytic areas without the presence of bone proliferation or sclerosis.
The probable origin of plasmacytoma relates to muta-genic changes in the development of the B lymphocyte. Possibly, initial oncogenic mutations appear and establish themselves during the late periods of lymphocytic devel-opment (these lymphocytes multiply in large scale, form-ing clones, and their characteristics may also be stored in memory cells). The plasmocyte that originated from a mu-tated lymphocyte and had its characteristics altered then accommodates in the bone marrow.4 Radiation may induce
mutations that activate oncogenes, leading to the develop-ment of multiple myeloma. This has been observed with the increased incidence of myeloma in Hiroshima atomic bomb survivors and in radiologists.5,6 Cytogenetical
stud-ies in patients with multiple myeloma showed that 68% of samples presented numerical chromosomal alterations (62%), structural alterations (31%), or both (7%).7
Multiple myeloma is generally associated with the pro-duction by tumor cells of IgG or IgA monoclonal immu-noglobulin or of light chains (Bence Jones protein), while the polypeptidic M protein can be detected in serum and/ or urine using immunohistochemical techniques.
As to incidence, in a review of cases of multiple my-eloma studied between 1950 and 1975 in the USA, Blattner et al8 found an incidence of 2 or 3 cases of multiple
my-eloma per 100,000 people, with highest incidence among African American, whose mortality rate was also twice that reported for Caucasians.9 According to the SEER Program,
multiple myeloma is responsible for 1.0% of all malignan-cies in Caucasians and 2% in African Americans. The yearly average (1970 US standard) incidence per 100,000 was 4.7 in Caucasian males and 3.2 in Caucasian females, while for African Americans incidence was nearly doubled, with 10.2 for men and 6.7 for women.10
In general, myeloma occurs in patients over 40, often between 50 and 70 years of age.9 Around 1973, most cases
were in the 70 to 80 year age group, with no significant numbers of patients under 40 years of age.5 This difference
is due to the improvement in diagnosis enabling patients to discover their disease earlier. Recently, computerized tomography and nuclear magnetic resonance imaging have detected abnormalities in bones that were deemed normal by simple radiographs.11
In the absence of treatment, the prognosis for multiple myeloma survival is lower than 2 years. Patients will even-tually die due to renal failure, severe anemia, infections, or complications secondary to neurologic problems.9,12
Plasmacytoma or solitary myeloma is characterized by a single focus, generally in a long bone or a vertebral body. The difference between solitary myeloma and multiple myeloma is that the former does not present other radiologically proven lesions and does present an absence
of changes in dysproteinemia and in proteinuria, as well as a negative biopsy from the sternal medulla.9 Other
cri-teria are the absence of anemia, absence of hypercalcemia, and absence of renal involvement.11,13 Plasmacytoma may
involve any bone, but it is more common in vertebrae (33.3% of patients).11,15 Plasmacytoma is more common in
men. The age at the time of diagnosis has been reported to be less than the age of typical multiple myeloma pa-tients11,14-15 (Figure 1). The therapeutic results are better and
the prognosis is more favorable for plasamcytoma than for multiple myeloma.14
As to treatment, radiotherapy is the first modality used for plasmacytoma. The recommended dose of radiation is 5000-6000 cGy for 5 to 7 weeks. Regarding chemotherapy, Holland et al16 reported that it delays the conversion time
of plasmacytoma to myeloma. With chemotherapy, the av-erage time to conversion was 59 months, versus 29 months in the group without chemotherapy; however, its use did not reduce the conversion rate, since 64% of patients who received chemotherapy converted to myeloma, while 41% of patients who did not receive chemotherapy presented conversion. Moreover, after conversion, patients who re-ceived chemotherapy had the same survival time as patients who did not receive this therapy.16 Currently, surgery is also
used as well as a combination of chemotherapy and radio-therapy.9
Another recent type of treatment is the autologous stem cell transplant, with a faster response rate and a longer dis-ease-free survival time than with the conventional form of chemotherapy (alkylating agents or vincristine, doxorubicin and dexamethasone [VAD] alone) .17 Stem cell transplant
is a form of treatment for patients over 65 years of age (50% of the patients with multiple myeloma) because high-dose chemotherapy is not recommended for these patients, due to age.18,19
The treatment for multiple myeloma has undergone 2 therapeutic advances, namely, the introduction of high-dose
chemotherapy, which has proved to be more effective than conventional chemotherapy, and the use of biphosphonates, which decrease the odds ratio for vertebral fracture.20
In a study published by Bataille and Sany,13 53% of
pa-tients with plasmacytoma progressed to multiple myeloma, with the average progression time being 31 months. In some patients, the progression occurred only 17 years later.16 The 10-year survival reached 68.5% for the cases
of plasmacytoma.21 This average survival time was better
than that found for patients with multiple myeloma who were given alkylating agents only (average: 20 months)22
or a combination of antineoplastic drugs (average: 42 months).13,23
According to the clinical staging system developed by Durie and Salmon,10,13,24 the prognosis for survival is
bet-ter for patients with plasmacytoma than for patients with Phase I multiple myeloma. Over a 10-year follow-up pe-riod, 85% of patients with plasmacytoma presented recur-rences, either local, remote, or multiple, the latter being responsible for 58% of the episodes.13,24 Although most
pub-lications mention that only 15% of patients with plasma-cytoma remain stable for over 10 years, there is evidence that about one third of patients remain free of multiple myeloma for 10 years.11,25-28 Among the prognostic factors
are age, size of the injury, persistence of altered immunoglobulins after radiotherapy, axial injury, early di-agnosis, and the treatment employed.14
Currently there are no studies in Brazil about the pro-gression of plasmacytoma to multiple myeloma; hence the need for our study that aims to provide clinical and epide-miological data obtained in our service concerning this neo-plasia.
MATERIALS AND METHODS
A retrospective evaluation was performed that included 103 medical records of patients with anatomic pathologi-cal diagnosis for bone plasmocytosis between 1950 and 1998.
The parameters considered were age, sex, anatomic lo-cation, time of symptom onset, time to start of treatment, type of treatment given, type of recurrence, time and rate of progression to multiple myeloma, and survival time. Sixty-three medical records were not used because of hav-ing been lost to follow-up or for incompleteness; 10 were not used because the disease in question was not plasma-cytoma (4 of them were already multiple myeloma at the time of diagnosis, and the others were cases of neuropa-thy, falciform anemia, reactional plasmocytosis, non-Hodg-kin’s lymphoma, and subacute osteomyelitis). Thirty medi-cal records were used in the statistimedi-cal analysis.
The statistical analysis included absolute (n) and rela-tive (%) frequency distribution of the qualitarela-tive nominal parameters. The nominal sample data were presented as contingency tables for chi-square analysis (Table 1) and by means of sector graphs. For the comparison of frequencies between occurrences we used Fisher’s exact test. (tables 1 and 2; figures 2 and 3). To describe samples of the quanti-tative ordinal parameters, we used descriptive statistics: mean (M), standard deviation (SD), standard error of the mean (SEM), maximum and minimum values, and the number of cases (N). Ordinal data were presented in sta-tistical tables and represented by column graphs (mean ±
Table 1 - Type of recurrence of primary tumors in patients with plasmacytoma that progressed to myeloma (absolute and relative (%) frequency distribution)
Type of Recurrence Myeloma
n %
Local 1 6.2
Multiple 12 75
Remote 3 18.8
TOTAL 161 100
1 not referred to in the medical record Chi square c2 = 6.0P = 0.049*
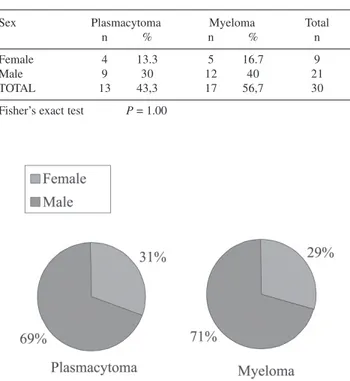
Figure 2 - Sex in patients with plasmacytoma and in patients with
plasmacytoma that progressed to multiple myeloma (absolute and relative (%) frequency distribution)
Table 2 - Sex of patients with plasmacytoma vs patients with plasmacytoma that progressed to multiple myeloma (absolute and relative (%) frequency distribution)
Sex Plasmacytoma Myeloma Total
n % n % n
Female 4 13.3 5 16.7 9
Male 9 30 12 40 21
TOTAL 13 43,3 17 56,7 30
SEM) (tables 3, 4, 5, 6, and Figures 1, 4, 5, 6). To com-pare average values (means), we used the Mann-Whitney U test in case of samples with a nonparametric distribu-tion, and Student’s t test for parametric samples.
Spearman’s nonparametric correlation test (r) was
per-formed on the ordinal parameters survival time (months) and age (years). (Table 7). Qualitative nominal sample data such as anatomic location and type of treatment were pre-sented in descriptive tables, with no statistical analysis (ta-bles 8 and 9; figures 7 and 8). A 5% significance level (a
Figure 3 - Absolute and relative (%) frequency distribution of the type of recurrence of primary tumors in patients with plasmacytoma that progressed to multiple myeloma
Table 3 - Time (days) from symptom onset until diagnosis in patients with plasmacytoma vs patients with plasmacytoma that progressed to multiple myeloma
PERIOD OF DISEASE (days)
PLASMACYTOMA MYELOMA
MEAN 182.0 362.8
SD 191.8 469.5
SEM 53.2 130.2
MAX 735.0 1835.0
MIN 31.0 8.0
N 13 131
1 not referred to in the medical chart
Mann-Whitney U test U = 59.0 P = 0.20
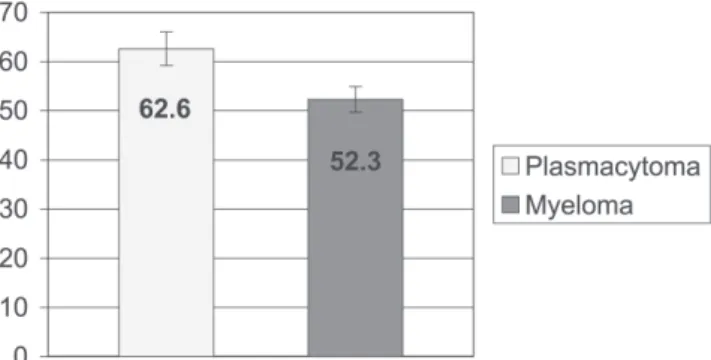
Table 4 - Age (in years) in patients with plasmacytoma at the time of the first visit vs patients with plasmacytoma that progressed to multiple myeloma
Age (years)
Plasmacytoma Myeloma
Mean 62.6 52.3
SD 12.2 10.9
SEM 3.4 2.6
MAX 85 69
MIN 47 27
N 13 17
Student’s t test t = 2.4 P = 0.02*
SD = standard deviation. SEM = standard error of the mean. N = number of patients
Table 5 - Survival time (in months) in patients with plasmacytoma vs patients with plasmacytoma that progressed to multiple myeloma
SURVIVAL TIME (months)
PLASMACYTOMA MYELOMA
Mean 57.4 78.1
SD 49.9 64.8
SEM 15 16.7
MAX 136 220
MIN 6 12
N 111 151
1 not referred to in the medical record
Mann-Whitney U test U = 63.5 P = 0.34 SD = standard deviation. SEM = standard error of the mean
Figure 5 - Survival time (months) in patients with plasmacytoma and in patients with plasmacytoma that progressed to multiple myeloma (descriptive statistics)
Figure 4 - Time (days) from first presentation with symptoms until diagnosis in patients with plasmacytoma and in patients with plasmacytoma that progressed to multiple myeloma (descriptive statistics)
Table 6 - Progression time (months) in patients with plasmacytoma that progressed to multiple myeloma (descriptive statistics)
Plasmacytoma to Multiple Myeloma
Mean 41
SD 38.8
SEM 10
MAX 120
MIN 1.5
N 151
= 0.05) and 2-tailed tests were adopted. Results were rounded according to scientific criteria. For the statistical analysis we used the 2002 Microsoft Excel software (Microsoft Corporation) and the 1996 GraphPad Prism V.2.01 (GraphPad Software Inc.).
RESULTS
The average age at diagnosis of patients who progressed to multiple myeloma was less than that of patients who did not progress (52.3 ± 2.6 vs 62.6 ± 3.4 years (mean ± SEM), respectively, P = 0.02).
There was a prevalence of the male sex in both groups (patients who progressed to myeloma, 71%; patients who did not progress, 69%; patients overall, 70%). No signifi-cant difference was found between groups (P = 0.99)
There was a higher incidence of multiple recurrence than of single recurrence of primary tumors in patients with plasmacytoma that progressed to multiple myeloma (mul-tiple recurrence, 75%; local recurrence, 6.2%; distant re-currence, 19%; P = 0.049).
Regarding anatomical location, the vertebral column was the most frequent location in both groups (61% and 47% in the plasmacytoma and multiple myeloma groups, respectively).
Regarding the time from the onset of symptoms until diagnosis, there was no significant difference between groups (182 ± 53.2 vs 362.8 ± 130.2 days (mean ± SEM),
Figure 6 - Progression time (months) in patients with plasmacytoma that progressed to multiple myeloma (descriptive statistics)
Table 7 - Correlation of progression time (months) and age (years) (Spearman’s correlation test between quantitative ordinal parameters)
PARAMETERS
Y X r p
Progression time Age 0.39 0.13
(months) (years)
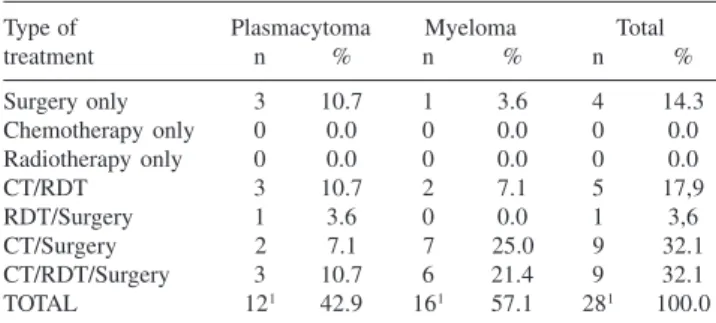
Table 9 - Type of treatment received by patients with plasmacytoma and by patients with plasmacytoma that progressed to myeloma (absolute and relative (%) frequency distribution)
Type of Plasmacytoma Myeloma Total
treatment n % n % n %
Surgery only 3 10.7 1 3.6 4 14.3
Chemotherapy only 0 0.0 0 0.0 0 0.0
Radiotherapy only 0 0.0 0 0.0 0 0.0
CT/RDT 3 10.7 2 7.1 5 17,9
RDT/Surgery 1 3.6 0 0.0 1 3,6
CT/Surgery 2 7.1 7 25.0 9 32.1
CT/RDT/Surgery 3 10.7 6 21.4 9 32.1
TOTAL 121 42.9 161 57.1 281 100.0
1 not referred to in the medical chart CT: chemotherapy; RDT: radiotherapy
Figure 7 - Anatomic location of primary tumors in patients with
plasmacytoma and in patients with plasmacytoma that progressed to multiple myeloma (absolute and relative (%) frequency distribution)
Figure 8 - Type of treatment received by patients with plasmacytoma and by patients with plasmacytoma that progressed to multiple myeloma (absolute and relative frequency distribution)
Table 8 - Anatomic location of primary tumors in patients with plasmacytoma and in patients with plasmacytoma that progressed to myeloma (absolute and relative (%) frequency distribution)
Anatomic Plasmacytoma Myeloma Total
n % n % n %
Spinal Column 8 26.7 8 26.7 16 53.3
Clavicula 0 0 1 3.3 1 3.3
Humerus 1 3.3 3 10 4 13.3
Ilium 2 6.7 2 6.7 4 13.3
Femur 2 6.7 3 10 5 16.7
TOTAL 13 43.3 17 56.7 30 100
P = 0.34, for patients who did not progress vs patients who
did progress to multiple myeloma, respectively).
Regarding survival time, there was no difference be-tween groups (57.4 ± 15 vs 78 ± 16.71 months (mean ± SEM), P = 0.34, for patients who did not progress vs
pa-tients who did progress to multiple myeloma, respectively). Regarding time to progression, the average was 41 ± 10 months (mean ± SEM). No correlation was found be-tween the time to progression and age (P = 0.13). The
pro-gression rate of plasmacytoma to multiple myeloma was 57% (17 of 30 patients).
Regarding anatomic location, in the group with plas-macytoma, we found the following: vertebral column, 62%; humerus, 8%; pelvis, 15%; and femur, 15%. In the group with plasmacytoma that progressed to multiple myeloma, the values were as follows: vertebral column, 47%; cla-vicula, 6%; humerus, 18%; pelvis, 12%; and femur, 18%.
Treatments administered to patients with plasmacytoma were as follows: 25% surgery only; 25% chemotherapy and radiotherapy; 8% radiotherapy and surgery; 17% chemo-therapy and surgery; and 25% chemochemo-therapy, radiochemo-therapy, and surgery. Treatments administered to patients with plas-macytoma that progressed to multiple myeloma were as follows: 6.25% surgery only; 12.5% chemotherapy and ra-diotherapy; 43.75% chemotherapy and surgery; and 37.5% chemotherapy, radiotherapy, and surgery.
Regarding survival time, there was no significant dif-ference between groups (57.4 ± 15 vs 78.1± 16.7 months (mean ± SEM), P = 0.34, for patients with plasmacytoma
vs patients who progressed to multiple myeloma, respec-tively).
DISCUSSION
This study is part of an institutional effort to retrospec-tively summarize some of our most significant patient se-ries.29-31
Holland et al16 found a mean survival time of 10.7 years
for patients with plasmacytoma, whereas we found the sur-vival time to average only 4.8 years. Olmo et al12 and
Schajowicz et al16 observed a mean survival time of 2 years
for patients who progressed to multiple myeloma, whereas for our series, the mean survival time was 6.5 years. There-fore, our results are different from those reported in litera-ture, which might be explained by the fact that a small sam-ple was used or because it was difficult to obtain data about the progression of patients. In the study by Bataille et al.13
the authors mentioned that it was difficult to find a rela-tionship between plasmacytoma and multiple myeloma be-cause these are rare bone tumors.
From the statistical analysis performed we concluded that
patients who did not progress to multiple myeloma were older than patients who did. In contrast to our findings, in the study by Bataille et al,13 patients with plasmacytoma were
younger than those who had plasmacytoma that progressed to myeloma (45.7 ± 9.5 vs 51.1 ± 12 years (mean ± SD), respectively, P < 0.1). Additionally, Dimopoulos et al11
re-port that patients with plasmacytoma were approximately 7 years younger than those with multiple myeloma
Regarding the frequency distribution of patients’ sex, no statistically significant difference was found between groups (plasmacytoma and plasmacytoma that progressed to multiple myeloma), although in both groups the male sex was more affected. Seventy percent of all patients were men, which is in agreement with the data of Dimopoulos et al11 and Holland et al.16
After analyzing the frequency distribution of the type of recurrence of primary tumors in patients with plasma-cytoma that progressed to multiple myeloma, we observed a higher incidence (78%) of multiple recurrence, than that (58%) found by Bataille and Sany.13 These authors observed
that 85% of patients showed progression to multiple my-eloma, while in our study only 57% of patients showed this progression, which is similar to the 53% found by Holland et al,16 and to the 54% found by Frassica et al.27
We found the prevalence of vertebral column injuries of 53%, a value higher than the 33.3% found by Dimopoulos et al11 and the 34% found by Holland et al.16
According to Bataille and Sany,13 in patients with
plasma-cytoma, vertebral column injuries were found in 26.7% of cases, while in patients with plasmacytoma who progressed to multiple myeloma this percentage was 61.8% (P < 0.01),
which differs from the present study, where patients with plasmacytoma that did not progress to multiple myeloma presented more injuries in their vertebrae.
Regarding the time to progression, the average was 41 months compared to 31 months reported by Bataille and Sany.13
CONCLUSION
RESUMO
Bertanha F,Boufelli G,Pires de Camargo O, Baptista AM, Caiero MT, de Oliveira CRGCM,et al. Evolução oncoló-gica dos plasmocitomas ósseos para mieloma múltiplo. Clinics. 2006:61(2):139-46.
OBJETIVO: Avaliar os aspectos clínicos, diagnósticos, fatores de prognóstico e porcentagem de evolução dos ca-sos de plasmocitoma para mieloma múltiplo.
MATERIAS E MÉTODOS: Foram levantados 103 pron-tuários do Hospital das Clínicas da FMUSP, entre os anos de 1950 e 1998. Destes, 73 não foram utilizados por perda de seguimento ou por apresentarem diagnóstico diferente de plasmocitoma.
RESULTADOS: Concluímos que a idade dos pacientes que evoluíram para mieloma múltiplo é inferior a dos pacien-tes que não evoluíram. A média do primeiro grupo foi de 52,3 ± 2,6 anos e a do segundo 62,6 ± 3,4 anos (média ± SEM; p=0,02). Não houve diferença estatística quanto ao sexo. Analisando pacientes com plasmocitoma que evoluiu para mieloma múltiplo, foi observada uma incidência maior
de recidivas múltiplas (75%, p=0,049). Em ambos os gru-pos houve predominância de lesões da coluna vertebral. Não houve nenhuma diferença significativa entre os gru-pos com relação ao tempo de doença (desde o aparecimento dos sintomas até o diagnóstico) (p=0,20) e à sobrevida (p=0,34). Quanto ao tempo de evolução de plasmocitoma para mieloma, a média foi de 41 meses (DP=38,8), com uma taxa de evolução aproximadamente igual a 57%. CONCLUSÃO: Os pacientes que evoluíram para mieloma múltiplo são mais jovens. Não houve diferença significati-va entre os dois grupos quanto ao sexo, tempo de doença e tempo de sobrevida. Em ambos os grupos a localização anatômica mais acometida foi a coluna vertebral. O tem-po médio de evolução para mieloma múltiplo foi de 41 meses. Não foi possível calcular os fatores que influem na sobrevida dos pacientes com plasmocitoma e dos pacien-tes com plasmocitoma que evoluiu para mieloma múltiplo.
UNITERMOS: Plasmocitoma. Mieloma Múltiplo. Evolu-ção clínica. Prognóstico. Células plasmáticas.
REFERENCES
1. MacIntyre W. Case of mollities and fragilitas ossium accompanied with urine strongly charged with animal matter. Med Chir Soc Tr. 1850;33:211.
2. Rustizky J. Multiple myeloma. Deutsche Ztschr F. Chir. 1873;3:162. 3. Kahler O. Zur Symptomatologie des multiplen Myeloms: Beobachtung
von Albumosurie. Prog Med Wochnschr. 1889;14:33:45.
4. Potter M. Perspectives on the origins of multiple myeloma and plasmacytomas in mice. Hematol Oncol Clin North Am. 6:211-23. 5. Waldenstrom J. Diagnosis and treatment of multiple myeloma. New
York: Editorial Médica; 1973.
6. Riedel DA, Pottern LM. The epidemiology of multiple myeloma. Hematol Oncol Clin North Am. 6:225-47.
7. Coskun HS, Er O, Soyuer S, Altinbas M, Eser B, Karahacioglu E, , et al. Solitary plasmacytoma: experiences from Central Anatolia. Ir J Med Sci. 2005;174:33-6.
8. Blattner WA, Blair A, Maron TJ. Multiple myeloma in the United States 1950-1975. Cancer. 1981;48:2547.
9. Fassas A, Tricot G. Results of high-dose treatment with autologous stem cell support in patients with multiple myeloma. Semin Hematol. 2001;38:231-42.
10. Durie BG, Salmon SE. A clinical staging system for multiple myeloma. Correlation of measured myeloma cell mass with presenting clinical features, response to treatment, and survival. Cancer. 1975;36:842-54.
11. Dimopoulos MA, Moulopoulos A, Delasalle K, Alexanian R. Solitary plasmacytoma of bone and asymptomatic multiple myeloma. Hematol Oncol Clin North Am. 1992;6:359-69.
12. Olmo JA Del. Osteopatías hematológicas. In: Querol JR. Patología Ósea. Barcelona: Ed. Espaxs Publicaciones Médicas; 1983. p. 376-82. 13. Bataille R, Sany J. Solitary myeloma: clinical and prognostic features
of a review of 114 cases. Cancer. 1981;48:845-51.
14. Quintero M, Rojas-Atencio A, Ruiz A, Gonzalez M, Herrera J, Atencio F, et al. Chromosome anomalies in Venezuelan patients with multiple myeloma. Invest Clin. 2003;44:327-35.
15. Di Micco P, Di Micco B. Update on solitary plasmacytoma and its main differences with multiple myeloma. Exp Oncol. 2005;27:7-12. 16. Holland J, Trenkner DA, Wasserman TH, Fineberg B. Plasmacytoma,
treatment results and conversion to myeloma. Cancer. 1992;69:1513-7.
17. Kumar A, Loughran T, Alsina M, Durie BG, Djulbegovic B. Management of multiple myeloma: a systematic review and critical appraisal of published studies. Lancet Oncol. 2003;4:293-304. 18. Schajowicz F. Neoplasias ósseas e lesões pseudotumorais. 2nd. ed. Rio
de Janeiro: Ed. Revinter; 2000.
20. Yan TQ, Guo W, Tang XD, Tang S. Clinical study of solitary bone plasmacytoma. Zhonghua Wai Ke Za Zhi. 2003;41:749-52.
21. Kaplan EI, Meier P. Non- parametric estimation from incomplete observations. J Am Stat Assoc. 1958;53:457.
22. Bataille R, Donadio D, Morlock G, Rosenberg F, Blotman F, Sany J et al. Multiple myeloma of bones. Retrospective study of prognostic factors based on a series of 243 patients. Rev Rhum Mal Osteoartic. 1979;46:77-83.
23. Bataille R, Morlock G, Rosenberg F, Lopitaux R, Blotman F, Sany J, et al. [Value of successive chemotherapy in multiple myeloma of bone. Prospective study over 4 years]. Rev Rhum Mal Osteoartic. 1980;47:77-82. (French)
24. Durie BG, Salmon SE. Multiple myeloma, macroglobulinaemia and monoclonal gammopathies. In: Hoffbrand AV, Brain MC, Hirsh J, editors. Recent Advances in Haematology. Edinburgh: Churchill Livingstone; 1977. p. 243-60.
25. Knowling MA, Harwood AR, Bergsagel DF. Comparison of extramedullary plasmacytoma with solitary and multiple plasma cell tumors of bone. J Clin Oncol. 1983;1:255-62.
26. Chak L, Cax RS, Bostwick DG, Hoppe RT. Solitary plasmacytoma of bone: treatment, progression, and survival. J Clin Oncol. 1987;5:1811-5.
27. Frassica DA, Frassica FJ, Shray MF, Sim FH, Kyle RA. Solitary plasmacytoma of bone. Int J Radiat Oncol Biol Phys. 1989;16:43-8. 28. Mayr NA, Wen BC, Hussey DH, Burns CP, Staples JJ, Doornbos JF, et
al. The role of radiation therapy in the treatment of solitary plasmacytomas. Radiother Oncol. 1990;17:292.
29. Etchebehere M, Camargo OP, Croci AT Oliveira CRCM, Batista AM. Relationship between surgical procedure and outcome for patients with grade I chondrosarcomas. Clinics. 2005;60:121-126.
30. Camargo OP de, Croci AT, Oliveira CRGMC de, Baptista AM, Caiero MT. Functional and radiographic evaluation of 214 aggressive benign bone lesions treated with curettage, cauterization, and cementation: 24 years of follow-up. Clinics. 2005;60:439-444.