The Spine Group, Institute of Orthopedics and Traumatology, Hospital das Clínicas, São Paulo University Medical School - São Paulo/SP, Brazil. E-mail: [email protected]
Received for publication on April 04, 2006. Accepted for publication on May 16, 2006.
CLINICAL SCIENCES
STUDY OF THE PREVALENCE AND RISK FACTORS
FOR LOW BACK PAIN IN TRUCK DRIVERS IN THE
STATE OF SÃO PAULO, BRAZIL
Silvia Ferreira Andrusaitis, Reginaldo Perilo Oliveira, Tarcísio Eloy P. Barros Filho
Andrusaitis SF, Oliveira RP, Barros Filho TEP. Study of the prevalence and risk factors for low back pain in truck drivers in the state of São Paulo, Brazil. CLINICS. 2006;61(6):503-10.
OBJECTIVE: To investigate the prevalence of low back pain in truck drivers and check for possible risk factors related to the presence of low back pain.
METHODS: A questionnaire was developed including personal factors such as age, practice of physical and sports activities, general health habits, occupation-related issues, and factors associated with low back pain. The body mass index (ratio of body weight to the square of height, kg/m2) was calculated. Of 489 male truck drivers assessed, 410 were enrolled into the study. The statistical analysis was divided into 2 stages: descriptive analysis of data, and binary logistical regression, where the response (dependent) variable (presence of low back pain) was associated with each independent variable to check for correlation with low back pain.
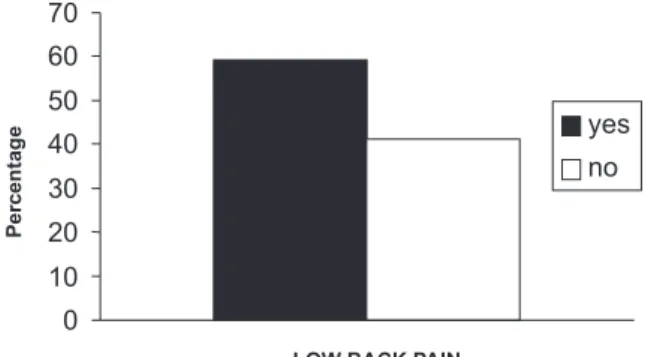
RESULTS: Of the 410 truck drivers evaluated, 242 (59%) presented with low back pain, while 168 (41%) did not have low back pain. The only factor correlated with the presence of low back pain was the number of working hours; the other factors had no correlation with low back pain.
CONCLUSION: The prevalence of low back pain in truck drivers was 59%. The number of working hours was the only variable associated with occurrence of low back pain, with an average of about 1 hour longer work time for drivers with low back pain compared to those without it and with an odds ratio of 1.07 (P = 0.026).
KEYWORDS: Cross-sectional studies. Men. Automotive vehicles. Low back pain. Risk factors.
INTRODUCTION
Epidemiologic studies have shown that approximately 80% of the population has presented or will present an epi-sode of low back pain during their active lives.1-6 Low back
pain corresponds to over 50% of all musculoskeletal dys-functions that cause chronic disabilities in industrialized countries, leading to expenses with treatments and absen-teeism from work.5,7-13
Low back pain or lumbar pain runs between the lower ribs and the glutei and can be related to multiple causes such as neoplasias; inflammatory and infectious diseases; systemic bone alterations; congenital abnormalities; degen-erative, visceral, and psychogenic diseases; traumas; and mechanical causes.4,14 Occupational low back pain is related
to the latter cause; the onset occurs while the individual is exerting occupational activities and therefore is related to certain working situations such as maintenance of the same posture for prolonged periods, repetitive movements, lift-ing of heavy objects, and tiltlift-ing and torsion of the trunk.7,11,15,16 Moreover, not only can the exposure to risk
Among the many professionals affected by low back pain are motor vehicle drivers. Professional drivers present 3 times the risk for low back pain when com-pared to individuals involved in other occupational
ac-tivities.19 This is explained not only by the
above-men-tioned mechanical factors but also by the presence of stress to which drivers are subjected in general,
trigger-ing musculoskeletal pain.20,21
Thus, given the high incidence of low back pain and the high costs of its consequences, studies have been conducted to estimate the most effective measures to control symptoms, although preventing the onset of low back pain can be more efficient and cost-effective. This requires knowledge of the triggering factors and the pro-file of the individuals who are more susceptible to the onset of low back pain. Studies on the prevalence and knowledge of risk factors for low back pain are impor-tant since they allow not only the determination of the impact of the disease on society or on a given social stra-tum, but they also help to organize health services and investments necessary for prevention and control of the
symptoms.7,15
The objectives of this study were to investigate the prevalence of low back pain in truck drivers and to check for possible risk factors related to the presence of low back pain.
METHODS
A total of 410 truck drivers with over 1 year of profes-sional experience who drove on Sao Paulo State Castello Branco, Senator Jose Ermirio de Moraes, and Raposo Tavares highways between March and November 2003 spontaneous agreed to participate in the study by signing an informed consent form. The exclusion criteria were hav-ing low back pain prior to entrance into the profession or having had low back pain of traumatic origin.
The subjects were evaluated using a questionnaire de-veloped for this study and by the measurement of their weights and heights using an anthropometric balance in or-der to calculate the body mass index (BMI) by dividing the body weight (kg) by the square of the height (m2).22
The first 2 months of the study were used to develop and validate the questionnaire with the most appropriate and understandable terms to be explained to the truck drivers. Then, a 2-part questionnaire was applied. The first part addressed personal factors (such as age, ethnic group, skin color, physical and sports activity, and general health habits) and occupation-related issues (such as work pe-riod, leisure time, length of time in the profession, and self-employed or employee). The second part addressed
factors related to low back pain, such as presence, type, duration, and frequency of pain to characterize activity-related back pain. All questions were answered directly by the truck drivers, except for the items concerning skin color, which were recorded by one of the authors from visual observation.
Once the questionnaire was completed, the weight (kg) and height (m) of each participant was measured, and the
body mass index (BMI, kg/m2) was calculated.
One of the authors performed all evaluations, and nurse attendants measured the weights and heights of the partici-pants.
The question asked of the truck drivers to check for low back pain was as follows: “While exerting your activity as a professional truck driver, have you experienced or did you use to experience low back pain?”, where low back pain was defined as a pain between the lower ribs and the glu-teal fold, but is not related to traumas or falls.4,14 The
an-swers were divided into 2 categories (Yes and No), each Yes answer being subdivided into 3 categories according to the pain frequency, as follows: Experienced Pain, Oc-casional Pain, and Constant Pain.
Statistical Analysis
The response (dependent) variable adopted in this study was the presence or absence of low back pain, in order to estimate the prevalence of low back pain in truck drivers. The number of years of professional work, nature of work (self-employed or employee), hours of sleep at night, hours worked during the day, practice of physical or sports activity (yes or no), ethnic group, smoking, alcohol consumption, age, weight, height, and BMI value variables were analyzed to investigate to what extent these items might be risk factors for triggering low back pain, and also to draw a profile of these pro-fessionals. Following the descriptive analysis of the study results, a binary logistical regression model using
the maximum verisimilitude method was performed, 23
with the response (dependent) variable being the pres-ence/absence of low back pain, and the explanatory (in-dependent) variables being number of years of profes-sional work, nature of work (self-employed or em-ployee), hours of sleep at night, hours worked during the day, practice of physical or sports activity (yes or no), ethnic group, age, weight, height, and BMI value. The
variables were selected using the forward procedure24 in
order to determine which variables might be associated with the presence of low back pain.
for poor adjustment, and building residual standard devia-tion curves. The software used was STATA v. 6.
From the adjusted final model it was possible to ob-tain estimates of the prevalence and prevalence odds ratio for fixed values of the explanatory variables.
RESULTS
Of the 410 truck drivers evaluated, 242 (59%) had low back pain, and 168 (41%) did not have low back pain (Fig-ure 1). Of the 242 (59%) truck drivers with back pain, 31.2% had occasional pain, 18% had constant pain, and 9.8% had experienced back pain some time in their pro-fessional lives. Of the factors investigated, the only factor significantly correlated with the presence of low back pain was the number of working hours (OR = 1,07, IC = 95%, [1,01; 1,13] (Table 1). The other factors considered as be-ing associated with risk (age, anthropometric factors, eth-nic factors, length of time in the profession, nature of work, hours of sleep at night, smoking, alcohol consumption, and practice of physical activity) showed no correlation with low back pain.
Table 2 shows the average and median values, stand-ard deviation, and maximum and minimum values observed as well as the sample size for the following variables: age
(years), height (m), BMI value (kg/m2), number of years
in the profession, work hours and sleep hours, in each cat-egory (Yes and No) of low back pain.
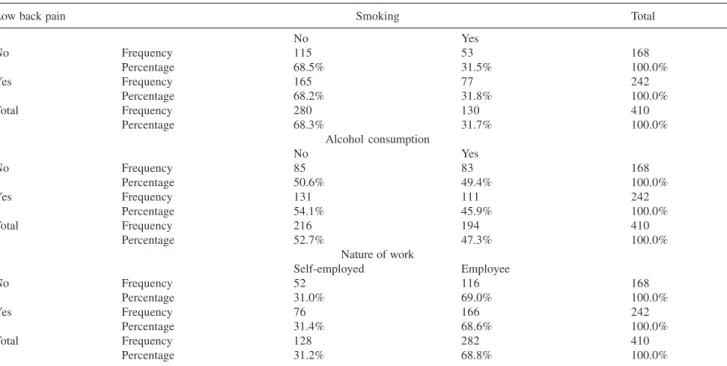
The frequency distribution and percentages of smoking, alcohol consumption, nature of work, ethnic group and weekly frequency of physical activity practice variables in groups with and without low back pain are shown in Tables 3 and 4.
DISCUSSION
Several hypotheses were considered in this study. The first one was that the prevalence of low back pain in truck drivers would be high since, being professional drivers, they spend much of their time in the seated position and fre-quently twisting and bending their torsos, besides being subjected to the continuous vibration of the motor and hav-ing to load and unload the truck. Accordhav-ing to the litera-ture, these are relevant risk factors for the onset of low back pain. 7, 11-13, 15, 16, 19, 25-28
Other factors that were hypothesized to contribute to low back pain in truck drivers were sedentarism, improper diet, alcohol consumption, cigarette smoking, improper working conditions and work in excess, since all these characteris-tics are related to the profile of these professionals and are also related to the presence of low back pain.18, 29-31
The 410 truck drivers were evaluated regarding these factors by questionnaire, and the result was that low back pain was present in 59.0% of these professionals and that among the probable risk factors analyzed, only the number of working hours was significantly correlated with the pres-ence of low back pain.
The association of factors such as age, weight, height, BMI, smoking, and alcohol consumption with low back pain has produced controversial results as reported in the
literature.32-36 The occurrence of low back pain among the
general population increases with age and starts declining after 65 years of age, but its occurrence among younger individuals is not uncommon, although studies of specific populations have not shown any correlation between age and low back pain. 7, 18, 20, 25, 31, 37
The existence of a possible relationship between being overweight and low back pain is reasonable, since weight increases lead to overload on the spine, which can increase the pressure on the intervertebral disc and other structures of the spine, triggering pain. The same relationship can be observed concerning height. Individuals who, due to their heights, work under unfavorable ergonomic conditions have a higher probability to trigger low back pain.37,38
Although in this study height and weight showed no re-lationship to the occurrence of low back pain, the BMI val-ues found in the truck drivers studied was above an
aver-age 25 kg/m2, which is regarded as overweight, and
con-Table 1 - Summary of significant results of logistic model adjustment
Predictor Coefficient Standard error Z P p ratio 95% CI
Constant -0.26 0.30 -0.88 0.377
Work hours 0.064 0.03 2.22 0.026 1.07 1.01; 1.13
sequently, is a risk known for other conditions such as dia-betes mellitus and heart problems. Also, 77% of the truck drivers in this study did not practice any physical activity. Although this did not influence the triggering of low back pain, it does increase the risk for cardiovascular disease.22
As to smoking, although the literature confirms its as-sociation with low back pain, the causal mechanism is not fully elucidated. Smoking leads to decrease in perfusion and malnutrition of the paravertebral tissues and of the in-tervertebral disc, which can lead to a decrease in the stress resistance of the spine and interfere with lesion healing. Nicotine can also influence the central nervous system by changing the perception of pain, which would explain
mus-culoskeletal pains in other regions of the body.29,30 Other
issues could be involved, for instance, the smoking habit may be related to the fact that smokers tend to be seden-tary and care less about their own health, so that the
pro-file of smokers would be the risk factor for the occurrence of low back pain, and not merely the smoking habit.
Other factors to be noted are the length of time in the profession and the nature of work. Initially, it was thought that older truck drivers and self-employed truck drivers would show a higher occurrence of low back pain due to occupational stress over the years; self-employed workers do not receive benefits that are common for employees, such as days off, more definite work shifts, and medical assistance. However, the results did not confirm this hy-pothesis. The length of time in the profession was not cor-related with the occurrence of low back pain, and the dis-tribution of low back pain was similar among self-employed and employee truck drivers. These results could be due to have several possible factors. For example, older truck driv-ers who developed low back pain may have changed pro-fessions due to the pain, and those who remained in the
Table 2 - Mean value, median value, standard deviation, maximum and minimum values observed and sample size of the following quantitative variables: age, height, BMI value, length of time in the profession, work hours, and sleep hours, according to the Yes and No categories of low back pain
LOW BACK PAIN - LOW BACK PAIN - TOTAL
NO YES
AGE (years) n 168 242 410
Mean 40.73 39.78 40.17
Median 40.00 40.00 40.00
Standard deviation 10.46 9.98 10.17
Minimum 21 20 20
Maximum 69 65 69
HEIGHT (m)
Mean 1.71 1.72 1.72
Median 1.72 1.72 1.72
Standard deviation 0.06 0.07 0.06
Minimum 1.55 1.51 1.51
Maximum 1.90 1.93 1.93
BMI (kg/m2)
Mean 26.54 27.02 26.83
Median 26.35 26.85 26.70
Standard deviation 3.68 3.84 3.78
Minimum 18.80 18.10 18.10
Maximum 37.90 38.60 38.60
TIME IN THE PROFESSION (years)
Mean 15.94 15.29 15.55
Median 14.50 15.00 15.00
Standard deviation 10.50 9.51 9.92
Minimum 1 1 1
Maximum 48 42 48
WORK HOURS
Mean 9.42 10.22 9.90
Median 9.00 10.00 10.00
Standard deviation 3.23 3.75 3.57
Minimum 2 1 1
Maximum 18 20 20
SLEEP HOURS
Mean 7.29 6.91 7.06
Median 8.00 7.00 8.00
Standard deviation 1.58 1.80 1.72
Minimum 3 3 3
profession are the ones who never experienced low back pain or had it sometime but have recovered and have learned to prevent new episodes.34 Also, perhaps older
driv-ers have more opportunities to choose their type of work by using more appropriate routes and selecting less stress-ful jobs; or, they may accept their problems more easily and report fewer pain complaints.
Concerning self-employed workers, although they do not receive the benefits reserved for employees, they might have other advantages. For example, they might better
dis-tribute their working hours and leisure time, choose the type of work, and seek medical assistance at any time before the problem aggravates. Additionally, self-employed truck drivers might report fewer complaints in general, since they cannot count on any kind of help, unlike those who have a link with a company or a work team. We were not able not find any study in the literature addressing this issue.
The prevalence of low back pain in this study was simi-lar to that found in the literature for truck drivers and was associated mainly with increased working hours. It is worth
Table 4 - Frequency distribution and percentages of weekly frequency of physical activity practice and ethnic group variables according to the Yes and No categories of low back pain
Low back pain Weekly frequency – physical activity Total
0 1 2 3 4 5
No Frequency 127 29 2 3 7 168
Percentage 75.6% 17.3% 1.2% 1.8% 4.2% 100.0%
Yes Frequency 189 35 4 7 2 5 242
Percentage 78.0% 14.5% 1.7% 2.9% 0.8% 2.1% 100.0%
Total Frequency 316 64 6 10 2 12 410
Percentage 77.0% 15.6% 1.5% 2.4% 0.5% 2.9% 100.0%
Skin color / Ethnic group
Yellow White Black Brown
No Frequency 1 110 6 14 131
Percentage 0.8% 84.0% 4.6% 10.7% 100.0%
Yes Frequency 193 8 14 215
Percentage 89.8% 3.7% 6.5% 100.0%
Total Frequency 1 303 14 28 346
Percentage 0.3% 87.6% 4.0% 8.1% 100.0%
Table 3 - Frequency distribution and percentages of smoking, alcohol consumption, and nature of work variables according to the Yes and No categories of low back pain
Low back pain Smoking Total
No Yes
No Frequency 115 53 168
Percentage 68.5% 31.5% 100.0%
Yes Frequency 165 77 242
Percentage 68.2% 31.8% 100.0%
Total Frequency 280 130 410
Percentage 68.3% 31.7% 100.0%
Alcohol consumption
No Yes
No Frequency 85 83 168
Percentage 50.6% 49.4% 100.0%
Yes Frequency 131 111 242
Percentage 54.1% 45.9% 100.0%
Total Frequency 216 194 410
Percentage 52.7% 47.3% 100.0%
Nature of work
Self-employed Employee
No Frequency 52 116 168
Percentage 31.0% 69.0% 100.0%
Yes Frequency 76 166 242
Percentage 31.4% 68.6% 100.0%
Total Frequency 128 282 410
noting that it is difficult to compare the different studies described, since the methodologies employed are not the same; also, prevalence studies depend on some factors such as the number of new cases, migration of the subjects with the disease, and duration of the disease. All these factors can cause either underestimation or overestimation of the results.4
In prevalence studies, it is not always possible to de-termine the relationship between the risk factors and the onset of the disease.15 However, in the present study, an
in-creased number of daily working hours was associated with occurrence of low back pain, which is easy to explain be-cause this factor is related to many others involving the pro-fessional activity of truck drivers, since their work concerns not only transportation, but also involves deadlines, either due to the perishable nature of some goods to be carried, or for financial reasons, since each hour of delay in deliv-ering the goods means additional expenses for the truck driver, such as extra fuel, spare parts, and meals. Another factor that can make truck drivers extend their driving pe-riods is the lack of appropriate places to stop, both con-cerning road conditions and lack of safety for the load be-ing carried, the truck, and the driver himself. To all these factors add the concentration required by the act of
driv-ing a motor vehicle. Keepdriv-ing appropriate attention for a long period is psychologically and physically consuming, leaving the musculature—particularly the trunk muscula-ture—tense due to the absence of proper relaxation peri-ods. It can be also emphasized that the number of work-ing hours is associated with other risk factors that are widely described in the literature, such as remaining in the seated position for a long period, being exposed to vibra-tions, excessively twisting and bending the trunk, and car-rying heavy objects, since the higher the number of hours worked daily by truck drivers, the more they are exposed to these factors, the consequence of which is the risk of triggering low back pain.
CONCLUSIONS
· The prevalence of low back pain in the truck drivers
included in this study was 59.0%.
· Of all the variables studied, the amount of daily
work-ing hours was the only one presentwork-ing association with the presence of low back pain.
· An increase of an average of about 1 hour of daily
working time was significantly associated with the oc-currence of low back pain, with an odds ratio 1,07.
RESUMO
Andrusaitis SF, Oliveira RP, Barros Filho TEP. Estudo da prevalência e fatores de risco da lombalgia em caminhoneiros do Estado de São Paulo, Brasil. CLINICS. 2006;61(6):503-10.
OBJETIVO: Investigar a prevalência da lombalgia em caminhoneiros e verificar os possíveis fatores de risco relacionados à presença da dor lombar.
MÉTODOS: Foi elaborado um questionário que abordou fatores pessoais como: idade, prática de atividade física e
RESULTADOS: Dos 410 caminhoneiros avaliados 242 apresentaram lombalgia, correspondendo a 59% da amostra e 168 não apresentaram dor lombar, correspondendo a 41% da amostra. Dentre os fatores estudados o único que apresentou correlação com a presença da lombalgia foi o número de horas de trabalho. Os demais fatores considerados associados ao risco não apresentaram correlação com a dor lombar.
CONCLUSÃO: A prevalência da lombalgia nos
caminhoneiros foi 59%. O número de horas de trabalho foi a única variável que apresentou associação com a ocorrência da lombalgia, sendo que para cada hora de trabalho diário, o risco de o caminhoneiro apresentar dor lombar aumenta 7%.
UNITERMOS: Estudos transversais. Homens. Veículos automotores. Dor lombar. Fatores de risco.
REFERENCES
1. Beurskens AJ, De Vet HC, Koke AJ, Van Der Heijden GJ, Knipschild PG. Measuring the functional status of patients with low back pain. Assessment of the quality of four disease-specific questionnaires. Spine.
1995;20:1017-28.
2. Fransen M, Woodward M, Norton R, Coggan C, Dawe M, Sheridan N. Risk factors associated with the transition from acute to chronic occupational back pain. Spine. 2002;27:92-8.
3. Hoogendoorn WE, Van Poppel MNM, Bongers PM, Koes BW, Bouter LM. Physical load during work and leisure time as risk factors for back pain. Scand J Work Environ Health. 1999;25:387-403.
4. Loney PL, Stratford PW. The prevalence of low back pain in adults: a methodological review of the literature. Phys Ther 1999;79:384-96. 5. Santos KGLL, Silva MAG. A prevalência de lombalgia em mulheres
praticantes de ginástica em academias esportivas. Fisioterapia. 2003;4:117-25.
6. Toda Y, Segal N, Toda T, Morimoto T, Ogawa R. Lean body mass and body fat distribution in participants with chronic low back pain. Arch Intern Med. 2000;160:3265-9.
7. De Vitta A. A lombalgia e suas relações com o tipo de ocupação, com a idade e o sexo. Rev Bras Fisioter. 1996;1:67-72.
8. MacFarlane GJ, Thomas E, Papageorgiou AC, Croft PR, Jayson MIV, Silman AJ. Employment and physical of future low back pain. Spine. 1997;22:1143-9.
9. Mannion AF, Muntener M, Taimela S, Dvorak J. A randomized clinical trial of three active therapies for chronic low back pain. Spine. 1999;24:2435-48.
10. Marras WS, Ferguson SA, Gupta P, Bose S, Parnianpour M, Kim JY, et al. The quantification of low back disorder using motion measures. Methodology and validation. Spine. 1999;24:2091-100.
11. Miyamoto M, Shirai Y, Nakayama Y, Gembun Y, Kaneda K. An epidemiologic study of occupational low back pain in truck drivers. J Nippon Med Sch. 2000;67:186-90.
12. Queiroga MR. Incidência e localização de sintomas de dor em motoristas de ônibus na cidade de Londrina. Rev Bras Saude Ocup. 2002;27:121-32.
13. Roland M, Morris R. A study of natural history of low-back pain. Part I: Development of a reliable and sensitive measure of disability in low-back pain. Spine. 1983;8:141-4.
14. Papageorgiou AC, Croft PR, Ferry S, Jayson MIV, Silman A. Estimating the prevalence of low back pain in the general population. Spine. 1995;20:1889-94.
15. Burdof A, Naaktgeboren B, De Groot HC. Occupational risk factors for low back pain among sedentary workers. J Occup Med. 1993;35:1213-20.
16. Fernandes RCP. Lombalgia e trabalho:uma breve revisão. Rev Bras Saude Ocup. 2002;27:55-65.
17. Adams MA, Mannion AF, Dolan P. Personal risk factors for first-time low back pain. Spine.1999;24:2497-505.
18. Guo HR. Working hours spent on repeated activities and prevalence of back pain. Occup Environ Med. 2002;59:680-8.
19. Kelsey JL, Hardy RJ. Driving of motor vehicles as a risk factor for acute herniated lumbar intervertebral disc. Am J Epidemiol. 1975;102:608-13.
20. Anderson R. The back pain of bus drivers. Spine. 1992;17:1481-8. 21. Magnusson ML, Pope MH, Wilder DG, Areskoug B. Are occupational
drivers at an increased risk for developing musculoskeletal disorders? Spine. 1996;21:710-7.
22. Mortimer M, Wiktorin C, Pernold G, Svensson H, Vingard E. MUSIC (Norrtalje Study Group, Musculoskeletal Intervention Center). Sports activities, body weight and smoking in relation to low-back pain: a population-based case-referent study. Scand J Med Sci Sports. 2001;11:178-84.
23. Hosmer DW, Lemeshow S. Applied Logistic Regression. New York: Wiley; 1989.
24. McCullag P, Nelder JA. Generalized Linear Models. New York: Chapman and Hall; 1989.
25. Barreira THC. Abordagem ergonômica da LER. Rev Bras Saude Ocup. 1994;22:51-60.
26. Heliovaara M. Occupation and risk of herniated lumbar intervertebral disc or sciatica leading to hospitalization. J Chronic Dis. 1987;40:259-64.
28. Riihimaki H, Viikari-Juntura E, Moneta G, Kuha J, Videman T, Tola S. Incidence of sciatica pain among men in machine operating, dynamic physical work, and sedentary work. Spine. 1994;19:138-42. 29. Eriksen W, Natvig B, Bruusgaard D. Smoking, heavy physical work and
low back pain: a four-year prospective study. Occup Med. 1999;49:155-60.
30. Goldberg MS, Scott SC, Mayo NE. A review of the association between cigarette smoking and development of nonspecific back pain and related outcomes. Spine. 2000;25:995-1014.
31. Hildebrandt VH, Bongers PM, Dul J, Van Dijk FJH, Kemper HCG. The relationship between leisure time, physical activities and musculoskeletal symptoms and disability in worker populations. Int Arch Occup Environ Health. 2000;73:507-18.
32. Miranda H, Viikari-Juntura R, Martikainen E, Takala P, RiihimakI H. Physical exercise and musculoskeletal pain among forest industry workers. Scand J Med Sci Sports. 2001;11:239-46.
33. Krause N, Ragland DR, Fisher JM, Syme SL. Psychosocial job factors, physical workload, and incidence of work-related spinal injury: a 5 year prospective study of urban transit operators. Spine. 1998;23:2507-16. 34. Porter JM, Gyi DE. The prevalence of musculoskeletal troubles among
car drivers. Occup Med. 2002;52:4-12.
35. Ying X, Bach E, Orhede E. Work environment and low back pain: the influence as occupational activities. Occup Environ Med. 1997;54:741-5.
36. Leboeuf-Yde C. Alcohol and low back pain: a systematic literature review. J Manipulative Phys Ther. 2000;23:343-6.
37. Matsui H, Maeda A, Tsuji H, Naruse Y. Risk indicators of low back pain among workers in Japan. Spine. 1997;22:1242-8.