ACPD
13, 2077–2123, 2013Aerosol
composition, sources and processes in
China
Y. L. Sun et al.
Title Page
Abstract Introduction
Conclusions References
Tables Figures
◭ ◮
◭ ◮
Back Close
Full Screen / Esc
Printer-friendly Version Interactive Discussion
Discussion
P
a
per
|
Dis
cussion
P
a
per
|
Discussion
P
a
per
|
Discussio
n
P
a
per
|
Atmos. Chem. Phys. Discuss., 13, 2077–2123, 2013 www.atmos-chem-phys-discuss.net/13/2077/2013/ doi:10.5194/acpd-13-2077-2013
© Author(s) 2013. CC Attribution 3.0 License.
Atmospheric Chemistry and Physics Discussions
This discussion paper is/has been under review for the journal Atmospheric Chemistry and Physics (ACP). Please refer to the corresponding final paper in ACP if available.
Aerosol composition, sources
and processes during wintertime
in Beijing, China
Y. L. Sun1, Z. F. Wang1, P. Q. Fu1, T. Yang1, Q. Jiang1,2, H. B. Dong1, J. Li1, and J. J. Jia1
1
State Key Laboratory of Atmospheric Boundary Layer Physics and Atmospheric Chemistry, Institute of Atmospheric Physics, Chinese Academy of Sciences, Beijing 100029, China
2
School of Atmospheric Physics, Nanjing University of Information Science & Technology, Nanjing 210044, China
Received: 14 December 2012 – Accepted: 7 January 2013 – Published: 21 January 2013
Correspondence to: Y. L. Sun ([email protected])
ACPD
13, 2077–2123, 2013Aerosol
composition, sources and processes in
China
Y. L. Sun et al.
Title Page
Abstract Introduction
Conclusions References
Tables Figures
◭ ◮
◭ ◮
Back Close
Full Screen / Esc
Printer-friendly Version Interactive Discussion
Discussion
P
a
per
|
Dis
cussion
P
a
per
|
Discussion
P
a
per
|
Discussio
n
P
a
per
|
Abstract
Air pollution is a major environmental concern among all seasons in megacity Bei-jing, China. Here we present the results from a winter study that was conducted from 21 November 2011 to 20 January 2012 with an Aerodyne Aerosol Chemical Speci-ation Monitor (ACSM) and various collocated instruments. The non-refractory
sub-5
micron aerosol (NR-PM1) species vary dramatically with clean periods and pollution
episodes alternating frequently. Compared to summer, wintertime submicron aerosols show much enhanced organics and chloride, which on average account for 52 % and 5 %, respectively of the total NR-PM1 mass. All NR-PM1 species show quite diff
er-ent diurnal behaviors between summer and winter. For example, the wintertime nitrate
10
presents a gradual increase during daytime and correlates well with secondary organic aerosol (OA), indicating a dominant role of photochemical production over gas-particle partitioning. Positive matrix factorization was performed on ACSM OA mass spectra, and identified three primary OA (POA) factors, i.e. hydrocarbon-like OA (HOA), cook-ing OA (COA), and coal combustion OA (CCOA), and one secondary factor, i.e.
oxy-15
genated OA (OOA). The POA dominates OA during wintertime, contributing 69 % with the rest of 31 % being SOA. Further, all POA components show pronounced diurnal cycles with the highest concentrations occurring at nighttime. CCOA is the largest pri-mary source during the heating season, on average accounting for 33 % of OA and 17 % of NR-PM1. CCOA also plays a significant role in chemically-resolved particulate
20
matter (PM) pollution as its mass contribution increases linearly as a function of NR-PM1mass loadings. The SOA however presents a reversed trend, which might indicate
the limited SOA formation during high PM pollution episodes in winter. The effects of meteorology on PM pollution and aerosol processing were also explored. In particu-lar, the sulfate mass is largely enhanced during periods with high humidity because
25
ACPD
13, 2077–2123, 2013Aerosol
composition, sources and processes in
China
Y. L. Sun et al.
Title Page
Abstract Introduction
Conclusions References
Tables Figures
◭ ◮
◭ ◮
Back Close
Full Screen / Esc
Printer-friendly Version Interactive Discussion
Discussion
P
a
per
|
Dis
cussion
P
a
per
|
Discussion
P
a
per
|
Discussio
n
P
a
per
|
1 Introduction
Atmospheric fine particles exert highly uncertain radiative forcing impacts on climate change (Forster et al., 2007) and are detrimental to human health (Pope III et al., 2002). Aerosol particles also have series impacts on air quality and visibility reduction (Watson, 2002; Molina and Molina, 2004). In recent years, air pollution has become
5
a major environmental concern in densely populated urban areas (Molina et al., 2010; Zhang et al., 2008b) due to large emissions of air pollutants from anthropogenic activ-ities, e.g. traffic, industry, and power plants. However, the air pollution control remains a great challenge because of the very complex sources and evolution processes of aerosol particles. Knowledge of aerosol particle composition, sources and processes
10
is of importance to reduce its harmful effects and improve air quality.
The particulate matter (PM) pollution in Beijing has improvement during the past decade (Chan and Yao, 2008), the visibility however is getting worse (Zhang et al., 2010). While the increasing moisture has played an important role, the consistently high concentration of fine particles (PM2.5) might be another reason. Indeed, fine
parti-15
cles often exceed the new National Ambient Air Quality Standards of China (75 µg m−3
for 24-h average) among all seasons. Efforts to characterize sources and composi-tion of fine particles thus have been extensively made in Beijing and vicinity regions. Most of the early studies rely on filter measurements (Sun et al., 2006; He et al., 2001; Yao et al., 2002; Duan et al., 2005). Carbonaceous materials, water-soluble ions,
in-20
cluding SO24−, NO−3, and NH+4, and mineral dust are found to be major constituents of fine particles in Beijing. However, the filter measurements with the sampling dura-tions from hours to days are not sufficient enough to characterize the rapid evolution of atmospheric aerosols, for example, the aging of OA usually takes place in less than one day (Jimenez et al., 2009; DeCarlo et al., 2010). Further, the filter measurements
25
ACPD
13, 2077–2123, 2013Aerosol
composition, sources and processes in
China
Y. L. Sun et al.
Title Page
Abstract Introduction
Conclusions References
Tables Figures
◭ ◮
◭ ◮
Back Close
Full Screen / Esc
Printer-friendly Version Interactive Discussion
Discussion
P
a
per
|
Dis
cussion
P
a
per
|
Discussion
P
a
per
|
Discussio
n
P
a
per
|
In recent years, the real-time measurements of aerosol particle composition have been widely conducted in China using various online instruments, e.g. Ambient Ion Monitor (AIM, URG9000B) (Wu and Wang, 2007), Gas and Aerosol Collector – Ion Chromatography (IC) systems (GAC-IC) (Dong et al., 2012), analyzer for Monitoring for AeRosols and Gases (MARGA) (Du et al., 2011), and Aerosol Mass
Spectrome-5
ters (AMS) (Huang et al., 2010; Sun et al., 2010), etc. Among them, AMS is a unique instrument which can provide both chemical composition and size distributions of non-refractory submicron aerosol species, including organics, sulfate, nitrate, ammonium, and chloride (Canagaratna et al., 2007). Due to the high sensitivity and the capabil-ity in aerosol composition detection, AMS measurements gradually become the focus
10
of recent studies (Huang et al., 2010; Sun et al., 2010; Liu et al., 2011; Takegawa et al., 2009). Despite this, most instruments above need to be maintained routinely in order to obtain high quality data. The long-term measurements, therefore, still remain a challenge. Aerodyne Aerosol Chemical Speciation Monitor (ACSM) was recently de-veloped based on AMS (Ng et al., 2011b). The ACSM is specially designed for routine
15
and long-term measurements of aerosol particle composition and mass concentration, yet no size information. The first deployment of ACSM in Beijing, China shows good performance and provides rich chemical information on aerosol particles (Sun et al., 2012). With all these efforts in aerosol measurements, a number of conclusions and new findings has been obtained, which has significantly improved our understanding
20
of aerosol sources and processes in China. In particular, organics is found to be a ma-jor component of fine particles, accounting for more than one-third of total mass. The primary organic aerosol (POA) from traffic, cooking, and coal combustion etc., and secondary OA (SOA) are distinguished and quantified using various receptor models, e.g. chemical mass balance (CMB) and positive matrix factorization (PMF). SOA
dom-25
ACPD
13, 2077–2123, 2013Aerosol
composition, sources and processes in
China
Y. L. Sun et al.
Title Page
Abstract Introduction
Conclusions References
Tables Figures
◭ ◮
◭ ◮
Back Close
Full Screen / Esc
Printer-friendly Version Interactive Discussion
Discussion
P
a
per
|
Dis
cussion
P
a
per
|
Discussion
P
a
per
|
Discussio
n
P
a
per
|
Most previous AMS measurements in Beijing were conducted in summer with a ma-jor focus on photochemical processing. However, the aerosol composition, sources and processes may vary very differently between summer and winter because of dif-ferent meteorology and source emissions. For example, a recent study in the winter of 2010 by a High Resolution Time-of-Flight AMS (HR-ToF-AMS) found that SOA only
5
accounts for 24 % of the total OA with the rest being POA (Liu et al., 2011). The ox-idation degree of OA is much reduced in winter, and the size distributions shift from a large accumulation mode peaking at ∼600 nm to ∼450 nm (Sun et al., 2010; Liu
et al., 2011; Huang et al., 2010). In order to better characterize aerosol composition and sources during wintertime, an ACSM was deployed from 21 November 2011 to 20
10
January 2012 at the same site as that in summer (Sun et al., 2012). Here we have a detail characterization of submicron aerosol species including mass concentrations, chemical composition, diurnal variations, and day-of-week patterns during wintertime, and compare with those observed in summer. Then, we perform source apportionment analysis using PMF to investigate the source categories and evolution processes of
15
OA. Finally we provide some insights into the chemically-resolved PM pollution and its association with meteorology during wintertime.
2 Experimental
2.1 Aerosol and gas measurements
The non-refractory submicron (NR-PM1) aerosol species including organics, sulfate,
20
nitrate, ammonium, and chloride were measured in-situ at the same location as Sun et al. (2012), i.e. Institute of Atmospheric Physics (IAP), Chinese Academy of Sci-ences located between 3rd and 4th ring road in Beijing, from 21 November 2011 to 20 January 2012 with an ACSM. The aerosol sampling setup and the ACSM opera-tions in this study were also the same as those in Sun et al. (2012). In addition to
25
Ta-ACPD
13, 2077–2123, 2013Aerosol
composition, sources and processes in
China
Y. L. Sun et al.
Title Page
Abstract Introduction
Conclusions References
Tables Figures
◭ ◮
◭ ◮
Back Close
Full Screen / Esc
Printer-friendly Version Interactive Discussion
Discussion
P
a
per
|
Dis
cussion
P
a
per
|
Discussion
P
a
per
|
Discussio
n
P
a
per
|
pered Element Oscillating Microbalance (TEOM series1400a, Thermo Scientific), and collocated gaseous species including CO, SO2, NO/NOy, and O3 were measured by
various gas analyzers (Thermo Scientific). The meteorology data (wind speed, wind di-rection, relative humidity, temperature, pressure, precipitation and solar radiation) dur-ing this study was obtained from the IAP tower that is approximately 30 m away and
5
the ground meteorology station that is∼20 m away.
2.2 ACSM data analysis
The mass concentrations and mass spectra were processed using ACSM standard data analysis software (v 1.5.1.1). The detailed procedures for the data analysis have been described in Ng et al. (2011b) and Sun et al. (2012). In particular, a collection
10
efficiency (CE) was introduced to compensate for the particle loss, mostly due to par-ticle bounce at the vaporizer (Matthew et al., 2008). Although CE=0.5 is appropriate for most field studies (Canagaratna et al., 2007), it also varies depending on the acid-ity of aerosol particles, aerosol composition, and particle phase water (Matthew et al., 2008). Given aerosol particles were dried before sampling into ACSM system and they
15
are overall neutralized in Beijing (Huang et al., 2010; Sun et al., 2010), the particle phase water and acidity are expected to play minor roles in affecting CE values. There-fore, we use a composition-dependent CE recommended by Middlebrook et al. (2011), i.e. CE=max(0.45, 0.0833+0.9167×ANMF) in this study. ANMF is mass fraction of
ammonium nitrate in NR-PM1.
20
The PMF with PMF2.exe algorithm (Paatero and Tapper, 1994) in robust mode was performed on ACSM mass spectra to deconvolve OA into distinct factors. Similar to our previous study (Sun et al., 2012), we limited our PMF analysis to m/z 120 due to large interferences of internal standard of naphthalene atm/z’s 127–129. The PMF results were further evaluated with an Igor Pro-based PMF Evaluation Tool (PET, v2.04)
25
ACPD
13, 2077–2123, 2013Aerosol
composition, sources and processes in
China
Y. L. Sun et al.
Title Page
Abstract Introduction
Conclusions References
Tables Figures
◭ ◮
◭ ◮
Back Close
Full Screen / Esc
Printer-friendly Version Interactive Discussion
Discussion
P
a
per
|
Dis
cussion
P
a
per
|
Discussion
P
a
per
|
Discussio
n
P
a
per
|
PMF analysis showed better deconvolution of OA factors, and was able to identify four components including three primary OA, i.e. HOA, cooking OA (COA), and coal combustion OA (CCOA), and one secondary OA, i.e. OOA.
3 Results and discussion
3.1 Mass concentration 5
Figure 1 shows the time series of NR-PM1and PM2.5mass, submicron aerosol species, and meteorology for the entire study. Similar to the results observed in summer (Sun et al., 2012), the NR-PM1 mass measured by the ACSM tracks well the PM2.5
mea-sured by the TEOM (r2=0.77, Fig. S1). The correlation between NR-PM1 and PM2.5 yields a regression slope of 0.74, mainly because ACSM only measures PM1and also
10
does not detect refractory materials, e.g. mineral dust and black carbon at vaporizer temperature of ∼600◦C. Note that the ratio of NR-PM1/PM2.5 is often close to 1 as
shown in Fig. S1. One of the reasons is due to the evaporative loss of semi-volatile materials (SVM, e.g. ammonium nitrate and semi-volatile organics) for the TEOM mea-surements that were operated at 50◦C (Eatough et al., 2003). For example, a
signifi-15
cant loss (∼50 %) of SVM for the heated TEOM in comparison to the one with the SVM
collected was reported during the SOAR-1 study (Docherty et al., 2011). Indeed, the correlation between NR-PM1and PM2.5appears to be dependent on the mass fraction of sulfate and OOA that are less volatile components in the aerosols. Higher fraction of less volatile sulfate and OOA corresponds to lower ratio of NR-PM1/PM2.5. The higher
20
ratio of NR-PM1/PM2.5in winter than summer (0.64) is also likely due to the evaporative loss of more semi-volatile materials in winter.
The daily average concentration of the total NR-PM1 mass ranges from 6.6 to
192 µg m−3 with an average value of 66.8(±55) µg m−3 for the entire study, which is ∼30 % higher than that observed in summer, 2011 (Sun et al., 2012). The daily
av-25
ACPD
13, 2077–2123, 2013Aerosol
composition, sources and processes in
China
Y. L. Sun et al.
Title Page
Abstract Introduction
Conclusions References
Tables Figures
◭ ◮
◭ ◮
Back Close
Full Screen / Esc
Printer-friendly Version Interactive Discussion
Discussion
P
a
per
|
Dis
cussion
P
a
per
|
Discussion
P
a
per
|
Discussio
n
P
a
per
|
and the second grade of NAAQS (75 µg m−3) released in 2012 by the Ministry of En-vironmental Protection (MEP) of the People’s Republic of China (http://kjs.mep.gov.cn/ hjbhbz/bzwb/dqhjbh/dqhjzlbz/201203/t20120302 224165.htm). If converting the mea-sured NR-PM1 to PM2.5 using a factor of 0.74, we calculate that∼80 % and 54 % of
days during wintertime exceed the NAAQS of US EPA and China MEP, respectively.
5
This suggests that the fine particle pollution is still a major environmental concern in Beijing although it has been improved during the past decade (Chan and Yao, 2008). Considering the complexity of sources, properties, and processes of fine particles, the road to achieve the PM2.5standard remains a challenge (Yuan et al., 2012).
The mass concentration of total NR-PM1 varies very dramatically across the entire
10
study. In particular, the clean events with NR-PM1<∼15 µg m− 3
(∼24 % of the time)
and the highly polluted episodes (>100 µg m−3,∼25 % of the time) occur alternatively.
The clean periods are often short, typically less than 2 days. In contrast, the high PM pollution events persist a longer time and sometimes over one week. The switch of clean and polluted days is strongly associated with the synoptic meteorology in
15
Beijing. As shown in Fig. 1, the clean periods are associated with high wind speed and dominant westerly and northwesterly winds. Comparatively, the high PM pollution episodes are generally related to southerly and easterly winds with low wind speed (<∼1.5 m s−1). Such meteorology patterns influencing aerosol species in Beijing have
been observed many times in previous studies (Huang et al., 2010; Sun et al., 2010,
20
2012; Zhang et al., 2012b). Also note wet scavenging plays a minor role in changing aerosol mass loadings given the very small precipitation during the study.
3.2 Submicron aerosol composition and diurnal variations
All submicron aerosol species show very dynamic variations day by day with the min-imum and maxmin-imum of daily average concentrations being larger than 20 times, and
25
ACPD
13, 2077–2123, 2013Aerosol
composition, sources and processes in
China
Y. L. Sun et al.
Title Page
Abstract Introduction
Conclusions References
Tables Figures
◭ ◮
◭ ◮
Back Close
Full Screen / Esc
Printer-friendly Version Interactive Discussion
Discussion
P
a
per
|
Dis
cussion
P
a
per
|
Discussion
P
a
per
|
Discussio
n
P
a
per
|
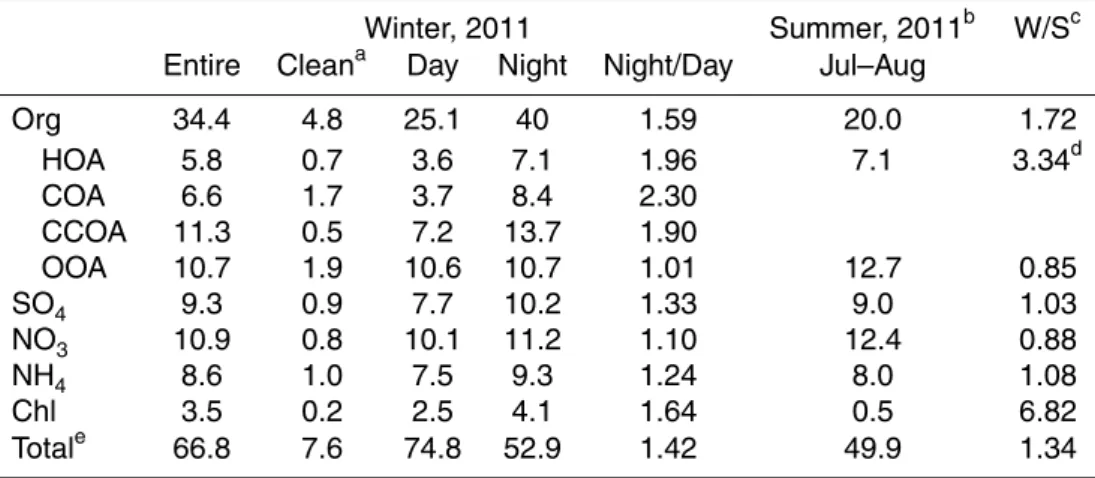
PMF analysis of OA in Sect. 3.3 suggests that such structure is mainly caused by the variations of primary OA, e.g. COA and CCOA. Overall, the NR-PM1in winter is
domi-nated by organics with an average contribution of 52 % (Fig. 2a). Compared to∼40 %
observed in summer (Huang et al., 2010; Sun et al., 2010, 2012), organics is more im-portant in PM pollution in winter. Indeed, the average mass concentration of organics
5
is 34.4(±27.9) µg m−3in winter, which is almost twice higher than that in the summer of
2011 (Sun et al., 2012). The contribution of organics to NR-PM1is even higher during the clean periods (63 %), which is consistent with our previous observations in Beijing that the air masses from the upwind areas of Beijing are characterized by high mass fraction of organics (Sun et al., 2012). As a comparison, the inorganic species sulfate
10
and nitrate show relatively lower contribution to the total NR-PM1mass in winter (14 % and 16 %, respectively) than summer although the mass concentrations between the two seasons are rather similar (Table 1). Chloride accounts for a small fraction of NR-PM1 in winter (5 %) yet with the largest seasonal difference among NR-PM1 species. The mass concentration in winter is∼7 times higher than that in summer, likely due to
15
the intensified emissions from coal combustion during the heating season.
The diurnal profiles of NR-PM1 species, OA components, and meteorological vari-ables for the entire study and clean periods are presented in Fig. 3. Organics shows a pronounced diurnal cycle with the highest concentration occurring at nighttime (∼54 µg m−3) and the lowest value during daytime (∼24 µg m−3). Our lidar
measure-20
ments show that the diurnal variation of planetary boundary layer (PBL) height during the study period is relatively flat, indicating that PBL might play a minor role in driving the time-of-day variation during wintertime. Therefore, we infer that the high concentra-tion of organics at nighttime is mainly associated with the primary organics from local emissions, in agreement with the diurnal profiles of primary OA components, e.g. HOA,
25
CCOA, and COA (Sect. 3.3). In addition, the relatively lower wind speed and higher hu-midity at nighttime might also have played a role. The organics contributes the major fraction of NR-PM1throughout the day, ranging from 48–60 %, and the contribution
ACPD
13, 2077–2123, 2013Aerosol
composition, sources and processes in
China
Y. L. Sun et al.
Title Page
Abstract Introduction
Conclusions References
Tables Figures
◭ ◮
◭ ◮
Back Close
Full Screen / Esc
Printer-friendly Version Interactive Discussion
Discussion
P
a
per
|
Dis
cussion
P
a
per
|
Discussion
P
a
per
|
Discussio
n
P
a
per
|
observed at noon time due to the influences of cooking emissions, but such noon peak is much smaller in comparison to that observed in summer (Sun et al., 2012). The diurnal cycle of organics during the clean periods shows some differences, which is characterized by two peaks corresponding to meal times. Such diurnal pattern resem-bles more to that observed in summer (Sun et al., 2010, 2012; Huang et al., 2010). This
5
implies that local cooking-related emissions play an important role in organic chemistry during the clean periods. Interestingly, a third peak between 08:00–09:00 was also ob-served which might be from the emissions of cooking breakfast.
Sulfate shows quite different diurnal behaviors between summer and winter. The sul-fate in summer presents an enhanced noon peak associated with the photochemical
10
processing (Sun et al., 2012). However, such noon peak is not observed in winter. This might suggest that the gas-phase photochemical production of sulfate particles is less significant in winter with low temperature and solar radiation. Instead, we found that the sulfur oxidation ratio shows a strong and positive RH dependency (Sun et al., 2013), indicating that aqueous processing might have played a more important role in
15
formation of sulfate. This is further supported by the synchronous increase of sulfate and RH from 12:00 to the late afternoon despite the rising boundary layer. In com-parison, sulfate shows a very flat pattern during the clean periods demonstrating the regional characteristics of sulfate. Sulfate, overall, accounts for a relatively consistent contribution (11–15 %) to the total NR-PM1throughout the day.
20
Nitrate shows the largest different diurnal cycle between summer and winter. As the gas-phase photochemical production and temperature dependent gas-particle par-titioning are both important for nitrate formation in summer, the wintertime nitrate appears to be mainly driven by the photochemical production, which shows a lin-ear increase from ∼7 µg m−3 at 08:00 to 12.5 µg m−3 at 17:00 with a growth rate of
25
∼0.6 µg m−3h−1. Further, nitrate shows very similar diurnal pattern and tight correlation
ACPD
13, 2077–2123, 2013Aerosol
composition, sources and processes in
China
Y. L. Sun et al.
Title Page
Abstract Introduction
Conclusions References
Tables Figures
◭ ◮
◭ ◮
Back Close
Full Screen / Esc
Printer-friendly Version Interactive Discussion
Discussion
P
a
per
|
Dis
cussion
P
a
per
|
Discussion
P
a
per
|
Discussio
n
P
a
per
|
evaporative loss of ammonium nitrate particles due to gas-particle partitioning would not be significant. The results together suggest that the dominant formation mecha-nisms of nitrate in summer and winter are very different. The nitrate shows a sharp morning peak during the clean periods, which is very similar to that of NO, yet with a time lag of∼2 h. Such diurnal pattern was also observed in Mexico City during the
5
MCMA-2003 campaign, which is attributed to photochemical production of nitric acid from NO2and OH (Salcedo et al., 2006).
Chloride also shows significantly different diurnal cycles between summer and win-ter. In summer when the emissions of coal combustion are small, chloride shows a gradual decrease from early morning to late afternoon due to the evaporative loss
10
and dilution effects associated with elevated boundary layer. Comparatively, the diurnal cycle of chloride in winter is quite different with the highest concentration occurring at mid-night and the lowest value at noon. Interestingly, while NH4Cl and NH4NO3share
similar volatile properties and often correlate well with each other (Ulbrich et al., 2009; Sun et al., 2011), the different diurnal cycles of chloride and nitrate in this study indicate
15
their different sources and mechanisms. As the photochemical production is the major process of nitrate formation during wintertime, the coal combustion emissions however are the major sources of chloride. Consistently, the diurnal cycles of chloride and coal combustion OA are very similar, further supporting our conclusion. The chloride dur-ing the clean periods is characterized by two pronounced peaks occurrdur-ing in the early
20
morning and evening, which is likely due to the contribution from local sources.
An even simpler comparison of diurnal variations is day-night differences. In this study, the daytime is defined as the period between sunrise and sunset which is ap-proximately∼06:45–∼17:30, and the rest of day is classified as nighttime. As shown
in Table 1, the three primary OA components, i.e. HOA, COA, and CCOA, and chloride
25
show the largest day-night differences with the nighttime concentrations being∼twice
higher than daytime concentrations. The secondary inorganic species (SO4, NO3, and
NH4) and OOA, however, did not show very clear day-night differences, yet with∼10–
ACPD
13, 2077–2123, 2013Aerosol
composition, sources and processes in
China
Y. L. Sun et al.
Title Page
Abstract Introduction
Conclusions References
Tables Figures
◭ ◮
◭ ◮
Back Close
Full Screen / Esc
Printer-friendly Version Interactive Discussion
Discussion
P
a
per
|
Dis
cussion
P
a
per
|
Discussion
P
a
per
|
Discussio
n
P
a
per
|
dependent on relative humidity (Fig. 4). As the day-night RH differences are larger than 10 %, most aerosol species including the secondary inorganic species often show more than twice differences in mass concentrations, highlighting the role of RH in PM pollu-tion in winter. As menpollu-tioned in Sect. 3.2, the PBL plays a less significant role in winter than summer, thus, high concentrations of aerosol species at high RH are likely due to
5
(1) accumulation of pollutants associated with stagnant conditions, (2) production via aqueous processing, and (3) gas-particle partitioning due to water-uptake (Hennigan et al., 2008) and low temperature (Ranjan et al., 2012). It should be noted that even when the day-night RH differences are small, POA components also show much higher concentrations at nighttime than daytime, suggesting the enhanced primary emissions
10
from coal combustion, traffic and cooking activities at nighttime.
3.3 OA composition and sources
PMF analysis of wintertime OA spectra resolved four OA components, i.e. HOA, COA, CCOA, and OOA, of which the mass spectra and time series are presented in Fig. 5, and their diurnal profiles are shown in Fig. 3.
15
3.3.1 Hydrocarbon-like OA (HOA)
The mass spectral pattern of HOA is characterized by hydrocarbon ion series ofm/z27, 41, and 55, typical of cycloalkanes, andm/z 29, 43, and 57, typical of alkanes (McLaf-ferty and Turecek, 1993). Note that the peak intensities of CnH+2n−1is about twice lower than CnH+2n+1. Such spectral pattern is quite different from the HOA spectrum resolved
20
previously by an HR-ToF-AMS in summer (Huang et al., 2010), and the standard HOA spectrum observed worldwide (Ng et al., 2011a), yet shows much similarity to that identified in winter in Beijing (Liu et al., 2011; Zhang, 2011), and the spectrum of pure diesel fuel aerosols (Canagaratna et al., 2004) and un-reacted diesel exhaust (Kroll et al., 2012). The results suggest that HOA in winter, which is emitted at low ambient
25
ACPD
13, 2077–2123, 2013Aerosol
composition, sources and processes in
China
Y. L. Sun et al.
Title Page
Abstract Introduction
Conclusions References
Tables Figures
◭ ◮
◭ ◮
Back Close
Full Screen / Esc
Printer-friendly Version Interactive Discussion
Discussion
P
a
per
|
Dis
cussion
P
a
per
|
Discussion
P
a
per
|
Discussio
n
P
a
per
|
might have been oxidized to some extent already. The mass spectral difference of HOA between summer and winter is also likely due to the significant temperature differences leading to different emissions of hydrocarbons. For example, Lough et al. (2005) found an increase of lighter hydrocarbons in winter in comparison to summer based on on-road vehicle emissions measurements in two tunnels.
5
The time series of HOA varies dramatically day by day and correlates well with CO (r2=0.68), consistent with a number of previous studies that HOA is mainly associ-ated with combustion-relassoci-ated emissions, e.g. diesel exhaust (Zhang et al., 2005; Cana-garatna et al., 2010; Massoli et al., 2012). However, HOA does not present a morning rush hour peak as previous studies at other urban sites (Aiken et al., 2009; Sun et al.,
10
2011), in contrast, HOA presents a pronounced diurnal cycle with the highest concen-tration at night (9.4 µg m−3), and the lowest value during late afternoon (2.9 µg m−3). Such diurnal cycle is remarkably similar to that of the number of heavy duty vehicles (HDV) and heavy duty diesel trucks (HDDT) in Beijing (Han et al., 2009) that are not allowed inside the city between 06:00 a.m.–22:00 p.m. Therefore, the diurnal cycle of
15
HOA is more likely driven by the traffic emissions from HDV and HDDT. HOA, during clean periods, shows two visible peaks during morning and evening rush hours due to local traffic emissions and/or those transported from outside city. Overall, the average mass concentration of HOA for the entire study is 5.8 µg m−3 (17 % of OA) with the highest contribution to OA at nighttime (22 %) and the lowest during daytime (11 %).
20
The contribution of HOA to OA is close to 18 % observed in summer 2008 (Huang et al., 2010), yet slightly lower than 21 % in the winter of 2010 (Liu, 2012).
3.3.2 Cooking OA (COA)
The recent PMF-AMS has identified a cooking-related OA (COA) component with dis-tinct spectral profile and diurnal cycle at various urban sites, e.g. NYC, Beijing, Fresno,
25
ACPD
13, 2077–2123, 2013Aerosol
composition, sources and processes in
China
Y. L. Sun et al.
Title Page
Abstract Introduction
Conclusions References
Tables Figures
◭ ◮
◭ ◮
Back Close
Full Screen / Esc
Printer-friendly Version Interactive Discussion
Discussion
P
a
per
|
Dis
cussion
P
a
per
|
Discussion
P
a
per
|
Discussio
n
P
a
per
|
spectral pattern resembling to that of OA from fresh cooking emissions (Mohr et al., 2012; He et al., 2010). While the ratio ofm/z 55/57 (=2.3) is close to the values pre-viously observed in Beijing (Huang et al., 2010; Liu et al., 2011), the COA spectrum in this study shows relatively higher fraction ofm/z 44, yet resembles more to that ob-served in NYC (Sun et al., 2011). The diurnal cycle of COA is characterized by two
5
pronounced peaks corresponding to lunch and dinner times. Note that the lunch peak in winter is less significant in comparison to the evening peak, which might suggest the significantly enhanced cooking activities at nighttime. In addition, the low temperature and high RH, which facilitates gas-particle partitioning of semi-volatile OA, could be another reason for the high concentration of COA at night. Interestingly, the COA
dur-10
ing the clean periods shows a third peak in the morning, likely from the contribution of breakfast.
COA has been found to be an important source contribution of OA (∼16 %–30 %)
at various urban sites, and often, COA is comparable and even higher than the traffi c-related HOA. In this study, COA on average accounts for 19 % of OA, with the highest
15
contribution of 32 % during dinner time and the lowest of 11 % during late afternoon. The contribution of COA to OA is close to that reported at PKU site in Beijing in the summer of 2008 (Huang et al., 2010) and falls within the range observed at other urban sites. It should be noted that the average contribution of COA to OA increases to 36 % during the clean periods, and even goes up to ∼50 % at dinner time. These results
20
suggest that COA is an important local source of OA in Beijing, particularly during clean periods.
3.3.3 Coal combustion OA (CCOA)
The wintertime PMF analysis resolved an OA factor showing overall similar spectral pattern to that of standard biomass burning OA (BBOA) (Ng et al., 2011a), yet with
25
ACPD
13, 2077–2123, 2013Aerosol
composition, sources and processes in
China
Y. L. Sun et al.
Title Page
Abstract Introduction
Conclusions References
Tables Figures
◭ ◮
◭ ◮
Back Close
Full Screen / Esc
Printer-friendly Version Interactive Discussion
Discussion
P
a
per
|
Dis
cussion
P
a
per
|
Discussion
P
a
per
|
Discussio
n
P
a
per
|
These results suggest a different OA factor in this study from the common BBOA and/or wood combustion OA, which is very likely an OA factor representing coal combustion sources with significantly enhanced emissions during wintertime. Coal combustion in China has been found to emit a large quantity of carbonaceous aerosols, contributing
∼70 % of total emitted PM2.5 (Zhang et al., 2012a). While the polycyclic aromatic
hy-5
drocarbons (PAHs) and n-alkanes are the major components of OA (38 % and 20 %, respectively) from the coal combustion, levoglucosan only accounts for a minor frac-tion, up to 1.1 % of OC (Zhang et al., 2008a). This is overall consistent with the low fraction of m/z 60 and the hydrocarbon ion series (e.g. CnH+2n−1 and CnH+2n+1)
ob-served in this factor. Also, the diurnal profile of f60 (fraction of m/z 60 in OA) during
10
wintertime (Fig. S2) shows a pronounced diurnal cycle with all values (0.52–0.71 %) much higher than∼0.3 % in the absence of biomass burning (Aiken et al., 2009),
con-firming the significant impact of combustion source emissions on OA. In contrast, coal combustion shows minor impacts on OA in summer as suggested by the values off60 close to∼0.3 % although slightly higher values were observed at night. Considering
15
above, we conclude that this factor is primarily a coal combustion related OA factor (CCOA). Not surprisingly, CCOA correlates tightly with chloride (r2=0.81) since the coal combustion is also an important source of chloride (Zhang et al., 2012a).
CCOA shows similar and pronounced diurnal cycle to chloride. The CCOA con-centration reaches a maximum of ∼18 µg m−3 at mid-night, gradually decreases to
20
∼7 µg m−3at 08:00–09:00, and remains a constant level till 15:00–16:00. Such diurnal
cycle is consistent with the source emissions from heating activities which are intensi-fied at nighttime. Indeed, we often can smell coal combustion at nighttime and in the early morning. Similar diurnal cycles of wood burning OA with enhanced emissions at night during wintertime were also observed at other urban sites, e.g. Fresno, CA (Ge
25
ACPD
13, 2077–2123, 2013Aerosol
composition, sources and processes in
China
Y. L. Sun et al.
Title Page
Abstract Introduction
Conclusions References
Tables Figures
◭ ◮
◭ ◮
Back Close
Full Screen / Esc
Printer-friendly Version Interactive Discussion
Discussion
P
a
per
|
Dis
cussion
P
a
per
|
Discussion
P
a
per
|
Discussio
n
P
a
per
|
to OA increasing as a function of relative humidity (Sun et al., 2012, 2013). The CCOA shows a flat diurnal pattern with very low mass concentrations during clean periods, and the average contribution of CCOA to OA drops to 10 %. The high wind speeds and the clean air brought by northwesterly winds are likely the major reasons for the low CCOA during the clean periods.
5
CCOA is the most important primary source during wintertime, on average account-ing for 33 % of OA and 17 % of NR-PM1, which is almost equivalent to the sum of HOA and COA. CCOA also contributes a considerable fraction of OA and NR-PM1
through-out the day, ranging from 26–37 % and 12–22 %, respectively, indicating a sustained impact of coal combustion on PM pollution across the whole day. Therefore, measures
10
to reduce coal combustion emissions would be effective to improve air quality and visi-bility in Beijing during wintertime. With this, we expect an improvement of PM pollution in the next few years as the progression of boiler renovation from coal combustion to natural gas.
3.3.4 Oxygenated OA (OOA) 15
Similar to previously reported OOA (Zhang et al., 2005; Ng et al., 2010, 2011a), the mass spectrum of OOA in this study is characterized by the prominent peak of m/z
44 (CO+2) (19.4 % of the total OOA signal). Although OOA shows more similar spectral pattern to that of highly oxidized LV-OOA than freshly aged SV-OOA, it doesn’t neces-sarily indicate that OOA during wintertime is highly aged. Firstly, them/z 44 in OOA
20
might be overestimated due to the exclusion ofm/z’s larger than 120 and some m/z’s (e.g. m/z 14, 39, etc.) that are not included in PMF analysis (Ng et al., 2011b). Sec-ondly, OOA shows better correlation with NO3 (r
2
=0.80) than SO4(r 2
=0.63), which is similar to the results from a recent HR-ToF-AMS study conducted in Fresno, CA (Ge et al., 2012). Previous studies have shown that NO3often correlates well with SV-OOA
25
ACPD
13, 2077–2123, 2013Aerosol
composition, sources and processes in
China
Y. L. Sun et al.
Title Page
Abstract Introduction
Conclusions References
Tables Figures
◭ ◮
◭ ◮
Back Close
Full Screen / Esc
Printer-friendly Version Interactive Discussion
Discussion
P
a
per
|
Dis
cussion
P
a
per
|
Discussion
P
a
per
|
Discussio
n
P
a
per
|
The time series of OOA varies very differently from the three POA components. As POA shows dynamic variations from day to night due to influences from local emis-sions, OOA often remains a high concentration across several days until a change of air mass occurs. The OOA shows a pronounced diurnal cycle with the concentration being increased from ∼9 µg m−3 at 8:00 to ∼15 µg m−3 at 18:00. The contribution of
5
OOA to the total OA also varies similarly across the day with the highest contribution of∼50 % occurring at late afternoon. The gradual increase of OOA during daytime is
indicative of photochemical production of SOA. Comparatively, OOA shows relatively stable contributions to OA during clean periods. On average, OOA accounts for 31 % of total OA in wintertime with the rest of∼70 % being primary OA. Even though OOA
10
accounts for a higher fraction of OA during clean periods (40 %), it’s still much lower than∼60 % observed in summer (Sun et al., 2010, 2012; Huang et al., 2010), which
illustrates the dominance of POA in winter and OOA in summer.
The OOA correlates well with secondary inorganic species NO3and SO4(r2=0.79), consistent with the conclusions from previous AMS studies in Beijing (Sun et al., 2010,
15
2012; Huang et al., 2010). However, the correlations between OOA and secondary inorganic species during wintertime appear to be strongly dependent on relative hu-midity, in particular for sulfate. As the correlation coefficients remain significant from
r2=0.80 at RH<20 % to r2=∼0.60 at RH>50 %, the ratio of OOA/SO4 decreases
from 2.9 to<1, indicating the different roles of photochemical and aqueous
process-20
ing in formation of OOA and SO4 during wintertime. Particularly, we observed a more
significant enhancement of SO4than OOA and NO3during the foggy events, (e.g. 4–7
December), which might suggest that fog processing plays a more important role in sulfate production. More details can be found in Sect. 3.6.
3.4 Day-of-week variations 25
ACPD
13, 2077–2123, 2013Aerosol
composition, sources and processes in
China
Y. L. Sun et al.
Title Page
Abstract Introduction
Conclusions References
Tables Figures
◭ ◮
◭ ◮
Back Close
Full Screen / Esc
Printer-friendly Version Interactive Discussion
Discussion
P
a
per
|
Dis
cussion
P
a
per
|
Discussion
P
a
per
|
Discussio
n
P
a
per
|
Wednesday were observed. The average weekday and weekend differences are less than 7 % for all aerosol species except COA (>20 %). Such weekend effects are quite different from those observed at other urban sites (Lough et al., 2006; Rattigan et al., 2010). For example, Rattigan et al. (2010) observed a significant weekend effects on EC, a tracer for primary emissions from traffic, at the South Bronx, New York due to
5
the reduced traffic activities on weekends. However, HOA in our study didn’t show sim-ilar behavior to EC in New York. The weak weekly cycles of POA species, e.g. HOA, indicate that the overall human activities appear not being significantly reduced during weekends. For example, while∼20 % of private cars are not allowed to drive in the city
during weekdays, there are no restrictions during weekends. As a result, the number
10
of cars driving on the road in Beijing during weekdays and weekends might not be significantly different. This is consistent with a previous study in Beijing by Han et al. (2009) that EC shows very similar diurnal profiles between weekdays and weekends. It should be noted that Wednesday shows the lowest concentration among the week. This is also different from a previous study in urban areas in eastern China, where
15
the PM10 presented a gradual accumulation till mid-week, then followed by a reduction
with the lowest concentration appearing during weekends (Gong et al., 2007). After checking the day-of-week of meteorology, we found that the lowest concentration on Wednesday is primarily caused by the low RH and high wind speed (Fig. S3). During wintertime, the air masses often alternate rapidly between the south and the
north-20
west, leading to a change between clean periods and pollution episodes within a few hours. Coincidently, the number of clean days that occurred on Wednesday is the high-est (∼6 days). However, the day-of-week variations of aerosol species after excluding
the data of clean periods are somewhat different (Fig. S4). The weekdays show slightly higher concentrations than weekends, but the overall day-of-week variations are flat.
25
The results suggest that meteorology is an important factor affecting the day-of-week pattern of aerosol species during wintertime.
ACPD
13, 2077–2123, 2013Aerosol
composition, sources and processes in
China
Y. L. Sun et al.
Title Page
Abstract Introduction
Conclusions References
Tables Figures
◭ ◮
◭ ◮
Back Close
Full Screen / Esc
Printer-friendly Version Interactive Discussion
Discussion
P
a
per
|
Dis
cussion
P
a
per
|
Discussion
P
a
per
|
Discussio
n
P
a
per
|
between weekdays and weekends. It’s interesting to note that higher concentrations be-fore 12:00 were observed during weekdays while it’s reversed after 16:00. This appears to be consistent with the reduced human activities in the morning on weekends. After excluding the influences of clean episodes, all aerosol species except COA present larger differences between weekdays and weekends before 12:00, yet close
concen-5
trations after 16:00 (Fig. S4c). Results here indicate that the weekend effects during wintertime in Beijing mainly occur in the first half day. The minor weekend effects on COA suggest that COA remains an important OA sources throughout the whole week, contributing 17–22 % of OA.
3.5 Chemically-resolved PM pollution 10
Figure 7 shows the variations of mass concentrations and mass fractions of in-organic species and OA components as a function of NR-PM1 mass loading. All aerosol species except COA and OOA show monotonic and almost linear increase as the increase of PM loading, yet the increasing rates vary for different aerosol species. For example, for an increase of 100 µg m−3 NR-PM
1 mass, sulfate presents
15
the largest increasing mass (17.8 µg m−3
) followed by nitrate (14.4 µg m−3
), ammo-nium (12.3 µg m−3), and chloride (5.5 µg m−3). The OOA increases linearly below
∼140 µg m−3, and then remains relatively stable at higher mass loading, which might
suggest the limited formation of secondary OA during periods with high PM pollution in winter. Although the mass concentrations of aerosol species vary significantly as
20
a function of PM loading, the contribution of total OA and inorganic species to the total NR-PM1 mass didn’t show clear PM-mass loading dependency, which indicates that the high PM pollution in winter is a result of synergistic effects of all pollutants. As organics shows the dominant contribution (∼50–60 %) to PM pollution across diff
er-ent mass loadings, inorganic species, i.e. sulfate, nitrate, and ammonium, contribute
25
∼10–15 % each to the total NR-PM1 mass (Fig. 7b). This mass loading dependent
ACPD
13, 2077–2123, 2013Aerosol
composition, sources and processes in
China
Y. L. Sun et al.
Title Page
Abstract Introduction
Conclusions References
Tables Figures
◭ ◮
◭ ◮
Back Close
Full Screen / Esc
Printer-friendly Version Interactive Discussion
Discussion
P
a
per
|
Dis
cussion
P
a
per
|
Discussion
P
a
per
|
Discussio
n
P
a
per
|
as a function of PM loading, highlighting the important role of nitrate in PM pollution. However, the wintertime nitrate shows a rather stable and even a slight decrease of contribution as PM mass loading increases. The different photochemical production rate, RH and temperature influences on gas-particle partitioning (Ranjan et al., 2012; Hennigan et al., 2009), as well as NH3 ambient levels (Meng et al., 2011) are all
po-5
tential reasons for such seasonal differences. The sulfate contribution shows a slight increase from∼10 %–19 %, indicating addition production of sulfate mass during high
PM episodes. The increase of additional sulfate mass is likely from aqueous produc-tion rather than photochemical producproduc-tion given nitrate didn’t show a correspondingly increase as sulfate. Indeed, the elevated PM levels in winter are also positively related
10
to RH (Sun et al., 2013), which would facilitate the aqueous processing of SO2to form sulfate.
The OA components vary very differently as a function of PM mass loading. Despite the wide concentration range of PM, the contributions of HOA and COA to NR-PM1 are between ∼5–10 % and ∼10–15 %, respectively, and the variations are relatively
15
small across the whole mass loadings. However, CCOA and OOA show a dramatic and reversed PM-loading dependency. The contribution of CCOA to NR-PM1increases significantly from∼5 % to 25 % as the NR-PM1mass varies from∼10 µg m−
3
to more than 200 µg m−3. The contribution of OOA, on the contrary, decreases from∼25 % to
10 %. The results suggest that CCOA plays an important role in leading to high PM
20
pollution in wintertime, while the role of OOA is less significant instead. Considering CCOA is the major component emitted from coal combustion, results here confirm that coal combustion is a major source of fine PM during wintertime.
The relationship between SOA and POA, and their roles in the PM pollution in sum-mer in Beijing were reported in Sun et al. (2012). High PM pollution in sumsum-mer is
25
primarily associated with secondary species. The SOA vs. POA (= HOA + COA +
ACPD
13, 2077–2123, 2013Aerosol
composition, sources and processes in
China
Y. L. Sun et al.
Title Page
Abstract Introduction
Conclusions References
Tables Figures
◭ ◮
◭ ◮
Back Close
Full Screen / Esc
Printer-friendly Version Interactive Discussion
Discussion
P
a
per
|
Dis
cussion
P
a
per
|
Discussion
P
a
per
|
Discussio
n
P
a
per
|
dominant when the OA mass fraction in NR-PM1is higher. For example, when the mass fraction of OA is>∼65 %, the POA concentration can reach∼120 µg m−3, while SOA
is generally below 10 µg m−3, indicating that POA is more than 10 times higher than SOA. Even though in the periods with the highest PM loadings, POA exceeds SOA most of time, yet with a relatively low OA mass fraction,∼40–65 %. The diurnal cycles
5
of POA and SOA in Fig. 8b further shows that POA exceeds SOA throughout the day, accounting for 51–76 % of OA. We also note that SOA shows an elevated contribution, from∼25 % to 49 % during daytime due to photochemical production. Overall, the
av-erage concentration of POA and SOA in winter is 23.7 and 10.7 µg m−3, accounting for 69 % and 31 %, respectively, of OA. While the SOA concentration between summer
10
and winter is close, the POA in winter is more than 3 times higher than that in sum-mer (Table 1). Results above demonstrate the different impacts of SOA and POA on PM pollution in different seasons. While SOA is of importance in summer, POA plays a more important role in winter. The roles of total primary and secondary species in PM pollution in winter were also investigated. The diurnal variations of secondary PM
15
(SPM = SO4+ NO3+ NH4+ OOA) and primary PM (PPM = HOA + COA + CCOA
+Chl) are shown in Fig. 8b. Chloride is classified into PPM because it’s mainly from the direct emission of coal combustion in winter. While SPM and PPM both present pronounced diurnal cycles, SPM shows higher mass loading than PPM during daytime (∼6:00–20:00), yet comparable to PPM at night. The contribution of SPM to the total
20
NR-PM1 varies from 50–72 % with the highest contribution occurring at 15:00–16:00.
The average contribution of SPM and PPM for the entire study was 59 % and 41 %, re-spectively. Therefore, results above suggest that SPM is also important in PM pollution during wintertime although POA overwhelms SOA in OA.
3.6 Meteorological effects on PM evolution 25
ACPD
13, 2077–2123, 2013Aerosol
composition, sources and processes in
China
Y. L. Sun et al.
Title Page
Abstract Introduction
Conclusions References
Tables Figures
◭ ◮
◭ ◮
Back Close
Full Screen / Esc
Printer-friendly Version Interactive Discussion
Discussion
P
a
per
|
Dis
cussion
P
a
per
|
Discussion
P
a
per
|
Discussio
n
P
a
per
|
wintertime. Figure 9 shows the variations of mass concentrations of NR-PM1 species
and OA components as a function of wind speed. All aerosol species show a rapid and almost linear decrease with a reduction rate of ∼30 % per m s−1 at wind speed
<3 m s−1. When wind speed is>3 m s−1, the total NR-PM1mass loading quickly drops
from∼100 µg m−3to<10 µg m−3, at the same time, all aerosol species show very low
5
concentrations, generally<2 µg m−3. Similar wind speed dependency of EC was also observed in all seasons in Beijing (Han et al., 2009). These results suggest that winds are very efficient in cleaning up the PM pollution during wintertime. To further investi-gate the dilution effects of wind speed, the relationship between aerosol species and wind speed was separated into two groups with RH<40 % and >40 %. As shown in
10
Fig. 9, the RH-separated relationship varies differently to some extent for the primary and secondary species. The secondary species, e.g. sulfate and OOA, show relatively weaker wind speed dependency in comparison to POA components at high RH. Also note the wind dependency of POA components, e.g. HOA and COA, show smaller differences between low and high RH values than secondary species, elucidating the
15
different impacts of RH on processing aerosol species with different hygroscopicities. The RH effects on aerosol processing were illustrated by the correlations between NO3 and SO4, and the ratio of NO3/SO4 as a function of RH (Fig. 10). Nitrate and
sulfate correlates well in both summer (r2=0.61) and winter (r2=0.64), suggesting a common secondary nature of these two species. However, the correlations between
20
nitrate and sulfate are strongly RH dependent, and this dependency is reversed be-tween summer and winter. In summer, the NO3/SO4ratio shows a positive correlation
with RH, indicating a faster growth rate of NO3than SO4. As the RH varies from∼20 %
to>80 %, the NO3/SO4 ratio jumps from ∼0.5 to ∼2.0, which is nearly 4 times
en-hancement. As we reported in our previous study (Sun et al., 2012), the high
concen-25
ACPD
13, 2077–2123, 2013Aerosol
composition, sources and processes in
China
Y. L. Sun et al.
Title Page
Abstract Introduction
Conclusions References
Tables Figures
◭ ◮
◭ ◮
Back Close
Full Screen / Esc
Printer-friendly Version Interactive Discussion
Discussion
P
a
per
|
Dis
cussion
P
a
per
|
Discussion
P
a
per
|
Discussio
n
P
a
per
|
∼2 is observed at RH<∼20 %, and the ratio decreases linearly to∼0.5 when RH is
above 80 %. Such differences for NO3/SO4ratio between summer and winter are indi-cations of different formation mechanisms of nitrate and sulfate. As shown in Fig. 10, the RH-binned temperature in winter is generally below 2◦C and relatively constant across different RH values. Under these conditions, most of nitrate would be expected
5
in the particle-phase, and the gas-particle partitioning would not play a significant role. Thus daytime photochemical production is the major formation mechanism for nitrate in winter. In contrast, high concentration of sulfate is mainly observed during several fog events with high RH (e.g. 2, 5–7, 13 December, and 7–10 January Fig. 1), indicating that fog processing might be the dominant pathway for the sulfate formation. To support
10
this, we plot the correlations of∆SO2versus∆SO2−
4 in Fig. 11. The∆SO2and∆SO 2− 4
is the mass concentrations after subtracting the background concentration of SO2and
SO24−, which is 7 ppb and 0.33 µg m−3, respectively, in this study. Again, the relationship of∆SO2vs.∆SO
2−
4 shows a strong RH dependency. As RH is below 35 %,∆SO2and
∆SO24−shows tight correlation (R2>0.6), yet the majority of SO2remains un-oxidized.
15
As RH increases, the concentration of∆SO2starts to decrease, and the concentration
of ∆SO2−
4 correspondingly increases. The correlation between ∆SO2 and ∆SO 2− 4 is
thus sharply reduced, yet with more SO2 being oxidized to sulfate. This indicates that
aqueous-processing, mostly fog processing in this study, has played a significant role in the formation of sulfate.
20
Figure 12 shows the variations of NR-PM1 species and OA as a function of
tem-perature. HOA shows similar and monotonically decreasing trend as the increase of temperature at different RH ranges, suggesting a negative influence of temperature on primary traffic emissions. Ranjan et al. (2012) found that the gas-particle partitioning of POA from diesel engines is dependent on temperature, and increasing temperature
25
ACPD
13, 2077–2123, 2013Aerosol
composition, sources and processes in
China
Y. L. Sun et al.
Title Page
Abstract Introduction
Conclusions References
Tables Figures
◭ ◮
◭ ◮
Back Close
Full Screen / Esc
Printer-friendly Version Interactive Discussion
Discussion
P
a
per
|
Dis
cussion
P
a
per
|
Discussion
P
a
per
|
Discussio
n
P
a
per
|
trend when temperature increases. This appears to contradict with temperature de-pendent gas-particle partitioning. However, as shown in Fig. 3, high temperature in one day usually appears in the afternoon when photochemistry is the most intense. Results here indicate that the photochemical production of NO3and OOA overcomes
gas-particle partitioning under overall low ambient temperatures (<12◦C) during
win-5
tertime. Other aerosol species appear to show different temperature dependent behav-iors between low and high RH. The mass concentrations of most aerosol species peak at temperature of∼0–3◦C when RH is higher than 40 %, comparatively, most of them
show a slow increasing trend as the increase of temperature when RH is below 40 %.
4 Conclusions 10
We have a detail characterization of wintertime aerosol particle composition and sources in megacity Beijing, China. The NR-PM1 species including organics, sulfate,
nitrate, ammonium, and chloride were measured in-situ from 21 November 2011 to 20 Januar 2012 with an Aerodyne ACSM. The submicron mass varies very dynamically with an average concentration of 67±55 µg m−3for the entire study. Similar to summer,
15
organics comprises the major fraction of NR-PM1in winter. However, the contributions
of organics and chloride to NR-PM1are significantly enhanced during wintertime, which increases from 40 % to 52 % and 1 % to 5 % for organics and chloride, respectively. All NR-PM1 aerosol species show quite different diurnal behaviors between summer and
winter due to different source emissions and chemical processing. Of particular, the
20
wintertime nitrate shows a gradual increase from early morning to late afternoon, and also correlates well with SOA formation, indicating that photochemical production dom-inates the formation mechanisms of nitrate at low ambient temperatures.
PMF analysis was performed on ACSM mass spectra to investigate the sources and processes of OA during wintertime. Four components were identified including three
25
ACPD
13, 2077–2123, 2013Aerosol
composition, sources and processes in
China
Y. L. Sun et al.
Title Page
Abstract Introduction
Conclusions References
Tables Figures
◭ ◮
◭ ◮
Back Close
Full Screen / Esc
Printer-friendly Version Interactive Discussion
Discussion
P
a
per
|
Dis
cussion
P
a
per
|
Discussion
P
a
per
|
Discussio
n
P
a
per
|
pronounced diurnal cycles with the highest concentrations occurring at night. OOA however presents a diurnal cycle as a result of photochemical processing. The POA dominates OA composition during heating season, on average accounting for 69 %, and plays a more important role in PM pollution compared to OOA. Among POA com-ponents, CCOA is the major primary source, contributing 33 % of OA. CCOA also plays
5
a key role in chemically-resolved PM pollution during wintertime as its contribution in-creases linearly as a function of to the total NR-PM1mass. As a comparison, the OOA concentration remains relatively stable at high PM loadings and its contribution to the total NR-PM1decreases as the increase of PM pollution, which might indicate the
lim-ited SOA formation during high PM pollution episodes.
10
Meteorology is also important in PM pollution and aerosol processing in winter. Our results show that winds can clean up the PM pollution efficiently. As the ground wind speed is >∼3 m s−1, the mass concentrations of all aerosol species quickly drop to
<∼2 µg m−3. Note that the cleaning effects of winds appear to be slightly different for primary and secondary species at high RH periods. The relative humidity shows very
15
different impacts on nitrate and sulfate processes between summer and winter. In sum-mer, high humidity leads to a faster growth of nitrate, likely due to the transformation of HNO3to ammonium nitrate with access NH3in the atmosphere. However, the humidity
in winter shows a stronger effect on sulfate formation. In fact, the periods with high humidity in this study are often associated with fog events, therefore, fog processing
20
of high concentration of precursor SO2to form sulfate might be the major reason. The
temperature dependent aerosol composition highlights the increased PM emissions from vehicles at lower temperatures.
Supplementary material related to this article is available online at: http://www.atmos-chem-phys-discuss.net/13/2077/2013/
25
ACPD
13, 2077–2123, 2013Aerosol
composition, sources and processes in
China
Y. L. Sun et al.
Title Page
Abstract Introduction
Conclusions References
Tables Figures
◭ ◮
◭ ◮
Back Close
Full Screen / Esc
Printer-friendly Version Interactive Discussion
Discussion
P
a
per
|
Dis
cussion
P
a
per
|
Discussion
P
a
per
|
Discussio
n
P
a
per
|
Acknowledgement. This work was supported by the National Key Project of Basic Research
(2013CB955801), the National Natural Science Foundation of China (41175108, 40905068), and the Strategic Priority Research Program (B) of the Chinese Academy of Sciences (Grant No. XDB05020500). Additional support was provided by the Special Fund for Environmental Protection Research in the Public Interest (201009002) and Beijing Municipal Science and
5
Technology Commission (D09040903670904). We thank the Technical and Service Center, Institute of Atmospheric Physics, Chinese Academy of Sciences for providing the meteorology data.
References
Aiken, A. C., Salcedo, D., Cubison, M. J., Huffman, J. A., DeCarlo, P. F., Ulbrich, I. M.,
10
Docherty, K. S., Sueper, D., Kimmel, J. R., Worsnop, D. R., Trimborn, A., Northway, M., Stone, E. A., Schauer, J. J., Volkamer, R. M., Fortner, E., de Foy, B., Wang, J., Laskin, A., Shutthanandan, V., Zheng, J., Zhang, R., Gaffney, J., Marley, N. A., Paredes-Miranda, G., Arnott, W. P., Molina, L. T., Sosa, G., and Jimenez, J. L.: Mexico City aerosol analysis during MILAGRO using high resolution aerosol mass spectrometry at the urban supersite (T0) –
15
Part 1: Fine particle composition and organic source apportionment, Atmos. Chem. Phys., 9, 6633–6653, doi:10.5194/acp-9-6633-2009, 2009.
Alfarra, M. R., Prevot, A. S. H., Szidat, S., Sandradewi, J., Weimer, S., Lanz, V. A., Schreiber, D., Mohr, M., and Baltensperger, U.: Identification of the mass spectral signature of organic aerosols from wood burning emissions, Environ. Sci. Technol., 41, 5770–5777, 2007.
20
Allan, J. D., Williams, P. I., Morgan, W. T., Martin, C. L., Flynn, M. J., Lee, J., Nemitz, E., Phillips, G. J., Gallagher, M. W., and Coe, H.: Contributions from transport, solid fuel burning and cooking to primary organic aerosols in two UK cities, Atmos. Chem. Phys., 10, 647–668, doi:10.5194/acp-10-647-2010, 2010.
Canagaratna, M. R., Jayne, J. T., Ghertner, D. A., Herndon, S., Shi, Q., Jimenez, J. L.,
25
Silva, P. J., Williams, P., Lanni, T., Drewnick, F., Demerjian, K. L., Kolb, C. E., and Worsnop, D. R.: Chase studies of particulate emissions from in-use New York City vehicles, Aerosol Sci. Tech., 38, 555–573, 2004.
Canagaratna, M., Jayne, J., Jimenez, J. L., Allan, J. A., Alfarra, R., Zhang, Q., Onasch, T., Drewnick, F., Coe, H., Middlebrook, A., Delia, A., Williams, L., Trimborn, A., Northway, M.,