AMTD
8, 6469–6509, 2015Spectral Aerosol Extinction (SpEx)
C. E. Jordan et al.
Title Page
Abstract Introduction
Conclusions References
Tables Figures
◭ ◮
◭ ◮
Back Close
Full Screen / Esc
Printer-friendly Version Interactive Discussion
Discussion
P
a
per
|
Discussion
P
a
per
|
Discussion
P
a
per
|
Discussion
P
a
per
|
Atmos. Meas. Tech. Discuss., 8, 6469–6509, 2015 www.atmos-meas-tech-discuss.net/8/6469/2015/ doi:10.5194/amtd-8-6469-2015
© Author(s) 2015. CC Attribution 3.0 License.
This discussion paper is/has been under review for the journal Atmospheric Measurement Techniques (AMT). Please refer to the corresponding final paper in AMT if available.
Spectral Aerosol Extinction (SpEx): a new
instrument for in situ ambient aerosol
extinction measurements across the
UV/visible wavelength range
C. E. Jordan1,*, B. E. Anderson2, A. J. Beyersdorf2, C. A. Corr2,3, J. E. Dibb1,
M. E. Greenslade4, R. F. Martin2, R. H. Moore2, E. Scheuer1, M. A. Shook2,5,
K. L. Thornhill2,5, D. Troop6, E. L. Winstead2,5, and L. D. Ziemba2
1
Institute for the Study of Earth, Oceans, & Space, University of New Hampshire, Durham, NH, USA
2
NASA Langley Research Center, Hampton, VA, USA 3
Oak Ridge Associated Universities, Oak Ridge, TN, USA 4
Department of Chemistry, University of New Hampshire, Durham, NH, USA 5
Science Systems and Applications, Inc., Hampton, VA, USA 6
Southwest Research Institute, Durham, NH, USA *
AMTD
8, 6469–6509, 2015Spectral Aerosol Extinction (SpEx)
C. E. Jordan et al.
Title Page
Abstract Introduction
Conclusions References
Tables Figures
◭ ◮
◭ ◮
Back Close
Full Screen / Esc
Printer-friendly Version Interactive Discussion
Discussion
P
a
per
|
Discussion
P
a
per
|
Discussion
P
a
per
|
Discussion
P
a
per
|
Received: 7 April 2015 – Accepted: 5 June 2015 – Published: 29 June 2015
Correspondence to: C. E. Jordan ([email protected])
AMTD
8, 6469–6509, 2015Spectral Aerosol Extinction (SpEx)
C. E. Jordan et al.
Title Page
Abstract Introduction
Conclusions References
Tables Figures
◭ ◮
◭ ◮
Back Close
Full Screen / Esc
Printer-friendly Version Interactive Discussion
Discussion
P
a
per
|
Discussion
P
a
per
|
Discussion
P
a
per
|
Discussion
P
a
per
|
Abstract
We introduce a new instrument for the measurement of in situ ambient aerosol extinc-tion over the 300–700 nm wavelength range, the Spectral Aerosol Extincextinc-tion (SpEx) instrument. This measurement capability is envisioned to complement existing in situ instrumentation, allowing for simultaneous measurement of the evolution of aerosol op-5
tical, chemical, and physical characteristics in the ambient environment. In this work, a detailed description of the instrument is provided along with characterization tests
performed in the laboratory. Measured spectra of NO2 and polystyrene latex spheres
(PSLs) agreed well with theoretical calculations. Good agreement was also found with simultaneous aerosol extinction measurements at 450, 530, and 630 nm using CAPS 10
PMex instruments in a series of 22 tests including non-absorbing compounds, dusts, soot, and black and brown carbon analogs. SpEx can more accurately distinguish the presence of brown carbon from other absorbing aerosol due to its 300 nm lower wave-length limit compared to measurements limited to visible wavewave-lengths. Extinction spec-tra obtained with SpEx contain more information than can be conveyed by a simple 15
power law fit (typically represented by Ångström Exponents). Planned future improve-ments aim to lower detection limits and ruggedize the instrument for mobile operation.
1 Introduction
Over the past decade studies of aerosol optical properties have become an important topic of research motivated by large uncertainties that limited our predictive capabili-20
ties of climate (IPCC, 2007). While our climate predictions have become more robust in recent years, radiative forcing (RF) by aerosols “continue to contribute the largest uncertainty to the total RF estimate” (IPCC, 2014). As work has progressed in recent years via modeling, laboratory studies, ambient measurements, and satellite retrievals, complicated relationships have been revealed between aerosol primary sources and 25
AMTD
8, 6469–6509, 2015Spectral Aerosol Extinction (SpEx)
C. E. Jordan et al.
Title Page
Abstract Introduction
Conclusions References
Tables Figures
◭ ◮
◭ ◮
Back Close
Full Screen / Esc
Printer-friendly Version Interactive Discussion
Discussion
P
a
per
|
Discussion
P
a
per
|
Discussion
P
a
per
|
Discussion
P
a
per
|
and shape, the mixing state of an aerosol population, and particle number concentra-tions all play a role in the optical properties of aerosols in the ambient atmosphere.
Hence, many efforts are underway to investigate these features in ambient aerosols
to better characterize their optical properties, in the hopes of reducing uncertainties in calculating the Earth’s radiation budget. Conversely, it has also been suggested that 5
optical properties retrievals hold promise for remotely sensing aerosol size and compo-sition throughout the global troposphere as well as to forecast regional and local-scale air quality.
Aerosols interact with light both through scattering and absorption; the sum of these
is known as extinction. This interaction is wavelength (λ) dependent, often
character-10
ized by a power law where the Ångström exponent (α) is the power that defines the
slope of that relationship to wavelength (Ångström, 1929; Moosmüller and Chakrabarty, 2011):
p(λ)=λ−α (1)
wherep(λ) represents any parameter that can be represented with a power law.
Am-15
bient aerosol optical properties (extinction, scattering, and absorption) are each rep-resented in this way. Many currently available commercial aerosol instruments (e.g., laser-based methods) obtain these parameters at relatively few (3 or fewer) visible
wavelengths. For these instruments,α is calculated for two wavelengths (λ1,λ2) and it
is assumed that a power law represents the full wavelength range between those two 20
endpoints (Moosmüller and Chakrabarty, 2011), e.g.,
p(λ1) p(λ2) =
λ
1 λ2
−α
(2a)
α(λ1,λ2)=−ln(p(λ1)/p(λ2))
ln(λ1/λ2) (2b)
However, there is evidence that other mathematical relationships (e.g., non-linear
ex-pressions to account for curvature in log space) may offer a better fit for certain optical
AMTD
8, 6469–6509, 2015Spectral Aerosol Extinction (SpEx)
C. E. Jordan et al.
Title Page
Abstract Introduction
Conclusions References
Tables Figures
◭ ◮
◭ ◮
Back Close
Full Screen / Esc
Printer-friendly Version Interactive Discussion
Discussion
P
a
per
|
Discussion
P
a
per
|
Discussion
P
a
per
|
Discussion
P
a
per
|
parameters of specific types of aerosol over particular wavelength ranges (e.g., Eck
et al., 1999; Schuster et al., 2006). This suggests that extrapolatingα to wavelengths
outside of the measured range may be problematic, especially when extrapolating into the UV from measurements made at visible wavelengths. Hence, observations at sev-eral wavelengths (or over a broad range of wavelengths) particularly into the UV, would 5
be useful in more fully characterizing wavelength-dependent optical properties of am-bient aerosols (Laskin et al., 2015).
Wavelength-dependent optical properties are used to distinguish four aerosol types from each other: black carbon (BC), brown carbon (BrC), dust, and non-absorbing aerosols. The wavelength-dependence of aerosol light scattering depends on the size 10
distribution and particle shape, and less on the chemical composition of the aerosol. Aerosol light absorption, however, depends heavily on the chemical or molecular struc-ture within the particles. BC is the strongest absorber of visible light, with its
absorp-tion characterized byαabs∼1 (e.g., Yang et al., 2009; Desyaterik et al., 2013; Bond
et al., 2013). This wavelength dependence arises from the molecular structure of BC, 15
which is emitted with a graphite-like sheet structure (Bond and Bergstrom, 2006; Yang
et al., 2009). Such structures feature many π bonded carbon atoms with
delocal-ized electrons that readily absorb light across the ultraviolet (UV) through infrared (IR) wavelength range (Desyaterik et al., 2013), giving rise to the black color of soot. The graphitic sheets fold into spherules that then rapidly coagulate into loose aggregates 20
small enough with respect to visible and near-visible wavelengths that their
interac-tion with light falls within the Rayleigh regime, i.e.,αabs∼1 (Yang et al., 2009). In this
regime, refractive indices are assumed to be wavelength-independent (Moosmüller and Chakrabarty, 2011, and references therein).
In contrast, BrC (light absorbing organic carbon) has far fewer conjugated π
elec-25
AMTD
8, 6469–6509, 2015Spectral Aerosol Extinction (SpEx)
C. E. Jordan et al.
Title Page
Abstract Introduction
Conclusions References
Tables Figures
◭ ◮
◭ ◮
Back Close
Full Screen / Esc
Printer-friendly Version Interactive Discussion
Discussion
P
a
per
|
Discussion
P
a
per
|
Discussion
P
a
per
|
Discussion
P
a
per
|
many such bonds, absorption occurs into the IR wavelength range, but for BrC
absorp-tion is limited to UV and visible wavelengths. Aromatic rings offer a stable structure
for conjugated bonds in atmospheric molecules; however a single ring has too few bonds to absorb light in the near-UV or visible range. Substituted O or N molecules on a single ring, or multiple rings (i.e., polycyclic aromatic hydrocarbons, PAHs) shift the 5
absorption into the UV/Vis range leading to a characteristic wavelength dependence
for these BrC aerosols that features strong UV absorption such thatαabs>1 (Andreae
and Gelencsér, 2006; Moosmüller et al., 2009; Chen and Bond, 2010; Desyaterik et al., 2013). This results in BrC exhibiting a yellow-to-brown color, hence the term “brown car-bon”. BrC may be expected to optically evolve in the atmosphere since terminal double 10
bonds (and heteroatoms) are more susceptible to atmospheric oxidant attack, thereby
reducing the number of conjugated π electrons in the molecules that comprise BrC.
Conversely, SOA formation from oxidation products with suitable structure may lead to BrC formation in the atmosphere.
Dust particles are more weakly absorbing per mass in the mid-visible than either BC 15
or BrC, but are important absorbers in the atmosphere due to the mass of material emitted (Bond et al., 2013). The optical properties of dust depend on its mineral com-position, particle shape, aerosol size distribution, and modifications during atmospheric transport (Yang et al., 2009). Dust that contains iron oxides and clay is known to
signif-icantly absorb light in the UV/Vis range (Sokolik and Toon, 1999), with reports ofαabs
20
up to∼3 over 325–660 nm (Alfaro et al., 2004; Yang et al., 2009). Many other organic
and inorganic compounds in aerosols do not absorb light and are classified optically as non-absorbing (or pure scattering) aerosols, e.g., polystyrene latex spheres (PSLs), ammonium sulfate (AS), and sea salt (Washenfelder et al., 2013).
The characteristic wavelength dependence of absorption distinguishes these groups 25
from each other. Extinction, however, includes the effects of both scattering and
absorp-tion, where scattering dominates the two contributions. For example, even though dust
may have αabs∼3, the large size (typically supermicron diameters) of dust particles
(sub-AMTD
8, 6469–6509, 2015Spectral Aerosol Extinction (SpEx)
C. E. Jordan et al.
Title Page
Abstract Introduction
Conclusions References
Tables Figures
◭ ◮
◭ ◮
Back Close
Full Screen / Esc
Printer-friendly Version Interactive Discussion
Discussion
P
a
per
|
Discussion
P
a
per
|
Discussion
P
a
per
|
Discussion
P
a
per
|
micron diameter) particle sizes that may be comparable to each other in the ambient atmosphere, the scattering contribution may be expected to be similar, while the
ab-sorption contribution will clearly differ. In visible wavelengths, the relative difference in
absorption may be difficult to discern from the much larger scattering term when
mea-suring extinction. However, in the UV, particularly at wavelengths as short as 300 nm, 5
the absorption term may be expected to influence the shape of the extinction spectrum
such that differences among these groups may be determined.
Of these four groups of optically defined aerosols, BrC may be the most complex to quantify with myriad potentially important sources identified in the literature (see the recent review by Laskin et al. (2015) and references therein). Sources of BrC in-10
clude combustion (biogenic and fossil fuels), humic-like substances, and SOA com-pounds that are derived from anthropogenic and biogenic precursors (e.g., Andreae and Gelencsér, 2006; Hecobian et al., 2010). Identifying the specific compounds that contribute to BrC is challenging. Several studies have examined the absorption proper-ties of solution phase extracts (e.g., in water, methanol, or hexane solvents, e.g. Chen 15
and Bond, 2010; Hecobian et al., 2010; Zhang et al., 2011, 2013); however, the sol-ubility of the compounds in each solvent determines which compounds are extracted, and hence, the wavelength-dependence will reflect the compounds in solution. Other
factors will also affect solution-phase absorption, beyond the choice of solvent, which
include the degree of dilution (Zhang et al., 2013), pH (Jacobson, 1999), and degree 20
of dissolution (i.e., ionic vs. molecular forms) (Jacobson, 1999).
Given that different sources have been identified for BrC, where mixtures from
var-ious sources occur (whether POA, SOA, or both), photo-oxidative competition among
the compounds present may be expected to lead to differing evolution of BrC in the
at-mosphere. In some cases, photooxidation may reduce BrC over time, in others it may 25
AMTD
8, 6469–6509, 2015Spectral Aerosol Extinction (SpEx)
C. E. Jordan et al.
Title Page
Abstract Introduction
Conclusions References
Tables Figures
◭ ◮
◭ ◮
Back Close
Full Screen / Esc
Printer-friendly Version Interactive Discussion
Discussion
P
a
per
|
Discussion
P
a
per
|
Discussion
P
a
per
|
Discussion
P
a
per
|
a minor fraction of ambient aerosol mass, such that large changes in optical properties with aerosol age are not necessarily accompanied by large changes in mass spectra, FTIR, or NMR spectra (Bones et al., 2010). Hence, tools are needed to assess the op-tical evolution of ambient aerosols, along with tools used to investigate their chemical and physical qualities.
5
In addition to contributing to studies of ambient aerosol optical, physical, and chemi-cal evolution, directly measured aerosol extinction is expected to be useful for studies
of other important optical information as well. For example, single scatter albedo (ω(λ))
is a measure of the fraction of light scattered from the total extinction defined by the
ratio of the scattering coefficient (σscat(λ)) to the extinction coefficient (σext(λ)),
10
ω(λ)=σscat(λ)
σext(λ) =
σscat(λ)
σscat(λ)+σabs(λ) (3)
whereσext(λ) may also be expressed as the sum ofσscat(λ) and the absorption coeffi
-cient (σabs(λ)). This is an intensive property of a particle, a function of its composition
and independent of total aerosol concentration (Yang et al., 2009). For non-absorbing
particles,ω=1 at all wavelengths. This parameter is used in models to determine the
15
sign and magnitude of RF (Moosmüller and Chakrabarty, 2011). Often for in situ mea-surements, scattering is measured (e.g., nephelometry) and absorption is measured
(e.g., aethalometry), then summed to obtain extinction for the calculation ofω(λ).
Com-mercially available instruments are also available for the direct measurement of ex-tinction. However, these measurements are restricted to visible wavelengths and are 20
often at a few (one to three) wavelengths. See Washenfelder et al. (2013) for a re-cent synopsis of various measurement techniques for aerosol scattering, absorption,
and extinction. Direct extinction measurements of σext(λ) over both the UV and
visi-ble range would provide a useful addition to current measurement techniques for the
calculation ofω(λ).
25
AMTD
8, 6469–6509, 2015Spectral Aerosol Extinction (SpEx)
C. E. Jordan et al.
Title Page
Abstract Introduction
Conclusions References
Tables Figures
◭ ◮
◭ ◮
Back Close
Full Screen / Esc
Printer-friendly Version Interactive Discussion
Discussion
P
a
per
|
Discussion
P
a
per
|
Discussion
P
a
per
|
Discussion
P
a
per
|
Extinction across the UV/visible range (abbreviated SpEx) has been developed. In this work we introduce the new instrument and show laboratory test results performed at NASA Langley Research Center in March 2014 that characterize both the instrument performance as well as spectral properties of various laboratory-generated aerosols. The rack-mounted prototype configuration was deployed aboard the NASA Langley 5
Mobile Aerosol Characterization (MACH-2) laboratory during DISCOVER-AQ (Deriv-ing Information on Surface conditions from Column and Vertically Resolved Observa-tions Relevant to Air Quality) and obtained ambient spectra at stationary ground-sites. A subsequent paper will present data obtained during the DISCOVER-AQ Colorado field campaign in July/August 2014.
10
2 Experimental
Tests were performed with a calibrated NO2standard as well as laboratory-generated
aerosols to characterize the new instrument. A detailed description of SpEx follows, along with brief descriptions of the other instruments used to validate the new tech-nique.
15
2.1 SpEx description
SpEx is a modified version of the Aerosol Extinction-Differential Optical Absorption
Spectrometer (AE-DOAS) a custom built instrument that has been used in laboratory studies (Chartier and Greenslade, 2012). Development of SpEx adopted the measure-ment approach of AE-DOAS with improvemeasure-ments to allow for faster data acquisition and 20
enhanced sensitivity. These instruments use a White-type optical cell (White, 1942) in which the primary and two secondary concave mirrors have the same radius of curva-ture separated by a distance of twice the focal length. Light intensity in the cell (with an
AMTD
8, 6469–6509, 2015Spectral Aerosol Extinction (SpEx)
C. E. Jordan et al.
Title Page
Abstract Introduction
Conclusions References
Tables Figures
◭ ◮
◭ ◮
Back Close
Full Screen / Esc
Printer-friendly Version Interactive Discussion
Discussion
P
a
per
|
Discussion
P
a
per
|
Discussion
P
a
per
|
Discussion
P
a
per
|
(filtered air,I0) allowing for the calculation of aerosol extinction via Beer’s Law:
σext=−ln(I/I0)
L (4)
Extinction is expressed in units of inverse length. For convenience, in the ambient
at-mosphere the units typically used are inverse megameters (Mm−1).
These instruments (AE-DOAS and SpEx) are comprised of three key components 5
coupled with fiber optics: a broadband xenon lamp, a closed White-type multi-pass cell, and a spectrometer. The main improvements to AE-DOAS are detailed here and include: a longer optical path length and a 16-bit spectrometer to improve sensitiv-ity; larger orifices to allow for faster flow rates, more rapid air exchange in the cell, and hence faster data acquisition; automated operation for 24 h sampling in the field that in-10
cludes flow control, switching between filtered and unfiltered lines, and data acquisition.
SpEx offers a rack-mountable design for field studies of ambient aerosol monitoring.
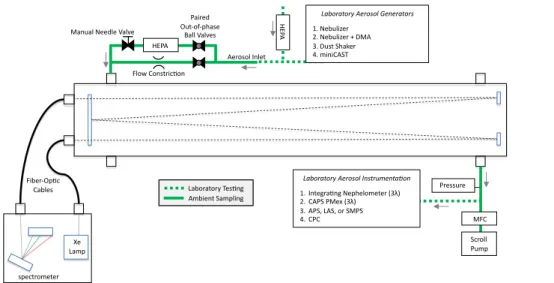
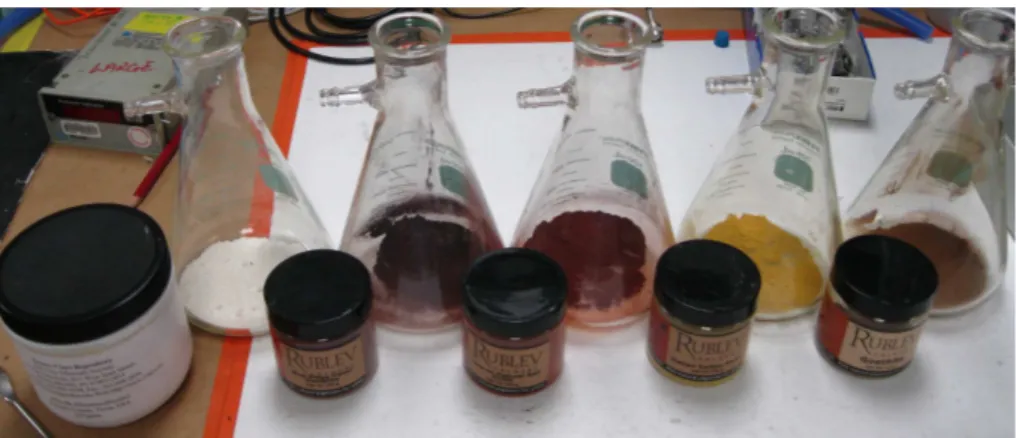
SpEx (Fig. 1) was custom designed based on the UV 5000 gas analyzer system (Cerex Monitoring Solutions, LLC, Atlanta, GA) with a 150 W xenon lamp source, inte-grated with an Ocean Optics, Inc. (Dunedin, FL) QE65Pro 16-bit spectrometer. These 15
components are coupled with 600 µm fiber optic cables to a custom designed White-type optical cell fabricated by Cerex Monitoring Solutions, LLC., out of aluminum with
rectangular dimensions of 6′′×4.25′′×56.18′′(15.24 cm×10.8 cm×142.7 cm) and an
internal volume of approximately 17 L. The QE65Pro includes their standard detector and a composite grating with a 725 nm bandwidth starting at 200 nm. The built-in cool-20
ing system of the spectrometer allows the detector to be cooled down to −20◦C to
minimize noise. The fiber optic cables are 2 m long with heavy duty metal jacketing. Constructed from a rectangular tube, two ports were cut in the top of the cell above the optics to allow for adjusting the optical alignment. Four side ports, two at each end, allow for flexible configuration of air inflow and outflow ports for rack mounting. 25
AMTD
8, 6469–6509, 2015Spectral Aerosol Extinction (SpEx)
C. E. Jordan et al.
Title Page
Abstract Introduction
Conclusions References
Tables Figures
◭ ◮
◭ ◮
Back Close
Full Screen / Esc
Printer-friendly Version Interactive Discussion
Discussion
P
a
per
|
Discussion
P
a
per
|
Discussion
P
a
per
|
Discussion
P
a
per
|
rapid air exchange within the volume, and were actively controlled using a mass-flow controller (MFC). To ensure complete air exchange between the sample and reference air within the optical cell, a flush volume of at least three times the internal volume of
the cell (17 L×3=51 L) must be used. At 80 Lpm this takes approximately 40 s. In the
laboratory tests, a flush time of 90 s was used with the particle counts in the outflow of 5
the optical cell monitored to ensure the air was fully exchanged between the sample (unfiltered) and reference (filtered) lines, which were autonomously cycled using a pair of electrically-actuated, straight-path ball valves. The change in pressure, measured downstream of the sample cell, when switching from sample and reference lines was minimized (to less than 1 torr) by slightly restricting flow in the sample line and manually 10
setting the filter-line pressure drop (at a constant flow rate) using a needle valve. This allowed accurate measurements and negligible particle transmission loss.
The White-type cell (Fig. 1) is designed to allow for a range of optical path lengths. With a 48 inch (1.23 m) basepath between mirrors, an alignment with 6 spots across the top of the primary mirror (28 passes total) provides an optical path length of 34.4 m, 15
while the maximum of 8 spots (36 passes total) extends the path to 44.3 m. In tests at
Cerex Monitoring Solutions, 7 spots (32 passes total) were found to offer the optimum
path length of 39.4 m, given the light source and the efficiency of the mirror coatings
over the UV/Vis range. Note that the optical path results in two rows of light spots on the primary mirror. Notches cut out of the top half of the primary mirror at either end 20
allow incoming and outgoing light to enter and exit the cell via the fiber optic ports. As this is a broadband light source, the spot size is large (on the order of 1 cm). Longer wavelengths of the light wave are toward the center of the spot, while the shorter wavelengths are toward the outside of the spot. Since the spot is larger than the fiber diameter (600 µm), as the mirror alignment is adjusted slightly, the sampled 25
AMTD
8, 6469–6509, 2015Spectral Aerosol Extinction (SpEx)
C. E. Jordan et al.
Title Page
Abstract Introduction
Conclusions References
Tables Figures
◭ ◮
◭ ◮
Back Close
Full Screen / Esc
Printer-friendly Version Interactive Discussion
Discussion
P
a
per
|
Discussion
P
a
per
|
Discussion
P
a
per
|
Discussion
P
a
per
|
750–800 nm exhibit low intensity, while those>800 nm tend to be most intense. In
order to optimize for sampling over the 300–700 nm wavelength range, the spectral sampling is adjusted to maximize the intensity over that range, while the integration time is set such that the infrared channels saturate (Fig. S1). When properly aligned, an integration time of 20–50 ms maximizes the intensity counts without saturation over 5
the 300–700 nm range.
2.2 SpEx operation, variance tests, and limit of detection
For typical ambient atmospheric particle concentrations, extinction represents a small
difference between two large numbers, I and I0. As a result, care must be taken to
minimize sampling bias and noise. Prior to any sample collection, the instrument is 10
turned on and allowed to warm up for ∼1 h to allow the lamp to thermally stabilize.
Measured intensity may drift slightly between spectra (typically<1 %). This may arise
from thermal variability of the lamp, temperature variations of the gas cell inducing mi-nor fluctuations of the optics, or variability in the power source for the lamp. To limit any variability in the extinction calculation that may arise from a drift in intensity, the 15
extinction is automatically calculated by averaging the reference spectra collected im-mediately prior to and following a given sample spectra.
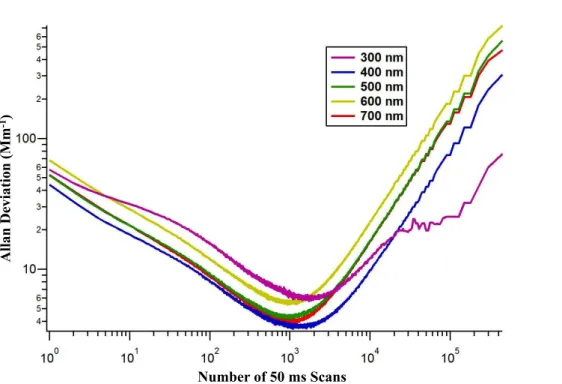
Noise arises in optical instrument systems both from high and low frequency sources that can be characterized by an Allan variance calculation. Such a calculation is used to identify the optimum sampling interval, i.e., sampling over too few spectra results 20
in noise from high frequency sources, while sampling over too many results in noise from low frequency sources. A plot of Allan variance shows the optimum sample size to minimize noise in the signal. Using an integration time of 50 ms per spectrum (the upper end of the range used for sampling prior to realigning the optics) and a flow rate of 90 Lpm, filtered air was pulled through the system and spectra were acquired 25
in a 13 h test. The Allan deviation of the average vs. the number of scans shows that
for SpEx∼1000 spectra provide the best sensitivity over the 300–700 nm wavelength
AMTD
8, 6469–6509, 2015Spectral Aerosol Extinction (SpEx)
C. E. Jordan et al.
Title Page
Abstract Introduction
Conclusions References
Tables Figures
◭ ◮
◭ ◮
Back Close
Full Screen / Esc
Printer-friendly Version Interactive Discussion
Discussion
P
a
per
|
Discussion
P
a
per
|
Discussion
P
a
per
|
Discussion
P
a
per
|
At 50 ms, it takes 50 s to collect 1000 spectra. From Fig. 2 however, it is evident
that fewer spectra can offer sensitivity nearly as good, while allowing for faster data
acquisition. On the basis of laboratory tests (data not shown) and the Allan variance calculations, it was found that a 30 s sampling time provided good sensitivity with low noise. For 600 spectra (30 s sampling time for 50 ms integration) the Allan variance 5
was±4.1–7.6 Mm−1 over 300–700 nm. Intensity spectra were acquired at a temporal
resolution of 125 s (90 s flush, 30 s sample, plus a 5 s delay added to allow time for valves to open and close to switch between the filtered and unfiltered lines). As a result, aerosol extinctions were obtained with a 250 s time resolution.
These data suggest a 3σlimit of detection of∼12–23 Mm−1over 300–700 nm
wave-10
lengths for the individual laboratory spectra presented here. This detection limit is ad-equate for ambient aerosol measurements in most ambient boundary layer
environ-ments (typical mid-visible scattering is 57 Mm−1for average background environments
and 23 Mm−1 for clean continental background environments, Seinfeld and Pandis,
1998). For ground-based measurements in clean continental environments, by mak-15
ing use of the standard error of the mean individual extinction spectra may be aver-aged thereby reducing the error by the square root of the number of samples in the
mean. Hourly averages (16 spectra) have the effect of reducing the error by a factor
of 4, thereby reducing the detection limit to 3–6 Mm−1 over the 300–700 nm range.
Thus, this data reduction scheme is able to sufficiently characterize both concentrated
20
plumes and background conditions on reasonable time-scales.
2.3 Validation instruments
The Cavity Attenuated Phase Shift extinction (CAPS PMex) monitor, manufactured by Aerodyne Research, is an optical extinction spectrometer which has a light emitting diode (LED) as a light source, a 26 cm long sample cell with two high reflectivity mir-25
rors and a vacuum photodiode detector. Due to its configuration, the cell cavity has an
effective path length of approximately 2 km. Similar in principle to a cavity ring down
AMTD
8, 6469–6509, 2015Spectral Aerosol Extinction (SpEx)
C. E. Jordan et al.
Title Page
Abstract Introduction
Conclusions References
Tables Figures
◭ ◮
◭ ◮
Back Close
Full Screen / Esc
Printer-friendly Version Interactive Discussion
Discussion
P
a
per
|
Discussion
P
a
per
|
Discussion
P
a
per
|
Discussion
P
a
per
|
the light within the sample cell. Particles in the cell decrease this time due to scattering and absorption. The particle light extinction is determined from changes in the phase shift of the distorted waveform of the square-wave modulated LED light that is
trans-mitted through the optical cell. Three CAPS PMex monitors were used with differing
wavelengths (450, 530, and 630 nm). The CAPS PMex particle optical extinction mon-5
itor has a range of 0–4000 Mm−1, resolution of 0.1 Mm−1and a sensitivity of 2.5 Mm−1
in a 1 s sampling period.
The TSI Inc. Integrating Nephelometer (model 3563) measures aerosol scattering at three visible wavelengths (450, 550 and 700 nm) for the total angular range between 7
and 170◦. The measurement can be corrected for truncation (i.e. the missing scattering
10
not measured for angles 0–7◦ and 170–180◦) based on Anderson and Ogren (1998).
The instrument was regularly zeroed with particle-free air and calibrated with CO2.
Scattering is measured at 1 Hz and a sensitivity of 0.1 Mm−1for 60 s averaging period.
2.4 Aerosol generation
Dust aerosol samples were generated by a Wrist Action Shaker (Burrell model 75) with 15
the speed varied to change the aerosol concentration. The motion of the shaker sus-pends the dust into the sample air stream via saltation (Kumar et al., 2011). The dust was either sampled as produced or through a stainless steel cyclone (URG) with a 1 micron cut at 10 Lpm. The flow through the cyclone could be changed to result in a
dif-fering aerosol size distribution. Changes between the PM1and PM2.5tests described in
20
Sect. 3 were verified with an Aerodynamic Particle Sizer (APS, TSI, Inc. model 3321). Soot samples were generated by a quenched propane burner (miniCAST Series 4202, Jing Ltd) with variable nitrogen-to-fuel ratios used to vary soot size and soot compo-sition (Moore et al., 2014). Liquid aerosols were generated from aqueous solutions by a TSI Inc. aerosol nebulizer (model 3076). In all cases the generators did not pro-25
duce enough flow (1–10 Lpm) to accommodate all the instrumentation, so particle-free air was added to the output from the aerosol generators. For some tests, aerosols
AMTD
8, 6469–6509, 2015Spectral Aerosol Extinction (SpEx)
C. E. Jordan et al.
Title Page
Abstract Introduction
Conclusions References
Tables Figures
◭ ◮
◭ ◮
Back Close
Full Screen / Esc
Printer-friendly Version Interactive Discussion
Discussion
P
a
per
|
Discussion
P
a
per
|
Discussion
P
a
per
|
Discussion
P
a
per
|
Particle number concentrations were measured (by a Condensation Particle Counter,
CPC, TSI 3775) to verify sufficient flush timing and to verify constant test conditions.
Measurements of size distributions of submicron (by a Scanning Mobility Particle Sizer, SMPS, TSI) and supermicon (by a Laser Aerosol Spectrometer, LAS, TSI Inc.) aerosols during laboratory testing were used to confirm the generated aerosol characteristics. 5
3 Results
3.1 Accuracy of measured spectra
3.1.1 O3, NO2, & PSL tests
Laboratory tests were designed to document the accuracy of SpEx extinction spectra
by assessing: (1) whether the filter used to remove the aerosols also removed NO2
10
such that measured spectral characteristics include gas-phase differences unrelated
to aerosol extinction, (2) whether the intense UV lamp light photolyzed NO2 to O3
in the optical cell, and (3) whether the measured spectral shapes were consistent with
expectations from theoretical calculations. NO2efficiently absorbs light in the UV/visible
range, motivating test #1. It is also readily photolyzed by UV light, making it useful for 15
testing photolysis in the optical cell by the lamp (test #2).
100 ppb NO2 was measured (using a Los Gatos Research instrument model 907)
across the sample-line filter showing negligible difference in mixing ratio between
down-stream and updown-stream locations, suggesting the filter is not modifying the NO2
concen-tration between the filtered and unfiltered sampling lines. Tests using both O3(Thermo
20
Environmental Instruments model 49C ozone analyzer) and NO2 showed that O3 is
not being produced (conversely NO2is not lost) in the optical cell by the light sources
with 70–80 Lpm flow. Minimal surface losses across the optical cell were found in both
the O3(9 ppb in the cell v. 15 ppb in room air, on average) and NO2(92 ppb v. 100 ppb
calibrated inflow) tests. However, the advantage of the difference method employed in
AMTD
8, 6469–6509, 2015Spectral Aerosol Extinction (SpEx)
C. E. Jordan et al.
Title Page
Abstract Introduction
Conclusions References
Tables Figures
◭ ◮
◭ ◮
Back Close
Full Screen / Esc
Printer-friendly Version Interactive Discussion
Discussion
P
a
per
|
Discussion
P
a
per
|
Discussion
P
a
per
|
Discussion
P
a
per
|
the SpEx measurement is that gas-phase losses in the optical cell affect both the
sam-ple and reference lines in the same way, cancelling each other out as long as ambient mixing ratios are constant throughout the full sample/background cycle.
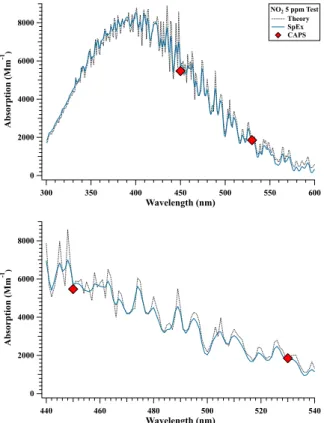
Two sets of tests were performed measuring absorption spectra of NO2and
extinc-tion spectra of PSLs to verify measurements with theory. NO2tests were performed by
5
slowly filling the cell, capping it, then collecting spectra, in order minimize the volume of calibration gas used. Stopping the flow led to increased surface losses. Correcting the SpEx absorption spectra for these losses, it is clear that SpEx obtained a curve
that captured the expected features calculated from GOME/SCIAMACHY NO2
cross-section data binned to 1 nm resolution (Fig. 3). A minor offset of ∼1 nm in the SpEx
10
absorption spectrum was found compared to the theoretical curve, requiring a
correc-tion of+1 nm to the nominal SpEx wavelength. The excellent agreement shown here
highlights both the coarse and fine-scale accuracy of the SpEx technique for obtain-ing extinction spectra across a wide wavelength range. In laboratory aerosol studies fine-scale accuracy has been applied to retrieve refractive indices (e.g, Chartier and 15
Greenslade, 2012).
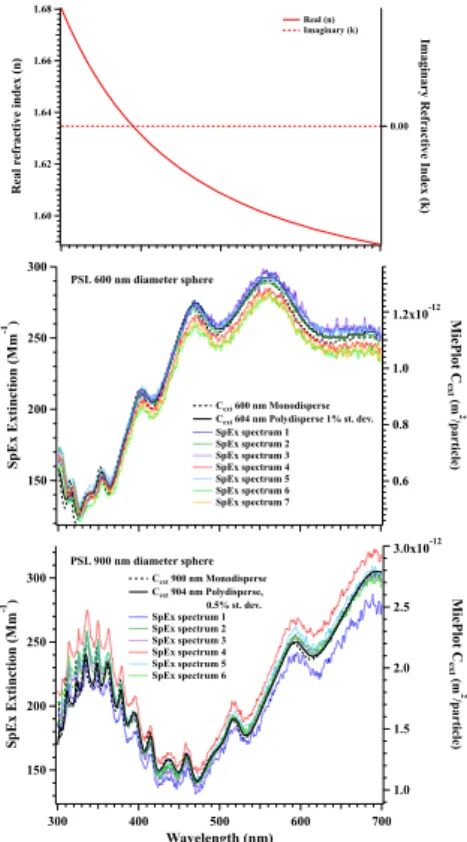
The second set of tests measured the extinction spectra from 600 and 900 nm PSL spheres (Fig. 4). Mie theory calculations were performed with MiePlot v4.3 (http://philiplaven.com/mieplot.htm) using the wavelength-dependent refractive index
for PSLs provided with that code. The calculated extinction cross-sections (Cext,
20
m2particle−1) scaled to the measured extinction spectra for 600 and 900 nm PSLs show
excellent agreement (Fig. 4). Sensitivity tests of the Mie cross-section calculations to the particle radius and the dispersion of the aerosol size distribution show peaks in the extinction spectrum shift to longer wavelengths with increasing particle size, while the amplitude of the peaks flatten as the size distribution broadens (Fig. S2). The fine 25
re-AMTD
8, 6469–6509, 2015Spectral Aerosol Extinction (SpEx)
C. E. Jordan et al.
Title Page
Abstract Introduction
Conclusions References
Tables Figures
◭ ◮
◭ ◮
Back Close
Full Screen / Esc
Printer-friendly Version Interactive Discussion
Discussion
P
a
per
|
Discussion
P
a
per
|
Discussion
P
a
per
|
Discussion
P
a
per
|
spectively (Fig. 4). These results are within the manufacturer calibration specifications
for the two lots used here with 600 nm±9 and 903 nm±9 nm for the mean diameters
with size distributions of 10.0 nm standard deviation; 1.7 % CV and 9.3 nm standard deviation; 1.0 % CV, respectively.
3.1.2 Comparison of SpEx with CAPS PMex extinction and nephelometer
5
scattering
Wavelength-dependent refractive indices are not known for many aerosols generated in the laboratory. In such cases, comparisons to other measurements are useful for testing the performance of the SpEx instrument. A series of tests were performed us-ing a variety of laboratory-generated aerosols rangus-ing from pure scatterers to various 10
materials that absorb light (Table S2). Fullerene soot and Aquadag are commercially available and have been suggested to be used as surrogates for combustion produced soot (Gysel et al., 2011; Baumgardner et al., 2012; Beyersdorf et al., 2014). All of the measured SpEx extinction spectra (30 s sampling period) were compared with extinc-tion and scattering measured at 3 visible wavelengths by CAPS PMex (450, 530, and 15
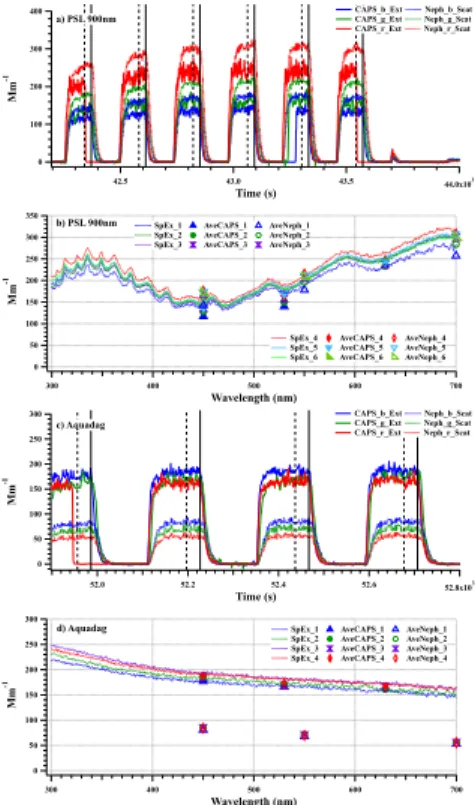
630 nm) and nephelometer (450, 550, and 700 nm) instruments, respectively. CAPS PMex and nephelometer record 1 s data, which were averaged over the 30 s intervals coinciding with the SpEx sampling periods. The shape of the CAPS PMex and neph-elometer curves in these tests (e.g., Fig. 5a and c) reflects the switching between fil-tered (zero extinction and scattering) and unfilfil-tered (nonzero extinction and scattering), 20
with each period about 2 min in length (90 s flush followed by 30 s sample collection by SpEx). CAPS PMex and nephelometer periodically zero resulting in channels that oc-casionally switch between zero and sample values independently of the air flow through
SpEx. Note, part of the offset between the nephelometer and CAPS PMex evident in
Fig. 5a and c arises from the different wavelengths measured. However, in Fig. 5b good
25
AMTD
8, 6469–6509, 2015Spectral Aerosol Extinction (SpEx)
C. E. Jordan et al.
Title Page
Abstract Introduction
Conclusions References
Tables Figures
◭ ◮
◭ ◮
Back Close
Full Screen / Esc
Printer-friendly Version Interactive Discussion
Discussion
P
a
per
|
Discussion
P
a
per
|
Discussion
P
a
per
|
Discussion
P
a
per
|
Two examples from this series of aerosol tests are shown in Fig. 5: PSL 900 nm and Aquadag. Here, the SpEx extinction spectra are shown without any smoothing and are plotted using the nominal (rather than corrected) wavelengths. This choice was made to
show the reader the low noise and smooth spectral curves obtained from the difference
calculation applied to the spectra acquired over the 30 s sampling interval described in 5
Sect. 2.2. Most of the test data do not exhibit the fine structure evident in the PSL 600 and 900 nm tests. This is due to the relatively broad size distributions of the particles generated, compared to the monodisperse PSL particles. Hence, the 1 nm wavelength correction is likely insignificant for the majority of laboratory and ambient aerosols. For
clarity, error bars of±6 Mm−1 (1σ) for the extinction spectra are not shown. Similarly,
10
error bars are omitted for CAPS PMex and nephelometer average data, however, the
markers are scaled to approximate their±1σ range. The two examples presented in
Fig. 5 were chosen to illustrate the typically good agreement found between CAPS
PMex and SpEx extinction. They also illustrate the small difference between extinction
and scattering for aerosols that do not absorb light (e.g., PSL 900 nm), vs. the large 15
difference found for aerosols that do absorb light (e.g., Aquadag).
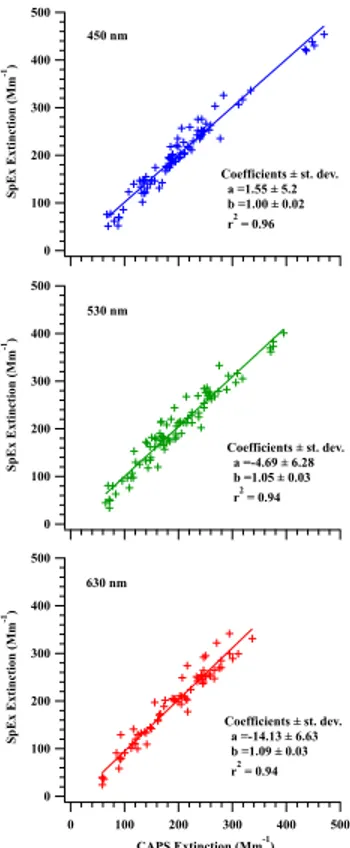
Twenty-two aerosol tests were performed (Table S2) recording 2–7 spectra in each test (typically 3 or 4) resulting in a total of 87 spectra. SpEx data were averaged over 5 nm corresponding to each CAPS PMex wavelength in order to plot SpEx vs. CAPS PMex extinctions (Fig. 6). Good agreement was found between these measurements 20
with slopes near unity at all three wavelengths andr2 values of 0.94–0.96. These
re-sults, along with those of the NO2and PSL tests, indicate that SpEx provides accurate
spectral information within the precision of the instrument.
3.2 Comparison of normalized aerosol extinction spectra
The magnitude of the extinctions measured for these aerosol tests ranged from∼50–
25
500 Mm−1 (Fig. 6), a reasonable range for polluted ambient conditions. In order to
compare the shape of each spectrum with others from aerosols of similar size and
AMTD
8, 6469–6509, 2015Spectral Aerosol Extinction (SpEx)
C. E. Jordan et al.
Title Page
Abstract Introduction
Conclusions References
Tables Figures
◭ ◮
◭ ◮
Back Close
Full Screen / Esc
Printer-friendly Version Interactive Discussion
Discussion
P
a
per
|
Discussion
P
a
per
|
Discussion
P
a
per
|
Discussion
P
a
per
|
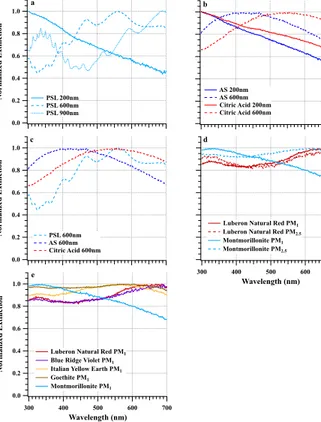
was normalized such that the maximum extinction observed was scaled to a value of 1 (Fig. 7). A comparison of the PSL spectral shapes illustrates the shift of peak extinction from longer to shorter wavelengths with decreasing particle diameter from 900 to 200 nm (Fig. 7a). This is consistent with the expectation that particles interact
most efficiently with wavelengths of light that are similar to their diameter. This is also
5
evident in the AS and citric acid tests where data were obtained for 200 and 600 nm particle sizes (Fig. 7b).
Variability in the wavelength dependence of the spectra is also found among 600 nm
particles of three different compositions (Fig. 7c). This variability in shape arises from
differences in the refractive indices of these materials, along with some variability that
10
may be due to minor differences in the size distributions (e.g., the fine structure in
the PSL spectrum arises from a nearly monodisperse size distribution whereas the DMA size selected AS and citric acid particles were more broadly dispersed). Spectral comparisons of particles with a constant size illustrate the SpEx capability to assess fine-scale features due entirely to variability in chemical composition.
15
Dust particles are known to more efficiently extinguish light across all wavelengths
and the SpEx spectra are consistent with this expectation (Fig. 7). Five powders
(Ta-ble S2, Fig. 8) were used for PM1size distribution tests, while only two (montmorillonite
and Luberon Natural Red powders) were used for PM2.5tests. Note, four of the five dust
samples tested are sold as pigments, hence, their commercial names are used here 20
(Natural Pigments, Willits, California). This particular set of dust samples was selected to represent a broad range of pigments (Fig. 8).
The extinction spectra for montmorillonite are consistent with the previous tests in that the maximum extinction is found at longer wavelengths for the larger particles
(Fig. 7d). However, for Luberon Natural Red, there is surprisingly little difference
be-25
tween the PM1and PM2.5spectra. This suggests the pigment of Luberon Natural Red
affected the shape of the spectrum in both tests. Consider the extinction spectra for
all five PM1 dust samples (Fig. 7e). Both Blue Ridge Violet and Luberon Natural Red
AMTD
8, 6469–6509, 2015Spectral Aerosol Extinction (SpEx)
C. E. Jordan et al.
Title Page
Abstract Introduction
Conclusions References
Tables Figures
◭ ◮
◭ ◮
Back Close
Full Screen / Esc
Printer-friendly Version Interactive Discussion
Discussion
P
a
per
|
Discussion
P
a
per
|
Discussion
P
a
per
|
Discussion
P
a
per
|
of these samples (Fig. 8), while both Italian Yellow Earth and Goethite peak between 500–600 nm. Only the bright white montmorillonite peaks at the short UV wavelengths. The brown colored Goethite exhibits the smallest wavelength dependence in its spec-trum, while montmorillonite exhibits the largest dependence. These results indicate that the mineral composition influences the spectral shape in addition to the dominant role 5
of size distribution on extinction.
As is evident in Fig. 7, small particles exhibit extinction peaks at the shortest wave-lengths measured by SpEx. Normalizing the mean curves to their maximum value (at
300 nm in the remaining tests performed) has the effect of visually suppressing the
variability of such spectra in the UV region, while highlighting differences in the longer
10
wavelength visible range. Since we are trying to investigate what aerosol information may be found in extinction spectra, particularly in the UV, we have scaled the rest of
the normalized spectra to their values at 700 nm. This scaling produces the effect of
visually highlighting the differences in the spectral shapes in the UV (Fig. 9).
Not all of the materials used generated enough aerosol mass in the liquid nebulizer 15
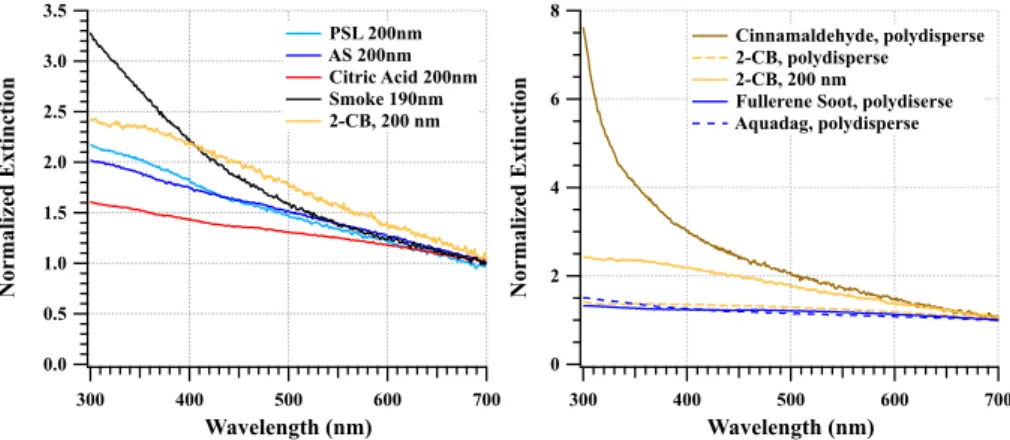
to allow for size selection. The slow flow rate of the DMA (1–2 Lpm) used for the size selection from the nebulized polydisperse aerosol leads to a highly diluted contribution in the 80 Lpm air flow into the 17 L optical cell. Hence, 200 nm diameter particle spectra were only obtained for PSL, AS, citric acid, and 2-carboxybenzaldehyde (2-CB), i.e., those materials that produced high concentrations of particles from which to select the 20
200 nm size range. The remaining spectra were obtained from the polydisperse size distributions generated from Fullerene soot, Aquadag, and cinnamaldehyde.
The 200 nm laboratory test aerosols from 4 different solutions all exhibit larger
ex-tinctions at 300 nm than 700 nm, ranging from a factor of 1.6 to 2.4 larger (Fig. 9, left panel). In addition, 190 nm soot particles generated from a mini-CAST instrument 25
burning propane has an extinction∼3.25 times larger at 300 nm than 700 nm. Yet, from
500–700 nm, the spectral differences among these compounds are small. The
spec-tral shapes obtained from the polydisperse BrC and BC surrogates show very different
AMTD
8, 6469–6509, 2015Spectral Aerosol Extinction (SpEx)
C. E. Jordan et al.
Title Page
Abstract Introduction
Conclusions References
Tables Figures
◭ ◮
◭ ◮
Back Close
Full Screen / Esc
Printer-friendly Version Interactive Discussion
Discussion
P
a
per
|
Discussion
P
a
per
|
Discussion
P
a
per
|
Discussion
P
a
per
|
larger at 300 nm than 700 nm (Fig. 9, right panel). However, polydisperse cinnamalde-hyde has a strongly curved spectrum where extinction at 300 nm is 7.5 times larger than at 700 nm. The characteristic trait of BrC is strongly enhanced absorption in the UV spectral range. Both 2-CB and cinnamaldehyde were tested here specifically to identify a possible BrC surrogate. Clearly, cinnamaldehyde exhibits behavior typical of 5
BrC, while 2-CB does not. Hence, only cinnamaldehyde is used to represent BrC for the rest of this discussion. It should be noted that given the variable sources of BrC and
the differing photochemical fates of the diverse chemical compounds that are likely to
contribute to BrC (e.g., Lee et al., 2014; Laskin et al., 2015), there is no widely adopted standard BrC surrogate.
10
To test the spectral shapes of soot generated from propane in the mini-CAST, two settings were used that generated either more or less oxygen in the soot based on the work of Moore et al. (2014). Neither is strictly brown or black carbon, but one has
a higher O : C ratio than the other. Small particles, ∼40 nm in diameter were
gener-ated in both tests. As expected the “high” O : C soot exhibits enhanced UV extinction 15
(via absorption) compared to the “low” O : C soot (Fig. 10). Here, both soot tests show greater enhancement at 300 nm than observed for either BC surrogate (Fullerene soot or Aquadag), which is not surprising given the smaller particle size generated by the propane flame. Neither soot test is as strongly enhanced as cinnamaldehyde, even given its larger particle size. While the comparison between the two soot tests should 20
reflect differences in composition, some of the difference among the three polydisperse
curves undoubtedly arises from size distribution differences. Hence the comparison
here is mainly to illustrate the different spectral shapes expected for BC and BrC when
absorption makes a significant contribution to the extinction signal and to use the sur-rogates simply to provide context for the 40 nm soot tests.
25
As discussed in the introduction, the extinction spectrum is expected to follow an in-verse power law relationship with wavelength as in Eq. (1). An Ångström exponent can be calculated based on any pair of wavelengths via Eq. (2b) and should be constant
AMTD
8, 6469–6509, 2015Spectral Aerosol Extinction (SpEx)
C. E. Jordan et al.
Title Page
Abstract Introduction
Conclusions References
Tables Figures
◭ ◮
◭ ◮
Back Close
Full Screen / Esc
Printer-friendly Version Interactive Discussion
Discussion
P
a
per
|
Discussion
P
a
per
|
Discussion
P
a
per
|
Discussion
P
a
per
|
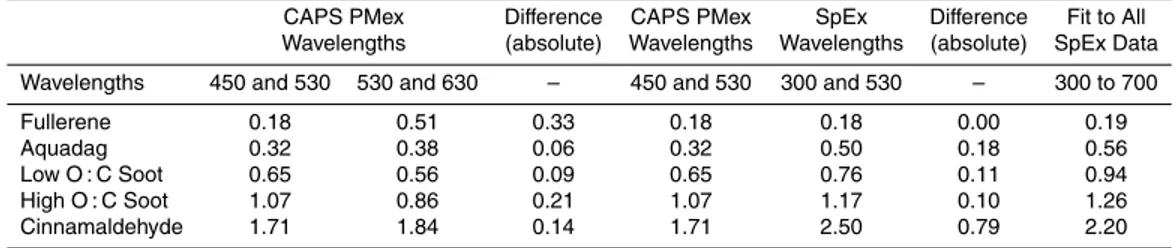
from two pairs of SpEx wavelengths (chosen to match those measured by CAPS PMex: 450 and 530 nm, and 530 and 630 nm) for the compounds shown in Fig. 10, clearly
exhibit some variability in αext depending on the wavelength pair (Table 1). The
dif-ferences between the two visible wavelength pairs range from 0.06 to 0.33 (Table 1). Taking advantage of the capability of SpEx to measure into the UV down to 300 nm, 5
these visible wavelength pairs may also be compared to a UV-visible wavelength pair,
e.g., 300 and 530 nm (Table 1). Absolute αext differences between the 450, 530 nm
pair and a SpEx-enabled 300, 530 nm pair are small for typical BC surrogates (0.00 to 0.18) but significant for the BrC surrogate (cinnamaldehyde, 0.79). This suggests that
(1)αextvalues derived from visible wavelength measurements are acceptably
extrapo-10
lated into the UV for absorbing aerosols dominated by BC, and (2) extrapolation is not possible for aerosols containing BrC. For the latter, additional spectral information in the UV must be used to discern these aerosols from other aerosol types.
In addition to calculatingαextfor particular wavelength pairs, power law line fits were
performed for the mean spectrum obtained from each aerosol test. Here, we modify 15
Eq. (1) for the fitting asσext(λ)=Aλα where typicallyA∼1 andα is constrained to
al-ways be negative. Power laws are used when decades of data are spanned in log-log
space over the relevant intervals inxandy. However, over 300–700 nm in wavelength,
none of the test data spanned more than a decade. Most of the tests in log-log space exhibit only a narrow range of extinction and nearly all of the test spectra exhibit cur-20
vature. This curvature is whyαext is sensitive to the choice of wavelength pairs used
in its calculation. None of the test spectra were well fit by a power law function con-strained as described above. In all cases polynomials provided a better fit to the data. If a data set is well fit by a mathematical function, then the residuals (values resulting from subtracting the fit values from the raw data values) should reflect random noise 25
AMTD
8, 6469–6509, 2015Spectral Aerosol Extinction (SpEx)
C. E. Jordan et al.
Title Page
Abstract Introduction
Conclusions References
Tables Figures
◭ ◮
◭ ◮
Back Close
Full Screen / Esc
Printer-friendly Version Interactive Discussion
Discussion
P
a
per
|
Discussion
P
a
per
|
Discussion
P
a
per
|
Discussion
P
a
per
|
than can be conveyed by a power law fit and that examination of features in certain
spectral ranges (e.g., in the UV for identification of BrC) may offer greater insight into
the characteristics of the aerosols when measured with SpEx.
4 Conclusions
A new instrument, the Spectral Aerosol Extinction (SpEx) instrument, for the measure-5
ment of ambient aerosol extinction spectra over the 300–700 nm wavelength range
has been described and characterized in the laboratory with NO2 and a variety of
aerosols, generated from non-absorbing materials, dusts, smoke, and BC and BrC analogs. SpEx is still under development with ongoing work to further reduce noise, improve precision, and reduce the detection limit. It is anticipated that prior to the next 10
field deployment the detection limits of individual spectra will be significantly reduced. Nonetheless, as reported herein SpEx performed well in all laboratory tests.
Good agreement with theoretical calculations for NO2 and PSL spheres was found.
Correlations between SpEx and CAPS PMex extinction measurements at 450, 530,
and 630 nm showed good agreement for all of the aerosol tests withr2values of 0.94–
15
0.96. The aerosol test results reveal distinct differences in the spectral shapes obtained
from the aerosols both as a function of size and composition. These results suggest that measurements of extinction spectra of ambient aerosols may also reveal unique characteristics related to size and composition over this wavelength range.
Polynomials were found to fit the measured spectra better than power laws due to 20
the curvature of the spectra. This result indicates that detailed spectral information as
provided by SpEx may offer greater insight into aerosol characteristics than can be
ob-tained from commercially available instruments that make measurements at only a few
wavelengths. The observed spectral curvature resulted in differences inαext
depend-ing on the wavelength pair used in calculations based on Eq. (2b), as well as that 25
obtained from a power law fit to the spectrum. In some cases the differences were
AMTD
8, 6469–6509, 2015Spectral Aerosol Extinction (SpEx)
C. E. Jordan et al.
Title Page
Abstract Introduction
Conclusions References
Tables Figures
◭ ◮
◭ ◮
Back Close
Full Screen / Esc
Printer-friendly Version Interactive Discussion
Discussion
P
a
per
|
Discussion
P
a
per
|
Discussion
P
a
per
|
Discussion
P
a
per
|
be acceptable, but large differences found for the BrC surrogate indicate extrapolation
cannot be applied to such materials. With its lower wavelength limit of 300 nm, SpEx can distinguish BrC from other aerosol types.
SpEx is similar in some respects to the broadband cavity-enhanced spectroscopy (BBCES) instrument (Washenfelder et al., 2013, 2015). BBCES has been used in the 5
laboratory to retrieve wavelength-dependent complex refractive indices (m(λ)) for
spe-cific aerosols (Washenfelder et al., 2013) and it has been used in the field to perform an optical closure study to assess the contribution of scattering to extinction, as well as the contribution of BC and BrC to aerosol absorption at 365 nm (Washenfelder et al., 2015). Further in the latter study they found in rural Alabama in summer that BrC 10
mass was principally associated with biomass burning; biogenic SOA contributed only
a minor fraction. BBCES uses two cavities with light emitting diode sources that offer
a combined spectral range of 355–420 nm (Washenfelder et al., 2015). The smaller cavities (each with an approximately 1.5 L volume) and slower flow rate makes BBCES
more suitable than SpEx for retrievals of m(λ) due to the need to size select aerosols to
15
perform the retrieval. Although we anticipate using SpEx in closure studies for specific wavelengths similar to that performed by Washenfelder et al. (2015), its real power lies in its ability to obtain detailed aerosol spectra over a wide spectral range.
When applied to ambient aerosol populations, it is anticipated that this spectral mea-surement capability will provide a novel tool for characterizing aerosols, enabling inves-20
tigations of their optical evolution in the ambient environment. SpEx is a rack mountable instrument that may be deployed in mobile laboratories allowing for studies of the opti-cal evolution of extinction as fresh emissions are transported downwind from sources.
Such measurements offer a complement to related in situ measurements of aerosol
chemical and physical properties. This instrument for measuring in situ aerosols also 25
offers a new measurement capability for calibration and validation studies of aerosol
retrievals from remote sensors.
AMTD
8, 6469–6509, 2015Spectral Aerosol Extinction (SpEx)
C. E. Jordan et al.
Title Page
Abstract Introduction
Conclusions References
Tables Figures
◭ ◮
◭ ◮
Back Close
Full Screen / Esc
Printer-friendly Version Interactive Discussion
Discussion
P
a
per
|
Discussion
P
a
per
|
Discussion
P
a
per
|
Discussion
P
a
per
|
emissions were reported that offer additional intriguing possibilities for the utility of the
spectral information that can be obtained with SpEx. By acquiring data on aerosol light extinction down to 300 nm in the ambient environment, SpEx may help inform our un-derstanding of how UV-absorbing aerosols influence the photochemical environment
for ambient gases (i.e., via their potential to reduce photolysis rates) and affect
bio-5
genic emissions of gases such as isoprene by altering the light environment. In their discussion of aerosol absorption Laskin et al. (2015) note that wavelength-resolved measurements are rare and are preferable to assumed power law wavelength depen-dencies. SpEx will help address the need for more wavelength-resolved measurements to examine the complex interactions in our ambient atmospheric-biogeochemical envi-10
ronment.
The Supplement related to this article is available online at doi:10.5194/amtd-8-6469-2015-supplement.
Acknowledgements. The authors thank Kevin Kaye, Tom Wisniewski, John Hair, John Pro-haska, Brian Heikes, Matt Brown, and James Hite for helpful comments and suggestions dur-15
ing this project. Dr. Jordan is particularly grateful to John Daniel for his encouragement and support of this work, funded by NOAA grant NA10OAR4590134.
References
Alfaro, S. C., Lafon, S., Rajot, L., Formenti, P., Gaudichet, A., and Maille, M.: Iron oxides and light absorption by pure desert dust: an experiment study, J. Geophys. Res., 109, D08208, 20
doi:10.1029/2003JD004374, 2004.
AMTD
8, 6469–6509, 2015Spectral Aerosol Extinction (SpEx)
C. E. Jordan et al.
Title Page
Abstract Introduction
Conclusions References
Tables Figures
◭ ◮
◭ ◮
Back Close
Full Screen / Esc
Printer-friendly Version Interactive Discussion
Discussion
P
a
per
|
Discussion
P
a
per
|
Discussion
P
a
per
|
Discussion
P
a
per
|
Andreae, M. O. and Gelencsér, A.: Black carbon or brown carbon? The nature of light-absorbing carbonaceous aerosols, Atmos. Chem. Phys., 6, 3131–3148, doi:10.5194/acp-6-3131-2006, 2006.
Ångström, A.: On the atmospheric transmission of sun radiation and on dust in the air, Geogr. Ann. A, 11, 156–166, 1929.
5
Apicella, B., Alfe, M., Barbella, R., Tegrossi, A., and Ciajolo, A.: Aromatic structures of car-bonaceous materials and soot inferred by spectroscopic analysis, Carbon, 42, 1583–1589, 2004.
Baumgardner, D., Popovicheva, O., Allan, J., Bernardoni, V., Cao, J., Cavalli, F., Cozic, J., Di-apouli, E., Eleftheriadis, K., Genberg, P. J., Gonzalez, C., Gysel, M., John, A., Kirchstet-10
ter, T. W., Kuhlbusch, T. A. J., Laborde, M., Lack, D., Müller, T., Niessner, R., Petzold, A., Piaz-zalunga, A., Putaud, J. P., Schwarz, J., Sheridan, P., Subramanian, R., Swietlicki, E., Valli, G., Vecchi, R., and Viana, M.: Soot reference materials for instrument calibration and intercom-parisons: a workshop summary with recommendations, Atmos. Meas. Tech., 5, 1869–1887, doi:10.5194/amt-5-1869-2012, 2012.
15
Beyersdorf, A. J., Timko, M. T., Ziemba, L. D., Bulzan, D., Corporan, E., Herndon, S. C., Howard, R., Miake-Lye, R., Thornhill, K. L., Winstead, E., Wey, C., Yu, Z., and Ander-son, B. E.: Reductions in aircraft particulate emissions due to the use of Fischer–Tropsch fuels, Atmos. Chem. Phys., 14, 11–23, doi:10.5194/acp-14-11-2014, 2014.
Bond, T. C. and Bergstrom, R. W.: Light absorption by carbonaceous particles: an investigative 20
review, Aerosol Sci. Tech., 40, 27–67, 2006.
Bond, T. C., Doherty, S. J., Fahey, D. W., Forster, P. M., Berntsen, T., DeAngelo, B. J., Flan-ner, M. G., Ghan, S., Kärcher, B., Koch, D., Kinne, S., Kondo, Y., Quinn, P. K., Sarofim, M. C., Schultz, M. G., Schulz, M., Venkataraman, C., Zhang, H., Zhang, S., Bellouin, N., Gut-tikunda, S. K., Hopke, P. K., Jacobson, M. Z., Kaiser, J. W., Klimont, Z., Lohmann, U., 25
Schwarz, J. P., Shindell, D., Storelvmo, T., Warren, S. G., and Zender, C. S.: Bounding the role of black carbon in the climate system: a scientific assessment, J. Geophys. Res.-Atmos., 118, 5380–5552, doi:10.1002/jgrd.50171, 2013.
Bones, D. L., Henricksen, D. K., Mang, S. A., Gonsior, M., Bateman, A. P., Nguyen, T. B., Cooper, W. J., and Nizkorodov, S. A.: Appearance of strong absorbers and fluorophores in 30
limonene-O3secondary organic aerosol due to NH+4-mediated chemical aging, J. Geophys.
AMTD
8, 6469–6509, 2015Spectral Aerosol Extinction (SpEx)
C. E. Jordan et al.
Title Page
Abstract Introduction
Conclusions References
Tables Figures
◭ ◮
◭ ◮
Back Close
Full Screen / Esc
Printer-friendly Version Interactive Discussion
Discussion
P
a
per
|
Discussion
P
a
per
|
Discussion
P
a
per
|
Discussion
P
a
per
|
Chartier, R. T. and Greenslade, M. E.: Initial investigation of the wavelength dependence of
optical properties measured with a new multi-pass Aerosol Extinction Differential Optical
Absorption Spectrometer (AE-DOAS), Atmos. Meas. Tech., 5, 709–721, doi:10.5194/amt-5-709-2012, 2012.
Chen, Y. and Bond, T. C.: Light absorption by organic carbon from wood combustion, Atmos. 5
Chem. Phys., 10, 1773–1787, doi:10.5194/acp-10-1773-2010, 2010.
Desyaterik, Y., Sun, Y., Shen, X., Lee, T., Wang, X., Wang, T., and Collett Jr., J. L.: Speciation of “brown” carbon in cloud water impacted by agricultural biomass burning in eastern China, J. Geophys. Res.-Atmos., 118, 7389–7399, doi:10.1002/jgrd.50561, 2013. (FOUND!)
Eck, T. F., Holben, B. N., Reid, J. S., Dubovik, O., Smirnov, A., O’Neill, N. T., Slutsker, I., 10
and Kinne, S.: Wavelength dependence of the optical depth of biomass burning, urban, and desert dust aerosols, J. Geophys. Res., 104, 31333–31349, 1999.
Gysel, M., Laborde, M., Olfert, J. S., Subramanian, R., and Gröhn, A. J.: Effective density
of Aquadag and fullerene soot black carbon reference materials used for SP2 calibration, Atmos. Meas. Tech., 4, 2851–2858, doi:10.5194/amt-4-2851-2011, 2011.
15
Hecobian, A., Zhang, X., Zheng, M., Frank, N., Edgerton, E. S., and Weber, R. J.: Water-Soluble Organic Aerosol material and the light-absorption characteristics of aqueous ex-tracts measured over the Southeastern United States, Atmos. Chem. Phys., 10, 5965–5977, doi:10.5194/acp-10-5965-2010, 2010.
IPCC: Climate Change 2007: The Physical Science Basis. Contribution of Working Group I to 20
the Fourth Assessment Report of the Intergovernmental Panel on Climate Change, edited by: Solomon, S., Qin, D., Manning, M., Chen, Z., Marquis, M., Averyt, K. B., Tignor, M., and Miller, H. L., Cambridge University Press, Cambridge, UK and New York, US, 27–30, 2007. IPCC: Climate Change 2014: Synthesis Report, edited by: The Core Writing Team,
Pachauri, R. K., Meyer, L., available on-line in unedited form at: http://www.ipcc.ch/report/ 25
ar5/syr/, p. 43, 2014.
Jacobson, M. Z.: Isolating nitrated and aromatic aerosols and nitrated aromatic gases as sources of ultraviolet light absorption, J. Geophys. Res., 104, 3527–3542, 1999.
Jaoui, M., Edney, E. O., Kleindienst, T. E., Lewandowski, M., Offenberg, J. H., Surratt, J. D., and
Seinfeld, J. H.: Formation of secondary organic aerosol from irradiatedα-pinene/toluene/NOx
30
mixtures and the effect of isoprene and sulfur dioxide, J. Geophys. Res., 113, D09303,