www.adv-geosci.net/26/77/2010/ doi:10.5194/adgeo-26-77-2010
© Author(s) 2010. CC Attribution 3.0 License.
Geosciences
The use of products from ground-based GNSS observations in
meteorological nowcasting
E. Terradellas and B. T´ellez
Agencia Estatal de Meteorolog´ıa, Barcelona, Spain
Received: 17 February 2010 – Revised: 18 March 2010 – Accepted: 19 April 2010 – Published: 22 July 2010
Abstract. Convective rainfall is often focalized in areas of moisture convergence. A close relationship between pre-cipitation and fast variations of vertically-integrated water vapour (IWV) has been found in numerous cases. There-fore, continuous monitoring of atmospheric humidity and its spatial distribution is crucial to the operational forecaster for a proper nowcasting of heavy rainfall events.
The microwave signals continuously broadcasted by the Global Navigation Satellite Systems (GNSS) satellites are influenced by the water vapour as they travel through the at-mosphere. Estimates of IWV retrieved from ground-based GNSS observations may, then, constitute a source of infor-mation on the horizontal distribution and the time evolution of atmospheric humidity. At the Spanish Meteorological Agency (AEMET), a near-real-time map of IWV estimates retrieved from ground GNSS measurements in the Iberian Peninsula and West Mediterranean region is operationally built and presented to the forecaster. The maps are generated every 15 minutes following a one-dimensional variational as-similation scheme with the previous map as the background state.
A case study is presented in order to illustrate some strengths and weaknesses of the product, to assess the po-tential benefit of using GNSS products in nowcasting and to define the steps to be done in order to make use of the full potential of the method.
Correspondence to:E. Terradellas ([email protected])
1 Introduction
In spite of being a minor component of the Earth’s sphere, water plays a fundamental role in a variety of atmo-spheric processes of a wide range of scales. Information on the spatial distribution and time variations of water vapour concentration is of crucial importance to weather forecasting and climate monitoring and research. Nevertheless, humid-ity is one of the most poorly characterized meteorological parameters. Radiosonde releases yield measurements of at-mospheric humidity (among other parameters), but they are very sparse and present a limited time resolution of 12 to 24 h. Surface-based radiometers are capable of measuring the column-integrated water vapour (IWV) with a high tem-poral resolution, but they are costly, require frequent calibra-tion and reliability is affected by the weather condicalibra-tions, es-pecially by rain (Rocken et al., 1995). Several polar-orbiting satellites carry multichannel radiometers designed for hu-midity sensing with planetary-scale coverage. Nevertheless, infrared sensors present a limited performance in cloudy gions and retrievals from microwave sensors are not very re-liable over land (Melsheimer and Heygster, 2008).
78 E. Terradellas and B. T´ellez: Products from ground-based GNSS observations been assessed through comparison with radiosonde and
ra-diometer observations (e.g. Revercomb et al., 2003; Van Bae-len et al., 2005). Recently, GNSS data have been compared with high-resolution measurements of a Fourier-Transform Infrared Spectrometer (Schneider et al., 2010), an instrument that yields data with a theoretical precision of a few percent, concluding that for IWV over 3.5 kg m−2, GNSS retrievals
present a similar quality than radiosonde or radiometer ob-servations.
Short and medium-range numerical weather prediction (NWP) models suffer from inadequate observational defini-tion of the three-dimensional moisture field. Ground-based GNSS observations can provide a vertically-integrated value of that field with a good time resolution in all weather condi-tions, including those with clouds and precipitation, when a good representation of the moisture field is especially impor-tant. The zenith total delay (ZTD) is usually the magnitude that is assimilated. Many authors have reported that the as-similation of GNSS observations has a positive impact on the performance of a NWP model (Smith et al., 2007; Poli et al., 2007).
Mazany et al. (2002) and De Haan et al. (2004) can be mentioned among the attempts to use GNSS observations, in combination with other meteorological data, in the nowcast-ing of precipitation or storm events.
In this paper, we first present a method based on vari-ational assimilation techniques to produce near-real-time maps describing the spatial distribution of IWV. These maps are generated every 15 min using the previous map as the background state. They cover the Iberian Peninsula and the Western Mediterranean region. Finally, the usefulness of the product is assessed in a case of storm activity.
2 Generation of IWV maps
The distribution of the atmospheric water is highly variable in the vertical dimension. Since the source is essentially the surface and the principal sink is the precipitation, commonly originated hundreds to thousands of meters above ground, there is an upward decrease of water concentration. The fact is that, on average, nearly half of the total atmospheric wa-ter is between sea level and a 1.5-km height and, therefore, the horizontal distribution of water vapour is strongly modu-lated by the topography. In the Iberian Peninsula, an area of complex orography, the penetration of shallow air masses of maritime origin through passes underneath mountain ranges is a common mechanism of moistening the air of inland re-gions. This fact makes difficult to build a realistic map of IWV without a high-resolution network of GNSS receivers.
The dependence on height of the parameter to be interpo-lated is reduced through the introduction of a climatological scaling, which is defined as the division of any IWV value by a local statistical average. The full process of interpolation is performed using the scaled values and the final product is
generated after reversing the scaling process. This method requires the previous calculation of IWV averages.
The interpolation process is performed every 15 min, the current temporal resolution of the IWV estimates issued by the Spanish Instituto Geogr´afico Nacional, the French Insti-tute G´eographique National and the Agenzia Spaziale Ital-iana, the centres that process the GNSS data from the Iberian Peninsula and Western Mediterranean region, our working area. The interpolation is made through a one-dimensional variational assimilation scheme with the previous map as the background state. A similar method, although without scaling the IWV, has been recently presented in De Haan et al. (2009).
2.1 Generation of climatological maps
The mean geographical distribution of IWV is computed from the dataset of daily averages at the different stations. Since this dataset usually presents some gaps, the estimation of the mean values and covariance matrix is performed to-gether with the imputation of the missing values using the iterative method based on the maximization-expectation al-gorithm described in Schneider (2001).
The average values of IWV calculated at the different re-ceiving stations are, then, mapped using a combination of statistic methods and geostatistical techniques of interpola-tion, following Tellez et al. (2008). First, a multiple regres-sion analysis yields a model accounting for the statistical de-pendence of the mean values on latitude, longitude and al-titude. Then, the residuals, that is, the difference between those averaged values and the prediction of the linear model, are spatially interpolated using an ordinary kriging. The fi-nal result is the addition of the map drawn from the model predictions and the map of residuals.
2.2 The variational assimilation of IWV values
The analysis of the climatologically scaled IWV values is performed by means of a one-dimensional variational assim-ilation scheme, that is, through the minimisation of the fol-lowing cost function:
J (x)=1
2(x−xb)
T
B−1(x−xb)
+1
2(yo−H (x))
T
R−1(yo−H (x)) (1)
whereB andR represent background error and the sum of observation and representativeness error covariances, respec-tively,xrepresents the array of scaled IWV values at a grid mesh of a 0.2×0.2 degree resolution,xbis the array of
back-ground values,yoare observations andH (x)is the
observa-tion operator.
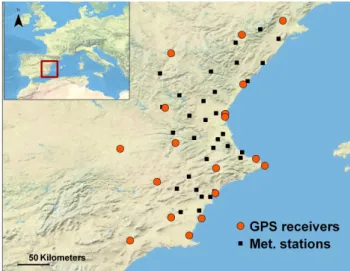
Fig. 1.GNSS receivers and meteorological stations at Val`encia re-gion.
successive IWV values for every pair of stations. The val-ues for every station are then fit to a 2-D-Gaussian and, fi-nally, the parameters of the Gaussian surface are interpolated to the grid points. On the other hand, as stated by De Haan et al. (2009), observation errors are correlated as a result of the method used to process the GNSS observations. However, as in the mentioned paper, we assume that these correlations can be neglected. The observation operator maps the state space (x) to the observations using a Gaussian-weighted average of the nearest points. Finally, the minimisation of the cost func-tion is performed through the conjugate gradient method with the Polak-Ribi`ere algorithm (Polak and Ribi`ere, 1969).
3 A case study: Val`encia, 7–8 July 2009
Val`encia region is situated in the mid-Mediterranean front of the Iberian Peninsula (see Fig. 1). It is surrounded to the west by mountain ranges that facilitate the uplift of maritime air and cause not infrequent events of heavy convective rain.
After the passage of a weak cold front throughout the northern part of the Iberian Peninsula, the synoptic situation during the night of 7 July 2009 is dominated by an Atlantic anticyclone and low pressure over the Mediterranean, lead-ing a warm and wet eastern flow to the Val`encia region. A trough approaches the Peninsula from the west progressively increasing the column instability. Convective rain and storms are expected, but it is not possible to precisely forecast time and location of occurrence. On 8 July at 01:20 UTC, heavy rain and storm activity start in Val`encia city. Convection rapidly moves eastwards, to the sea, but 33.9 mm of precipi-tation is recorded in the city weather sprecipi-tation, with a peak 10-minute intensity of 57.0 mm h−1. Other showers are later
ob-served in the rest of the region, but they produce very scarce precipitation (Figs. 2 and 3).
Fig. 2. Rainfall (mm) recorded between 00:00 and 06:00 UTC on 8 July 2009. Black boxes indicate the location of meteorological stations.
In the evening of 7 July, scattered Stratocumuli are ob-served everywhere in the region. Stratiform clouds are spot-ted in visible – until sunset – and infrared satellite channels, and reported in manual observations. Nevertheless, there is not any sign of convection in the satellite imagery. The de-velopment of a convective cell is not evident until well after midnight, only about half an hour before rain and storm hit the city. Figure 4 shows the first signs of convection on 8 July at 00:45 UTC and Fig. 5 the mature cell moving eastwards at 01:45 UTC. Both figures present the spatial distribution of IWV at their upper-left corner.
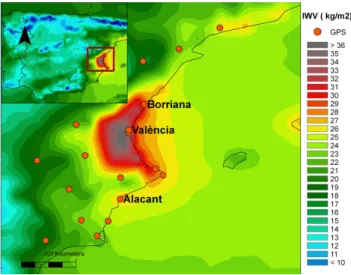
At 18:45 UTC 7 July, estimates of IWV in Val`encia city are 2–4 kg m−2 above those in other coastline stations
(Fig. 6). From that time, there is a very fast increase of IWV, about 7 kg m−2in 6 h (Fig. 3a), while the rise is only
5 kg m−2in Borriana, 52 km north-northeastwards (Fig. 3b)
and a nearly negligible 1 kg m−2in Alacant, 127 km
south-southwestwards (Fig. 3c). It results in a progressive growing of the peak around the city. On 8 July at 00:45 UTC, when the first convective clouds can be distinguished in the satel-lite images, the IWV in Val`encia city is 10 kg m−2 higher
than in the surroundings (Fig. 7). Several minutes later, there is heavy rain and storm activity over the city. The release of precipitation and the displacement of the main convective area produce a rapid decay in the IWV values. In this case, the GNSS product allows early identification of an area with a fast increase of IWV, that is, an area of moisture conver-gence, where convection can be triggered in a situation of conditional instability.
80 E. Terradellas and B. T´ellez: Products from ground-based GNSS observations
Fig. 3.Rainfall (in black) and integrated water vapour (in red) ob-served from 12:00 UTC 7 July 2009 to 12:00 UTC 8 July 2009 in Val`encia(a), Borriana / Castell´o(b)and Alacant(c).
Nevertheless, it is necessary to point out the existence of false-alarm cases, where either the moisture convergence is too weak or the stratification is too stable to allow storm de-velopment. In addition, the period of IWV increase prior to the convection usually ranges between tens of minutes and several hours and, thus, it is not always longer than the cur-rent latency of the product. Finally, IWV maps seem to be of less interest once the convection is developed and other
Fig. 4. METEOSAT image (channel 9, centred at 10.8 µm) and spatial distribution of integrated water vapour (upper-left corner) for 8 July 2009 at 00:45 UTC.
Fig. 5. METEOSAT image (channel 9, centred at 10.8 µm) and spatial distribution of integrated water vapour (upper-left corner) for 8 July 2009 at 01:45 UTC.
remote-sensing techniques yield more useful information to nowcasting.
4 Conclusions and future work
Fig. 6.Estimation of integrated water vapour (kg m−2)on 7 July at
18:45 UTC. Red circles indicate the location of GNSS receivers.
Fig. 7.Estimation of integrated water vapour (kg m−2)on 8 July at 00:45 UTC.
This paper describes the production of maps presenting the geographical distribution of IWV in the western part of the Mediterranean basin. This product constitutes a promis-ing tool for the operational forecaster. It displays areas with strong moisture convergence and, therefore, potential con-vection triggering, causing alarm bells to ring long before any sign appears in other remote sensing systems.
The use of GNSS measurements in meteorology requires a relatively complex data process. At present, most IWV es-timates are available between 45 and 90 min after its nominal time. This latency can be acceptable for NWP, but is exces-sive for nowcasting applications. A shorter latency should arrive together with a harmonisation of the processing meth-ods. The application of different methods to estimate IWV from GNSS observations entails different spatial and time
correlations among data that not always can be taken into ac-count in the assimilation process.
The meteorological application of GNSS observations quires a very precise calculation of the distance between re-ceiver and satellites. The background motion makes it unfea-sible over the sea. It would force to complement GNSS with other data sources (i.e. retrievals from satellite imagery). Acknowledgements. The authors thank the GPS data providers, especially those in the EUREF Permanent Network (EPN), for giv-ing access to their data and products. They also thank the Spanish Instituto Geogr´afico Nacional, the French Institut G´eographique National and the Agenzia Spaziale Italiana, which carry with the data processing in the area of interest.
Edited by: A. Mugnai
Reviewed by: one anonymous referee
References
Bevis, M., Businger, S., Herring, T. A., Rocken, C., Anthes, R. A., and Ware, R. H.: G.P.S. meteorology: remote sensing of at-mospheric water vapour using the Global Positioning System, J. Geophys. Res., 97, 15787–15801, 1992.
Bevis, M., Businger, S., Chiswell, S., Herirng, T. A., Anthes, R. A., Rockmen, C., and Ware, R. H.: GPS meteorology: Mapping zenith wet delays onto perceptible water, J. Appl. Meteor., 33, 379–386, 1994.
Brunner, F. K. and Gu, M.: An improved model for the dual fre-quency ionospheric correction of GPS observations, Manusc. Geod., 16, 205–214, 1991.
De Haan S., Barlag, S. J. M., Baltink, H. K., and Debie, F.: Syner-getic use of GPS water vapor and Meteosat images for synoptic weather forecasting, J. Appl. Meteor., 43, 514–518, 2004. De Haan, S., Holleman, I., and Holtslag, A. A. M.: Real-time water
vapor maps from a GPS surface network: construction, valida-tion and applicavalida-tions, J. Appl. Meteor. Climatol., 48, 1302–1316, 2009.
Mazany R. A., Businger, S., Gutman, S. I., and Roeder, W.: A light-ning prediction index that utilizes GPS integrated precipitable water vapor, Weather Forecast., 17, 1034–1047, 2002.
Melsheimer, C., and Heygster, G.: Improved retrieval of total water vapor over polar regions from AMSU-B microwave radiometer data, IEEE Trans. Geosci. Remote Sens. 46, 2307-2322, 2008. Polak, E. and Ribi`ere, G.: Note sur la convergence de directions
conjug´ees, Rev. Fr. Inform. Rech. Oper., 16, 35–43, 1969. Poli, P., Moll, P., Rabier, F., Desroziers, G., Chapnik, B., Berre,
L., Healy, S. B., Andersson, E., and El Guelai, F.-Z.: Forecast impact studies of zenith total delay data from European near real-time GPS stations in M´et´eo France 4DVAR, J. Geophys. Res., 112, D06114, doi:10.1029/2006JD007430, 2007.
82 E. Terradellas and B. T´ellez: Products from ground-based GNSS observations
Rocken, C., Van Hove, T., Johnson, J., Solheim, F., Ware, R. H., Bevis, M., Businger, S., and Chiswell, S.: GPS/STORM – GPS Sensing of Atmospheric Water Vapor for Meteorology, J. Atmos. Ocean. Tech., 12, 468–478, 1995.
Schneider, T.: Analysis of incomplete climate data: Estimation of mean values and covariance matrices and imputation of missing values, J. Climate, 14, 853–871, 2001.
Schneider, M., Romero, P. M., Hase, F., Blumenstock, T., Cuevas, E., and Ramos, R.: Continuous quality assessment of atmo-spheric water vapour measurement techniques: FTIR, Cimel, MFRSR, GPS, and Vaisala RS92, Atmos. Meas. Tech., 3, 323– 338, doi:10.5194/amt-3-323-2010, 2010.
Smith, T. L., Gutman, S. I., and Sahm, S. R.; Forecast impact from assimilation of GPS IPW observations into the Rapid Update Cy-cle, Mon. Weather Rev., 135, 2914–2930, 2007.
Spilker, J. J.: GPS signal structure and performance characteristics, Global Positioning System, vol. 1, The Institute of Navigation, Washington, DC, 1980.
T´ellez, B., Cernocky, T., and Terradellas, E.: Calculation of cli-matic reference values and its use for autocli-matic outlier detection in meteorological datasets, Adv. Sci. Res., 2, 1–4, 2008. Van Baelen, J., Aubagnac, J.-P., and Dabas, A.: Comparison of