Limitations to photosynthesis at different temperatures
in the leaves of
Citrus limon
Carlos Pimentel
1*, Carl Bernacchi
2,3and Steve Long
31Departamento de Fitotecnia, Universidade Federal Rural do Rio de Janeiro, Seropédica, 23851-970 Brazil. 2Center for
Atmospheric Sciences, Illinois State Water Survey, Champaign, IL, USA. 3Department of Plant Biology, University of Illinois,
Urbana, IL 61801, USA. *Corresponding author: greenman@amcham.com.br
Received: 14 May 2007; Returned for revision: 02 July 2007; Accepted: 06 August 2007
The response of CO2 assimilation rate (A) to the intercellular partial pressure of CO2 (Ci) was measured on intact lemon leaves over a range of temperatures (10 to 40ºC). The A/Ci response shows how change in the leaf temperature alters the activity of ribulose-1,5-bisphosphate (RuBP) carboxylase-oxygenase (Rubisco) and RuBP regeneration via electron transport. The rate of A reached a maximum of 7.9 to 8.9 µmol m-2 s-1 between 25 and 30ºC, while dark respiration (R
d)
increased with temperature from 0.4 µmol m-2 s-1 at 10ºC to 1.4 µmol m-2 s-1 at 40ºC. The maximum rates of carboxylation
(Vc,max) and the maximum rates of electron transport (Jmax) both increased over this temperature range from 7.5 to 142
µmol m-2 s-1 and from 23.5 to 152 µmol m-2 s-1, respectively. These temperature responses showed that A can be limited by
either process depending on the leaf temperature, when Ci or stomatal conductance are not limiting. The decrease in A
associated with higher temperatures is in part a response to the greater increase in the rate of oxygenation of RuBP compared with carboxylation and Rd at higher temperatures. Although A can in theory be limited at higher Ci by the rate of triose-phosphate utilization, this limitation was not evident in lemon leaves.
Key words: A/Ci curves, gas exchange, lemon
Análise in vivo das limitações da fotossíntese, sob diferentes temperaturas, em folhas de Citrus limon: A resposta da
taxa de assimilação de CO2 (A) à pressão parcial de CO2 (C
i) foi medida em folhas intactas de limão cravo, numa ampla
faixa de temperaturas (10 to 40ºC). A variação na curva A/C
i mostrou como as mudanças na temperatura foliar alteram a
atividade da ribulose-1,5-bisfosfato (RuBP) carboxilase-oxigenase (Rubisco) e a regeneração da RuBP, via transporte de elétrons. O valor máximo de A obtido foi de 7.9 a 8.9 µmol m-2 s-1,entre 25 e 30ºC, enquanto a respiração mitocondrial (R
d)
aumentou com a temperatura, de 0.4 µmol m-2 s-1 a 10ºC até 1.4 µmol m-2 s-1, a 40ºC. A taxa máxima de carboxilação (V c,max)
e a taxa máxima de transporte de elétrons (J
max) aumentaram naquela faixa de temperatura, de 7.5 a 142 µmol m
-2 s-1, e de
23.5 a 152 µmol m-2 s-1, respectivamente. A redução em A associada às altas temperaturas é, em parte, uma resposta ao
maior aumento na taxa de oxigenação da RuBP, comparada à taxa de carboxilação, e de R
d sob altas temperaturas. Apesar
de A poder ser, em teoria, limitada sob elevada C
i pela taxa de utilização de triose-fosfato, essa limitação não foi evidente
nas folhas analisadas.
Palavras-chave: curvas A/C
i, limão cravo, trocas gasosas
INTRODUCTION
Temperature is one of the most variable environmental factors, which can suppress photosynthesis both at high and low values. Under global warming scenarios, the study of temperature effects on photosynthesis is
difficult. Therefore, it has become a common practice to calculate the CO2 partial pressure in substomatal cavities (intercellular CO2 partial pressure, C
i), based on
measurements of gas exchange under different ambient CO2 partial pressures (von Caemmerer, 2000; Long and Bernacchi, 2003). The response of A to C
i under different
temperatures can be interpreted in terms of the biochemical processes controlling the response of A
(Sage, 1994).
The group of evergreen fruit trees includes numerous horticulturally and economically important crops, as
Citrus spp., which are cultivated throughout most tropical and subtropical areas of the world. Although citrus tree thrive in hot, dry environments, leaf photosynthesis has a relatively low temperature optimum of 25oC to 30oC (Goldschimidt and Koch, 1996). The term
evergreen relates to the nondeciduous nature of leaves and, as such, has immediate consequences for leaf longevity and photosynthesis. Broadleaf evergreen citrus leaves are relatively thick with a small proportion of leaf volume occupied by intercellular air space. They have a shiny waxy cuticle particularly on the adaxial surface and stomata are located almost exclusively on the abaxial surface (Goldschimidt and Koch, 1996). Therefore, citrus leaves have low rates of A (4 to 8 µmol CO2 m-2 s-1
seem realistic under optimal conditions), and low stomatal and mesophyll conductances (Lloyd et al., 1992). In addition, its leaves act as a carbohydrate storage organ with slow rates of assimilates export, which in turn can feedback to reduce A (Syvertsen and Lloyd, 1994). Wullschleger (1993) made a retrospective analysis of the A/Ci curves of 109 C3 species and concluded that the maximum rate of carboxylation (Vc,max) and the light-saturated rate of electron transport (Jmax) were in general higher for herbaceous annuals plants than for woody perennials. Therefore, the aim of this study was to characterize the A/Ci response and the in vivo calculated photosynthetic parameters in Citrus limon, an evergreen plant with low A values even for a C3 plant, estimated from the A/Ci response curves over a range of temperature.
MATERIAL AND METHODS
Three individuals of Citrus limon L. were germinated and grown in environmentally-controlled greenhouses located at the University of Illinois, Urbana, USA. Plants
were grown in a soil-less growth medium (Sunshine Mix #1, SunGro Horticulture, Bellevue, USA) and were watered regularly. Nutrient additions were given weekly in the form of 300 µL L-1 of NPK 15:5:15 (Peters Excel, The
Scotts Co., Marysville, USA) to pot saturation. Greenhouse temperature levels were set at 25°C for the 16-h photoperiod and 18oC for night.
Leaf gas exchange rates were measured using an open gas exchange system with independent [CO2] control using a 6 cm2 clamp-on leaf cuvette (LI 6400, LI-COR,
Lincoln, USA). The gas-exchange system was zeroed daily using CO2-free air, and leakage of CO2 into and out of the chamber, with a Citrus leaf inside, was determined for the range of CO2 concentrations used in this study and used to correct measured leaf fluxes. The chamber was modified by replacing the peltier external heat sink with a metal block containing water channels, which in turn were connected to a heating/cooling circulating water bath (Endocal RTE-100, Neslab Instruments, Newington, USA). The modified heating/cooling blocks, used in conjunction with the peltier temperature controls, provided leaf temperature control at any preset value between 10-40°C. Leaf temperature was measured using a chromal-constantin thermocouple pressed to the lower leaf surface. The temperatures reported by this particular thermocouple were cross-checked against standard mercury-in-glass thermometers in a controlled temperature chamber and found to be within ±0.4°C
(Bernacchi et al., 2003).
Photosynthesis was measured after acclimation of the leaf to temperature (until A was steady-stated and total CV was lower than 0.3, at least after 2 h at each new temperature) at photosynthetic photon flux density (PPFD) between 600 and 800 µmol m-2 s-1, which was
protocol commonly used in determining this A versus Ci
response is: firstly, induce photosynthesis at the growth CO2 concentration (36 to 380 µmol mol-1) and saturating
PPFD (between 600 and 800 µmol m-2 s-1) until A is
steady-stated (over a 5-min period). Values of A and Ci are recorded and then ambient CO2 partial pressure (Ca) is decreased to 300, 250, 200, 150, 100 and 50 µmol mol-1.
Upon completion of this sequence, Ca is returned to growth CO2 concentration to check that the original A can be restored and then is increased stepwise to 450, 550, 650, 800, 1000 µmol mol-1. Steady-state photosynthesis
needs to be obtained at each step (with a total CV lower than 0.3, at least after 5 min for each step).
Three replicate measurements of A/Ci curves (Figure 1: A/Ci curve at 25°C) were measured on different plants, at 5°C intervals between 10 and 40°C. The parameters
Vc,max, Jmax and Rd were estimated using regression analysis of the curves (Figure 2) based on the equations presented in the appendix (Long and Bernacchi, 2003). The temperature responses of Vc,max, Jmax, and Rd were plotted from the results of the regression analysis at each measurement temperature from 10 to 40°C (e.g., Bernacchi et al., 2001). Data for photosynthesis measured at a CO2 concentration of 370 µmol mol-1 was extracted from the
curves and plotted as a function of temperature. Using the equations presented by Farquhar et al. (1980), based on A/Ci measurements (Figure 1) and thus the calculated response of Vc,max (Figure 2) at the complete range of temperatures, estimations of the temperature response of photosynthesis under non-RuBP limiting conditions was also determined.
Data were subjected to analysis of variance (ANOVA) for temperature effects and means were compared by Student-Newman-Keuls test at 0.05 of probability, when significance was detected.
RESULTS AND DISCUSSION
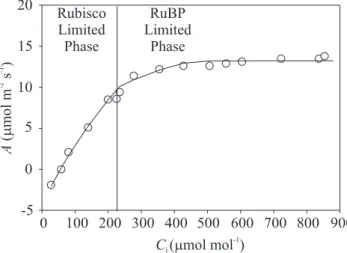
Under light saturating conditions photosynthesis for C3 plants is limited by Rubisco capacity, the Rubisco limited phase, as shown in Figure 1. As Ci increases above typical levels for this specie, photosynthesis will typically become limited by RuBP regeneration via electron transport, the RuBP limited phase, and by triose-phosphate utilization (TPU) at substantially higher Ci, the TPU limited phase (Sage, 1994; von Caemmerer, 2000).
This last limitation, however, was not observed in this experiment with lemon (Figure 1), as is frequent in field-based measurements (Adams et al., 2000). During the electron transport limitation, the RuBP limited phase, CO2 uptake still increases because CO2 out-competes O2 for the available RuBP, but during the triose limitation photosynthesis is no more CO2 dependent (von Caemmerer, 2000).
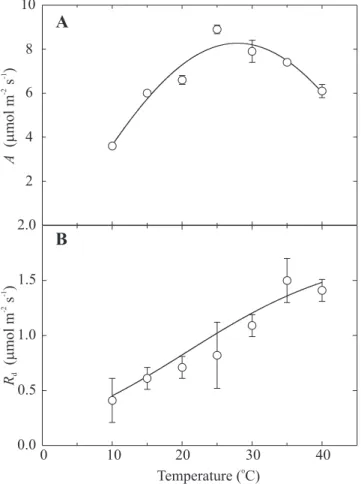
The results obtained with lemon under temperatures from 10°C to 40°C showed a maximum values of A between 25 and 30°C, with 8.9 and 7.9 µmol m-2 s-1, respectively,
while R
d increased significantly with temperature from 0.4
to 1.5-1.4 µmol m-2 s-1 (obtained as in Figure 2). The range
of temperature for maximal A measured (Figure 3A) is in agreement with Golschmidt and Koch (1996), who stated that the genus Citrus, which originated in tropical and semitropical regions, have an optimal temperature between 25°C to 30°C. The highest value of A (8.9 µmol m-2 s-1; Figure 3A) was obtained at 25°C and A decreased
both above and below this temperature. This is in contrast to R
d, which rose with temperature (Figure 3B).
The low value of A for the perennial woody Citrus spp.
when compared to annual herbaceous plants (Wullschleger, 1993), but also to other perennials fruit crops as Prunus persica, might be attributed to a lower mesophyll conductance (gm) or/and low leaf nitrogen present as Rubisco (Lloyd et al., 1992), which can in turn reduce V
c,max (Long, 1991).
Figure 1. The A/Ci response of Citrus limon at 25°C. The actual rates of photosynthesis that would be achieved depending on whether Rubisco or RuBP are limiting (in this study triose-phosphate utilization was not limiting).
0 100 200 300 400 500 600 700 800 900 -5
0 5 10 15 20
Rubisco Limited Phase
RuBP Limited
Phase
Rubisco Limited Phase
RuBP Limited
Phase
Ci( mol mol )m -1
A
(
mol
m
s
)
m
-2
Potentially 50 to 70% of carbon assimilated in plant biomass is released back to the atmosphere as CO2 during subsequent plant respiration (Baldocchi and Amthor, 2001). The response of A to temperature is parabolic and its decrease at high temperature occurs through numerous potential processes, including increases in Rd, decrease in membrane stability, decrease in the specificity factor of Rubisco and an accumulation of carbohydrates (Baldocchi and Amthor, 2001). In addition, the limitation of A imposed by an increase in gm with temperature suggests that the dominant process(es) determining gm is not physical, but probably protein-mediated, possibly involving a carbonic anhydrase or aquaporins (Bernacchi et al., 2002; Long and Bernacchi, 2003).
Under non-limiting environmental conditions, in vitro
Rubisco activity (Vc,max) for the activated enzyme extracted from citrus leaves is generally in the range of 300 to 400 µmol CO2 mg chlorophyll-1 h-1 (Vu and
Yelenovsky, 1988). These authors equate a V
c,max value of
about 75 µmol CO2 mg chlorophyll -1 h-1 for leaves of
“Valencia” orange (Citrus sinensis [L.] Osbeck) having a maximum A of 8 mmol CO2 m-2 s-1. On the other hand, from
an A/Ci plot, Syvertsen and Lloyd (1994) obtained a value
for Vc,max varying from 75 to 106 µmol m-2 s-1, and a value
for Jmax varying from 130 to 140 µmol m-2 for “Marsh” and
“Ruby Red” grapefruit at 25°C, respectively. The in vivo
values of Vc,max and Jmax for C. limon at 25°C were 55 µmol m-2 s-1 and 87 µmol m-2 s-1 (Figure 4A,B), respectively.
These values of Vc,max and Jmax at 25°C are close to the mean values obtained by Wullschleger (1993) for perennials species, i.e. 44 and 97 µmol CO2 m-2 s-1,
respectively, whereas the mean values of these parameters for herbaceous annuals plants are 75 and 154
µmol CO2 m-2 s-1, respectively.
In this study with lemon, the in vivo values of Vc,max
and Jmax increased significantly with temperature from 7.5 to 142 µmol m-2 s-1 (Figure 4A) and from 23.5 to 152 µmol
m-2 s-1 (Figure 4B), respectively. In addition, the increase
in Vc,max with temperature is greater than Vo,max (Figure 4A,C), and V
o,max values varied from 2.4 to 35.7 µmol m -2 s-1
Figure 2. The adjusted CO2 assimilation rate (A’) plotted as a linear function of f´ (which is a function of C
i in the
Rubisco limited part of the A/C
i response curve; closed
circles) and g’ (which is a function of C
i in the RuBP limited
part of the A/C
i response curve; open circles) of Citrus
limon at 25°C. V
c,max is obtained by the slope and Rd is the
intercept of the A x f’ linear function, while R
d values is
used to solve for J
max in the A x g’ linear function, as
stated by Long and Bernacchi (2003). n = 3 ± SD.
Figure 3. Temperature response of (A) CO2 assimilation rate (A) and (B) dark respiration (R
d), determined from gas
exchange measurements on Citrus limon. n = 3 ± SD.
A’
(
mol
m
s
)
m
-2
-1
-0.05 0.00 0.05 0.10 0.15 0.20 0.25 -5
0 5 10 15 20
y=80.90x-0.6827
y=50.98x-0.6827
f’
A
(
mol
m
s
)
m
-2
-1
2 4 6 8 10
Temperature ( C)o
0 10 20 30 40
0.0 0.5 1.0 1.5 2.0
A
B
Rd
(
mol
m
s
)
m
-2
REFERENCES
Adam NR, Wall GW, Kimball BA, Pinter, Jr. PJ, LaMorte RL, Hunsaker DJ, Adamsen FJ, Thompson T, Matthias AD, Leavitt SW, Weber AN (2000) Acclimation
response of spring wheat in a free-air CO2 enrichment
(FACE) atmosphere with variable soil nitrogen regimes. 1. Leaf position and phenology determine acclimation response. Photosynth. Res. 66:65-77. Baldocchi DD, Amthor JS (2001) Canopy photosynthesis:
history, measurements and models. In: Roy J, Saugier B, Mooney HA (eds), Terrestrial Global Productivity. pp.9-31. Academic Press, San Diego.
Bernacchi CJ, Singsaas EL, Pimentel C, Portis AR, Long SP (2001) Improved temperature response functions for models of Rubisco-limited photosynthesis. Plant Cell Environ. 24:253-259.
(Figure 4C). From our measurements, we found that V
o,max
/V
c,max declines with temperature. However, due to the
differential effect of temperature on the velocity of carboxylation relative to oxygenation (Vc /Vo), observed A
values will actually decline with increasing temperatures due to increased photorespiration (Long et al., 2004). Therefore, the ratio of Vo,max/Vc,max is reduced (Figure 4D) at high temperature and there is a greater increases in
Vc,max compared to Vo,max, as stated by Bernacchi et al. (2001) and, thus, the proportion of potential carbon uptake lost to photorespiration increases (Long, 1991).
Therefore, depending on temperature A can be limited by very different processes. The amount and activation state of the photosynthetic enzymes, each representing a different limiting process to overall CO2 assimilation, are integral for determining the temperature optimum of photosynthesis.
Figure 4. Temperature response of four parameters describing photosynthesis on Citrus limon: (A) response of V
c,max
(the maximum rate of carboxylation); (B) response of J
max (light saturated rate of electron transport); (C) response of
V
o,max (the maximum rate of oxygenation); and (D) and the ratio of Vc,max / Vo,max versus temperature. n = 3 ± SD.
Temperature ( C)o Vc,max
(
mol
m
s
)
m
-2
-1
40 80 120 160
0 10 20 30 40
0 40 80 120 160
200 0
15 30 45 60
0 10 20 30 40 0.0
0.1 0.2 0.3 0.4 0.5
D
B
C
A
Temperature ( C)o Jmax
(
mol
m
s
)
m
-2
-1
V0,max
(
mol
m
s
)
m
-2
-1
V0,max
/
Bernacchi CJ, Portis AR, Nakano H, von Caemmerer S, Long SP (2002) Temperature response of mesophyll conductance. Implications for the determination of Rubisco enzyme kinetics and for limitations to
photosynthesis in vivo. Plant Physiol. 130:1992-1998.
Bernacchi CJ, Pimentel C, Long SP (2003) In vivo
temperature response functions of parameters required to model RuBP-limited photosynthesis. Plant Cell Environ. 26:1419-1430.
Farquhar GD, von Caemmerer S, Berry JÁ (1980) A
biochemical model of photosynthetic CO2 assimilation
in leaves of C3 species. Planta 149:78-90.
Goldschimidt EE, Koch KE (1996) Citrus. In: Zamski E, Schaffer AA (eds), Photoassimilate Distribution in Plants and Crops. Source-Sink Relationships. pp.825-850. Marcel Dekker, New York.
Harley P, Sharkey T (1991) An improved model of C3
photosynthesis at high CO2: reversed O2 sensitivity
explained by lack of glycerate reentry into the chloroplast. Photosynth. Res. 27:169-178.
Long SP (1991) Modification of the response of photosynthetic productivity to rising temperature by
atmospheric CO2 concentrations: has its importance
been underestimated? Plant Cell Environ. 14:729-739. Long SP, Bernacchi CJ (2003) Gas exchange
measurements, what can they tell us about the underlying limitations to photosynthesis? Procedures and sources of errors J. Exp. Bot. 54:2393-2401. Long SP, Ainsworth EA, Rogers A, Ort DR (2004) Rising
atmospheric carbon dioxide: plants FACE the future. Annu. Rev. Plant Biol. 55:591-628.
Lloyd J, Syvertsen JP, Kriedemann PE, Farquhar GD
(1992) Low conductances for CO2 diffusion from
stomata to the sites of carboxylation in leaves of woody species. Plant Cell Environ. 15:873-899. Sage RF (1994) Acclimation of photosynthesis to
increasing atmospheric CO2: the gas exchange
perspective. Photosynth. Res. 39:351-368.
Syvertsen JP, Lloyd JJ (1994) Citrus. In: Schaffer B, Andersen PC (eds), Handbook of Environmental Physiology of Fruit Crops. Vol. II: Sub-Tropical and Tropical Crops, pp.65-100. CRC Press, Boca Raton. von Caemmerer S, Farquhar GD (1981) Some relationships
between the biochemistry of photosynthesis and the gas exchange of leaves. Planta 153:376-387.
von Caemmerer S (2000) Biochemical Models of Leaf
Photosynthesis. Techniques in Plant Science no 2.
CSIRO Publishing, Collingwood.
Vu JCV, Yelenosky G (1988) Water deficit and associated changes in some photosynthetic parameters in leaves
of “Valencia”orange (Citrus sinensis [L.] Osbeck).
Plant Physiol. 88:375-381.
Wullschleger SD (1993) Biochemical limitations to carbon
assimilation in C3 plants – a retrospective analysis of
the A/Ci curves from 109 species. J. Exp. Bot. 44:907-920.
APPENDIX
Model theoryFarquhar et al. (1980) presented a model of leaf level photosynthesis with two rate limiting steps with a third added by Harley and Sharkey (1991). This model states that at any given internal concentration of CO2, photosynthesis is limited by the slower of three processes: 1) the maximum rate of Rubisco-catalyzed carboxylation (Rubisco-limited A); 2) the regeneration of RuBP controlled by electron transport rate (electron t r a n s p o r t - l i m i t e d A) ; o r 3 ) t h e r e g e n e r a t i o n o f RuBPcontrolled by the rate of triose-phosphate utilization (TPU-limited A). Both CO2 and O2 compete for the Rubisco binding site in the processes known as carboxylation and oxygenation, respectively (Farquhar et al., 1980). To account for the competitive inhibition between CO2 and O2, A is mathematically expressedas:
, 5
.
0 o d
c v R
v
A= − − [1]
where vc and vo are the rates of carboxylation and
oxygenation, respectively, and R
d is the mitochondrial
respiration (Farquhar et al., 1980).
When A is Rubisco-limited (Wc) the velocity of
carboxylation can be expressed as:
) / 1 ( max ,
o c
i
i c c
c
K O K C
C V v
W
+ +
⋅ =
=
,
[2]where Vc,max is the maximum rate of carboxylation, O is the
oxygen concentration, and K
c and Ko are the
Michaelis-Menten constants for CO2 and O2, respectively (Farquhar
et al., 1980).
The velocity of carboxylation when limited by the rate of electron transport (W
j) is expressed as stated by von
Caemmerer (2000):
* 5 . 10 5 .
4 + Γ
⋅ =
=
i i c
j
C C J v
where J is the potential rate of electron transport and can be expressed as a function of light saturated rate of electron transport (J
max), as stated by von Caemmerer (2000):
max max 1 . 2 J I f I f J J + ⋅ ⋅ ⋅
=
,
[4]where f is the fraction of light not absorbed by functional
photosynthetic pigments and I is the photon flux hitting the
leaf.
Triose phosphate utilization limited photosynthesis (W
p) was not a limitation in this study but can occur at low
temperatures or high levels of CO2 for others species and is expressed as:
TPU c
p v V
W = =3⋅
,
[5]where V
TPU is the velocity of triose phosphate utilization,
which is multiplied by three to represent three mol CO2 that
can be fixed for every mol of triose-phosphate made available (Harley and Sharkey, 1991).
Incorporating the three rate limiting steps into equation 1 yields:
) / * 1 , , min( ] / * 1 [ i p j c i C W W W C A Γ − ⋅ Γ −
=
,
[6]where the term Γ* is the CO2 compensation point in the absence of Rd. The term [1-Γ*/Ci] represents photorespiration and is derived from the equation:
) / 1 ( max c i o o, o K C K O O V v + + ⋅
=
,
[7]where V
o,max is the maximum rate of oxygenation (Farquhar
et al., 1980; von Caemmerer 2000). Photosynthesis limited by Wp is insensitive to changes in CO2 or O2 and thus the term representing photoinhibition is removed (von Caemmerer, 2000).
From the Rubisco limited portion of the A/Ci curve (integrating equation 2 into equation 1), below the inflection point of the curve (obtained by the interception of the adjusted curves for Rubisco limited and RuBP limited phases), the values of Vc,max and Rd can be calculated from the equation:
d i c i R K O K C C V C A o c i − + + ⋅ Γ − = ] ) / 1 ( . ) / * 1
[( ,max
,
[8]where Γ*= 42.05 µbar; O= 20.9 µbar; K
c= 404.9 µbar; and
Ko= 278.4 mbar at 25oC (Long and Bernacchi 2003). For
other temperatures, Γ*, Kc and Ko are adjusted by the
equation parameter = exp(c- ∆Ha/RTk), where c and ∆Ha
values for each parameter are presented in Bernacchi et al. (2001). The two unknowns Vc,max and Rdcan be solved, as shown by Long and Bernacchi (2003), by plotting A
(below the inflection point: Rubisco limited) as a linear function of f’ (Figure 2):
d
c f R
V
A= ,max. '−
,
[9]where: ) / 1 ( * ' o c
i K O K
C Ci f + + Γ −
=
,
[10]In this linear function, Vc,max is the slope and Rd the intercept (Figure 2).
On the other hand, from the RuBP limited portion of the A/C
i curve (using equation 3 into equation 1) above
the inflection point of the curve (obtained by the interception of the adjusted curves for Rubisco limited and RuBP limited phases), Jmax can be calculated from the equation stated by Long and Bernacchi (2003):
d i i i R C C J C A − Γ + ⋅ Γ − = ] * 5 . 10 5 . 4 . ) / * 1 [(
max
,
[11]Similarly for V
c,max, Jmax can be obtained by plotting A
(above the inflection point where it is RuBP limited) as a linear function of Ci (i.e. g’), but fixing the Rd value obtained from Vc,max calculations (equation [9]) to avoid large errors in estimated R
dfrom a linear regression (A x Ci,
i.e. g’), due to small errors in the higher rates of A (RuBP limited). Thus, after solving for Rd from the Rubisco limited portion (together with Vc,max), the value for Rd can be used in a linear regression (Long and Bernacchi, 2003), together with the high values of A (from RuBP limited portion) in a linear function of g’(Figure 2):
d
R g J
A= max. '− , [12]
where: * 5 . 10 5 . 4 * ' Γ + Γ − = i i C C
g
,
[13]where Jmax is the slope in this linear function (Figure 2).
Finally, V
o,max can be solved by the equation:
O K K V V c o c o . 5 . 0 * max , max , Γ ⋅ ⋅
=
,
[14]where Vc,max , Ko , Γ* , Kc and O are either known or solved