Prevalence of Cardiovascular Risk Factors in a Population of
Brazilian Industry Workers
Roberta Soares Lara Cassani, Fernando Nobre, Antônio Pazin Filho, André Schmidt
Faculdade de Medicina de Ribeirão Preto (USP), Ribeirão Preto, SP - BrazilSummary
Background: Determining the cardiovascular risk factors is essential for the primary and secondary prevention of circulatory system diseases.
Objective: To obtain the prevalence of cardiovascular risk factors in a population of industry workers in Brazil.
Methods: Transversal cohort study, with a sociodemographic interview to identify cardiovascular risk factors, anthropometric and blood pressure measurements and capillary blood collection for blood glucose, cholesterol and triglyceride measurement in food industry workers of both sexes.
Results: A total of ,047 workers were assessed, with 93 (87%) of them being males, with a mean age of 36 ± 8 years. The frequency of a sedentary lifestyle was 83% and of overweight, 63%. Systemic arterial hypertension was identified in 28% of the individuals and 45% were in the pre-hypertension range. Alterations in the blood glucose levels were identified in 49% of the participants, as well as high levels of cholesterol and triglycerides in 7% and % of the population, respectively. The body mass index (BMI) levels were not associated to income, but there was an inverse association with the level of schooling.
Conclusion: Overweight and a sedentary lifestyle are the main cardiovascular risk factors in a population of industry workers. (Arq Bras Cardiol 2009;92():5-2)
Key words: Risk factors; coronary disease; atherosclerosis; cerebrovascular disease; epidemiology; Brazil.
Mailing address: André Schmidt •
Rua Rui Barbosa, 261/61 - Centro - 14015-120 - Ribeirão Preto, SP - Brazil E-mail: [email protected], [email protected], [email protected] Manuscript received September 14, 2007; revised manuscript received November 01, 2007; accepted May 06, 2008.
of educational campaigns and intervention protocols that can optimize the use of the available resources. In Brazil, the prevalence of risk factors presents a regional variation9,10, with
an inverse association between the socioeconomic situation and cardiovascular mortality11,12. However, there have been
few comparative studies on the distribution of risk factors considering the socioeconomic differences.
The objective of the present study was to evaluate the prevalence of cardiovascular risk factors in a population of industry workers in Brazil.
Methods
From August 2002 to July 2003, the employees of a carbonated beverage plant, located in the city of Itu, state of Sao Paulo, Brazil, were evaluated. The study was approved by Ethics Committee in Research of Hospital das Clínicas of the School of Medicine of Ribeirão Preto of the University of São Paulo.
The study procedures were carried out by one of the authors of the study (RSLC) and by interviewers that were previously trained to conduct the several phases of the data collection, including the clinical and biochemical data. The collection of the material used in this study was carried out in five weekly periods (two mornings, two afternoons and one
Introduction
Coronary disease has been the main cause of death in Brazil since the 70s1. Several risk factors for coronary disease
have been identified, since the first studies derived from the Framingham Heart Study2-4. Several epidemiological
assessments verified the elevated presence of risk factors among the Brazilian population, but with distinct regional patterns1,5,6. Throughout the last decades, partly due to
changes in dietary habits and the degree of physical activity of the population, an increase in the incidence of overweight, even at the younger age ranges, has been observed, creating the conditions for the onset of diabetes and possibly, of coronary disease. Recently published studies with data of the Latin American population showed a high prevalence of risk factors in patients that were hospitalized due to unstable myocardial ischemic syndromes7,8.
evening), which coincided with the presence of the employees at the company’s Medical Service to undergo routine annual medical assessment, during their work shifts, with a previous fasting of at least 4 hours.
A standardized interview was carried out, together with an anthropometric assessment, blood pressure measurement and biochemical data collection, which lasted approximately 25 minutes. The standardized interview consisted in the collection of personal information such as age, income range and level of schooling, as well as personal life habits such as sedentary lifestyle (defined as fewer than three weekly periods of physical activity during leisure time with at least 30 minutes of duration) and previous knowledge of the presence of risk factors such as systemic arterial hypertension (SAH), smoking and diabetes, in addition to a family history of early coronary disease (men younger than 55 years and women younger than 60 years). The anthropometric measurements were obtained with the employee in the standing position, barefoot and with no upper-body garments, according to the manual of anthropometric procedures produced by the National Health and Nutrition Examination Survey (NHANES), revised in December 200013. Weight and height were obtained using a
Filizzola™ mechanical scale (model 31, São Paulo, Brazil). The body mass index (BMI) was obtained by dividing the weight in kilograms by the square of the height in meters. The abdominal circumference (AC) and the hip circumference (HC) were assessed, using an inextensible metric tape. The ratio between the AC and the HC (AHR) was calculated through the quotient of these values.
The systemic arterial hypertension was obtained with the employee in the sitting position, using an automated device (OMRON-Model HEM 705-CP, Japan), according to the methodology described at the V Brazilian Directives of Arterial Hypertension14. Three measurements, with a minimum
interval of one minute between them, were carried out and the final result was expressed as their arithmetic mean. The values were grouped according to the classification proposed by the VII Joint National Committee15.
Three drops of blood for biochemical measurements were collected through digital puncture from each employee, and each drop was directly applied to the disposable test strips, previously coupled to each device used for such purpose.
The capillary glucose was obtained through the GLUCOMETER ELITE (Bayer Elite, Japan) and total cholesterol and triglycerides were measured using the Accutrend GCT device (Boehringer Mannheim, Germany).
The values are expressed as means and standard deviations. Comparisons between the two variables were carried out using Student’s t test for continuous variables and Fischer’s exact test for comparison between proportions.
Analysis of variance (ANOVA) was used for the comparison among three or more groups of continuous variables and in case of statistically significant difference, post-test, the comparison of the pairs of variables was carried out by Bonferroni’s method. The Chi-square test was used to compare 3 or more variables, with analysis of tendency. Pearson’s correlation was carried out to observe the association between two continuous variables. The level of significance was set at <5%.
Results
Demographic Data
A total of 1047 employees were assessed, of which 913 (87%0 were males. This number corresponds to the total number of individuals that worked at the plant unit, except for those that were on sickness leave on the day of the routine medical assessment or were dismissed before the annual medical assessment. The mean age of the studied population was 36 ± 8 years. Around 2/3 were 30 to 50 years of age. Regarding the level of schooling, none of them were illiterate and most had finished High School or College (68%). Regarding the distribution per income range, in relation to the number of current minimum wages at the time, it was observed that most workers received more than 3 minimum wages (94%) and that the lower salaries predominated among women (20% of the women and 4% of the men received 1 to 3 minimum wages). Such fact was probably due to the type of less specialized activity performed by the women. Table 1 summarizes the demographic data.
Prevalence and distribution of cardiovascular risk factors The data are summarized in Table 2. Regarding blood pressure, it was observed that only 27% of the population presented BP levels that were considered normal or desirable. In contrast, the pre-hypertensive individuals comprised 45% of the population and systemic arterial hypertension (SAH)
Table 1 - Demographic data related to age range, level of schooling and income range of the studied population according to gender
Sex Female (n) %
Male (n) %
Total (n) % Age range (yrs)
≤ 30 33 25 268 29 301 29
31 – 40 55 41 395 43 450 43
41 – 50 34 25 197 22 231 22
> 50 12 9 53 6 65 6
Total 134 100 913 100 1047 100
Level of schooling
Elementary 61 45.5 271 29.7 332 32
High
School 52 38.8 393 43.0 445 42
College/
University 21 15.7 249 27.3 270 26
Total 134 100 913 100 1047 100
Income range (MW)
1 to 3 27 20 35 4 62 6
3 to 6 53 40 363 40 416 40
6 to 10 29 22 293 32 322 31
> 10 25 18 222 24 247 23
Total 134 100 913 100 1047 100
Table 2 - Prevalence and distribution by sex of Systemic Blood Pressure, Glycemia, Total cholesterolemia, Triglyceridemia, Family history and Smoking in the studied population of industry workers
Sex Female (n) % Male (n) % Total (n) %
BP Class
Normal 69 51 213 23 282 27
Pre-SAH 46 34 426 47 472 45
Stage 1 17 13 214 23 231 22
Stage 2 02 2 60 7 62 6
Total 134 100 913 100 1047 100
Glycemia (mg/dL)
< 100 74 55 457 50 531 51
≥ 100 and < 126 47 35 375 41 422 40
≥ 126 13 10 81 9 94 9
Total 134 100 913 100 1047 100
Cholesterol total (mg/dL)
Desirable (<200) 121 90 857 94 978 94
Borderline (200 to 239) 10 7 45 5 55 5
Elevated (≥ 240) 3 3 11 1 14 1
Total 134 100 913 100 1047 100
Triglycerides (mg/dL)
Normal (<150) 119 89 758 83 877 84
Borderline (150 to 199) 3 2 50 5 53 5
Elevated (200 to 499) 10 7 97 11 107 10
Very elevated (≥ 500) 2 2 8 1 10 1
Total 134 100 913 100 1047 100
Family History
Positive 62 46 247 27 309 30
Negative 63 47 663 72 726 69
Unknown 9 7 3 1 12 1
Total 134 100 913 100 1047 100
Smoking
Current 11 8 101 11 112 11
Prior 17 13 185 20 202 19
Never 106 79 627 69 733 70
Total 134 100 913 100 1047 100
BP - blood pressure; SAH - systemic arterial hypertension.
(stage 1 or 2) was identified in 293 individuals, corresponding to 28% of the studied population, with most of them being males (94%).
Regarding glucose intolerance, it was observed that 51% of the evaluated population presented glycemia below 100 mg/dl and 40 % were in the glucose intolerance range, showing glycemia levels ≥ 100mg/dL and < 126 mg/dL. The distribution per gender (41% of males and 35% of females) was similar regarding the presence of glucose intolerance (Chi-square: p=0.62). Glycemia > 126 mg/dl was detected in 9% of the individuals.
Elevated capillary cholesterol was found in 7% of the population and 11% presented increased levels of total triglycerides. Borderline levels of triglycerides were found in 2% of the female and 5% of the male employees. Thus, 16% of the population presented triglycerides levels above the desirable.
factor. It was not possible to accurately establish the presence of cardiovascular disease in family members in 12 individuals (9 females).
Smoking was present in 11% of the population, with no significant difference between genders (p=0.37). Regarding employees that reported previous smoking habit, the standardized interview showed that 185 men and 17 women had been smokers, which corresponded to 19% of the studied population. A total of 314 employees reported current or previous smoking habit, indicating that 30% of the studied population is or has been exposed to this risk factor.
A high level of sedentary lifestyle was observed (83%), with a similar distribution in both sexes. Regarding the physical activity practiced by the non-sedentary individuals, it was aerobic type activity in most cases: 42% walked, 15% developed aerobic activities or resistance exercises in health clubs or fitness centers and around 12% played soccer on a regular basis.
Anthropometric variables
It was observed that, except for the women aged 40 years or younger, the population presented mean BMI values within the pre-obesity range. The mean values for the female sex for the age ranges of 30 years or younger, 31 to 40 years, 41 to 50 years and older than 50 years were 25.5±4.2, 24.9±3.5, 26.2±3.9 and 27.5±6.3, respectively, with no significant difference observed among the several age ranges (ANOVA: P=0.19). On the other hand, the BMI in the male sex presented a positive correlation with the increased age range (r = 0.21; p < 0.001). The mean BMI values for the same age ranges described above for the female sex were 25.9±4.2, 26.4±3.7, 27.9±4.0 and 28.0±3.7. However, the significant difference observed between the younger and the older age ranges was more relevant (ANOVA: p <0.001).
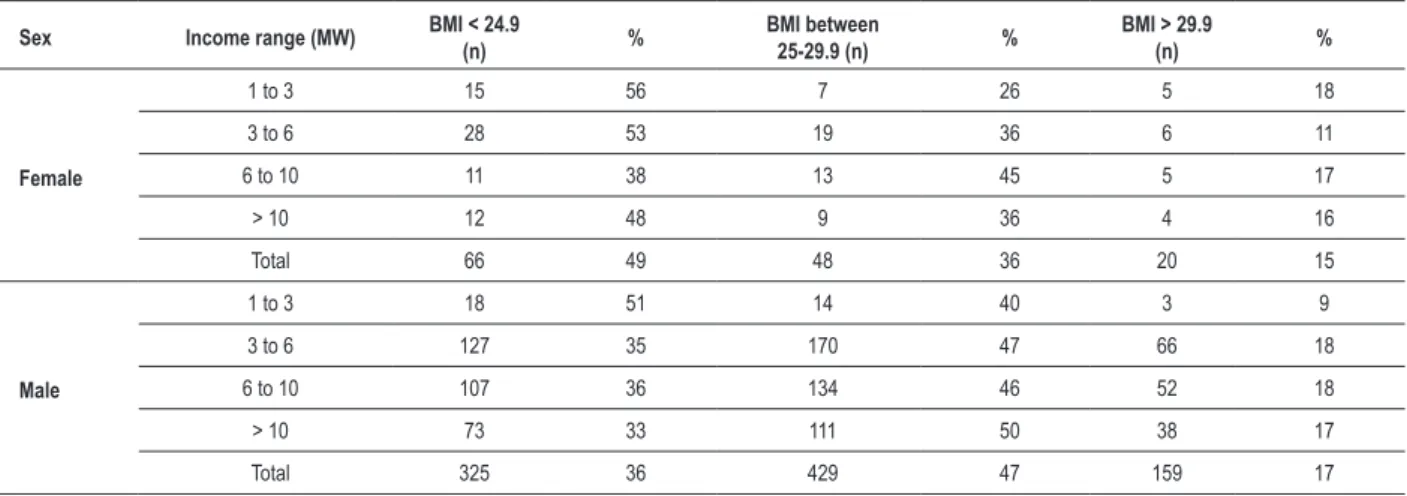
The data summarized in Table 3 indicate an elevated prevalence of overweight in the studied population (63%), which was higher among the men than among the women (64% and 51%, respectively). The pre-obesity range (46%
of the participants) was the one that presented the highest percentage of individuals. Among the possible associations that determined the elevated prevalence of overweight, two were analyzed in particular, as they are acknowledged as important variables regarding cardiovascular risk factors: income and level of schooling.
Table 4 shows the distribution of the normal or altered BMI according to the income range. The female population, within the income range of 6 to 10 minimum wages, presented the highest concentration of female employees with BMI > 25 kg/m². For the male sex, except for the lowest income range, there was a predominance of pre-obesity and obesity in all the others, being close to or higher than 2/3 of the population in the higher income ranges. In both sexes, it was not possible to identify statistically significant differences in the mean BMI among the several income ranges (ANOVA: p = 0.30 for the male sex and p = 0.91 for the female sex).
Regarding the level of schooling (Table 5), we observed that the behavior was distinct between the genders. There were no
Table 3 - Distribution of BMI by sex, according with the classiication
of the World Health Organization
BMI Classiication (WHO)
Female sex (n)
% Male sex (n) %
Total (n) %
Low weight 1 1 6 1 7 1
Normal weight 65 49 319 35 384 37
Pre-obesity 50 37 429 47 479 46
Obesity
Class I 15 11 127 14 142 13
Obesity
Class II 2 1 24 2 26 2
Obesity
Class III 1 1 8 1 9 1
Total 134 100 913 100 1047 100
BMI - body mass index.
Table 4 - Percentage distribution of the prevalence of normal weight, pre-obesity and obesity in relation to income range in the female sex
Sex Income range (MW) BMI < 24.9
(n) %
BMI between
25-29.9 (n) %
BMI > 29.9
(n) %
Female
1 to 3 15 56 7 26 5 18
3 to 6 28 53 19 36 6 11
6 to 10 11 38 13 45 5 17
> 10 12 48 9 36 4 16
Total 66 49 48 36 20 15
Male
1 to 3 18 51 14 40 3 9
3 to 6 127 35 170 47 66 18
6 to 10 107 36 134 46 52 18
> 10 73 33 111 50 38 17
Total 325 36 429 47 159 17
significant variations in BMI for the female sex (ANOVA p = 0.18) at the different levels of schooling. However, the male sex presented higher BMI values in the group with lower level of schooling (ANOVA P= 0.03).
The analysis among the subgroups (Bonferroni) showed that there was tendency toward lower BMI values among the individuals with higher levels of schooling, when compared to those with the lower levels of schooling.
Abdominal circumference, hip circumference and abdominal circumference/hip circumference ratio
The female sex did not present any significant alteration in the AC and HC, in spite of the increment observed in the AC after 40 years of age. The mean AC values for the age ranges 30 years or younger, 31 to 40 years, 41 to 50 years and older than 50 years were 83.7±9.5, 83.7±9.1, 88.1±11.1, 91.3±16.9 (p=0.05), respectively. For the same age ranges the HC values were: 102.3±9.8, 97.8±11.5 , 96.8±11.7 and 103.3±17.2 respectively (p=0.12).
Regarding the AC/HC ratio (AHR), there was statistical significance only when comparing the first and the third age ranges (Bonferroni: p=0.02), with the following respective values: 0.82±0.09, 0.86±0.1, 0.93±0.24 and 0.89±0.16.
The behavior of these anthropometric variables in the male population was distinct and is summarized in Table 6. In this case, all the variables increased with age, with statistical significance for AC and AC/HC ratio at the analysis per age range. The AC presented a significant increase with age, starting from a range where the association with lower cardiovascular risk is well-known, reaching clearly worrying dimensions at the older ranges. Regarding the HC, there was a variation only after 40 years of age, to a much lower extent.
Discussion
This study has identified a relatively young population with a high prevalence of cardiovascular risk factors. It is noteworthy the fact that alarming rates of sedentary lifestyle (83%) and overweight (63%) were observed. Brazilian population studies have frequently demonstrated sedentary habits16-18 at the same rates reported in the present study and
in distinct populations and regions. The elevated prevalence in such a young population group is an alarming fact. Similarly, overweight has been detected more often in several national9,16
and international studies, with the presence of subclinical atherosclerosis being relatively frequent in this group of individuals19. Additionally, in a relatively young population,
such overweight prevalence suggests elevated risk for obesity at a long-term follow-up, as observed by Framingham20,
although these data cannot be directly transported to our population sample. This may be partially verified in an indirect and statistically significant way through the increase in the abdominal circumference, currently considered an important predictor of metabolic alterations caused by the accumulation of visceral fat, in the several age ranges of the male sex (Table 6) and by the positive correlation of the BMI.
The analysis of the influence of the socioeconomic level shows that individuals with a higher level of schooling present lower BMI, especially in the male sex. This result is in accordance with previous studies that demonstrated the higher prevalence of obesity among the classes with lower levels of schooling21. On the other hand, income ranges
(Table 4) did not influence the BMI profile, which presented a similar distribution among the several evaluated ranges. The presence of overweight concomitantly to other cardiovascular risk factors22, was also verified in the present study.
We also observed a high prevalence of SAH and very markedly, of pre-hypertension, especially among male individuals. Considering that it has been demonstrated that individuals with borderline BP levels will present future BP increase23, one can infer that, without the occurrence of
intervention, there is an important tendency that this young population will present an elevated number of hypertensive individuals, according to results from international series.
Similarly, there was a high prevalence of individuals with glucose intolerance (40%), with 9% of them presenting glycemia > 126mg/dL. The national literature presents epidemiological data where the glucose intolerance was lower, but the studies considered as glucose intolerance only glucose levels > 110mg/dL and the present study used the recent classification by the American Diabetes Association, which classifies as glucose intolerance values between 100 and 125 mg/dL24.
Although no fasting glycemia levels were measured, the detection of elevated capillary glycemia levels after at least 4 hours of fasting is an indication of a disorder in the glucose homeostasis, as a certain equivalence between the capillary glycemia and the conventional venous glycemia has been described in the literature25. Considering the elevated
prevalence of overweight in the studied population, such fact is a relevant one, indicating a higher possibility of the future development of type 2 diabetes mellitus, if the current inadequate lifestyle habits are maintained.
Regarding dyslipidemia, we observed that the prevalence of hypercholesterolemia was lower than in studies with similar populations26,27 and at a lower percentage than most of the
other classic risk factors, with triglyceride level alterations being most commonly found.
Due to the type of professional activity, several educational campaigns developed by the company itself have reduced smoking, but almost one third of the employees still present the risk factor, due to current or previous smoking habits.
Our data are similar to that of other national studies in selected groups17,27. Similarly, there is a strict internal policy
that restricts alcohol consumption and the employees’ daily
Table 5 - Distribution of BMI (kg/m²), expressed in means and SD, according to gender and Level of Schooling
Level of Schooling Female sex Male sex*
Elementary School 26.3 ± 3.6 27.2 ± 3.7
High School 24.8 ± 4.0 26.5 ± 4.1**
College or University 25.6 ± 5.5 26.4 ± 4.0***
* ANOVA: P = 0.03; post-test with Bonferroni: **P <0.05 vs Elementary School;
diet record showed low alcohol consumption. Additionally, thanks to mechanization, there is no contact with the carbonated beverage, with most of the activities associated with the processing of supplies, packaging and transport. Something that could be of concern, the free access to carbonated beverages in the cafeteria, which could favor an exaggerated consumption of soft drinks, was neither observed nor reported in the diet reports.
Finally, the high prevalence of alterations in the abdominal circumference, especially in male individuals must be pointed out. As a marker of the occurrence of the metabolic syndrome, the pattern of alterations observed indicates that there can be a high prevalence of cases of metabolic syndrome, although a study aiming at that question has not been carried out, but where the nutritional intervention alone can be highly beneficial for the control of several risk factors and decrease of the global cardiovascular risk.
In conclusion, this study identifies the elevated prevalence of cardiovascular risk factors in a differentiated population group regarding socioeconomic aspects. The confirmation that modifiable risk factors predominate, suggests that educational programs can be useful in preventing further complications
caused by an identified non-healthy lifestyle. It is important to mention, however, that these programs must not be focused only on specific groups, but extended to include more comprehensive actions, through modifying actions of social behavior patterns, as many educational programs can be relevant for the primary prevention of several chronic diseases, such as the promotion of the practice of physical activity and a healthy diet.
Potential Conflict of Interest
No potential conflict of interest relevant to this article was reported.
Sources of Funding
There were no external funding sources for this study.
Study Association
This article is part of the thesis of master submitted by Roberta Soares Lara Cassani, from Faculdade de Medicina de Ribeirão Preto - USP.
References
1. de Souza MF, Alencar AP, Malta DC, Moura L, Mansur AP. Serial temporal analysis of ischemic heart disease and stroke death risk in five regions of Brazil from 1981 to 2001. Arq Bras Cardiol. 2006; 87: 735-40.
2. Kannel WB, Dawber TR, Kagan A, Revotskie N, Stokes J 3rd. Factors of risk in the development of coronary heart disease--six year follow-up experience. The Framingham Study. Ann Intern Med. 1961; 55: 33-50.
3. Dawber TR, Kannel WB, McNamara PM, Cohen ME. An epidemiologic study of apoplexy (“strokes”). Observations in 5,209 adults in the Framingham Study on Association of Various Factors in the development of apoplexy. Trans Am Neurol Assoc. 1965; 90: 237-40.
4. Freund KM, Belanger AJ, D’Agostino RB,Kannel WB. et al. The health risks of smoking. The Framingham Study: 34 years of follow-up. Ann Epidemiol. 1993; 3: 417-24.
5. Lessa I, Mendonca GA, Teixeira MT. Non-communicable chronic diseases in Brazil: from risk factors to social impact. Bol Oficina Sanit Panam. 1996; 120: 389-413.
6. Lessa I. Trends in productive years of life lost to premature mortality due to coronary heart disease. Arq Bras Cardiol. 2002; 79: 617-8.
7. Lanas F, Avezum A, Bautista LE, Diaz R, Luna M, Islam S, et al. Risk factors for acute myocardial infarction in Latin America: the INTERHEART Latin American study. Circulation. 2007; 115: 1067-74.
8. Piegas LS, Avezum A, Pereira JC, Neto JM, Hoepfner C, Farran JA, et al. Risk factors for myocardial infarction in Brazil. Am Heart J. 2003; 146: 331-8.
9. Castanho VS, Oliveira LS, Pinheiro HP, Oliveira HC, Faria EC. Sex differences in risk factors for coronary heart disease: a study in a Brazilian population. BMC Public Health. 2001; 1: 3.
10. Feio CM, Fonseca FA, Rego SS, Feio MNB, Elias MC, Costa EA, et al. Lipid profile and cardiovascular risk in two Amazonian populations. Arq Bras Cardiol. 2003; 81: 592-5.
11. Kannel WB, Eaker ED. Psychosocial and other features of coronary heart disease: insights from the Framingham Study. Am Heart J. 1986; 112: 1066-73.
12. Ishitani LH, Franco GC, Perpetuo IH, Franca E. Socioeconomic inequalities
and premature mortality due to cardiovascular diseases in Brazil. Rev Saude Publica. 2006; 40: 684-91.
13. National Center for Health Statistics. National Health and Nutrition. Examination Survey. NHANES III, Data, Files, Documentation, and SAS Code. [Accessed 2007 Ago 3]. Available from: http://www.cdc.gov/nchs/about/ major/nhanes/nh3data.htm.
14. Sociedade Brasileira de Cardiologia. IV Diretrizes Brasileiras de Hipertensão Arterial. Arq Bras Cardiol. 2004; 82 (supl 4): 7-22.
15. Chobanian AV, Bakris GL, Black HR, Cushman WC, Green LA, Izzo JL, et al. The Seventh report of the Joint National Committee on Prevention, detection, Evaluation, and Treatment of High Blood Pressure: the JNC 7 Report. JAMA. 2003; 289: 2560-72.
16. Castanheira M, Olinto MT, Gigante DP. Socio-demographic and lifestyle factors associated with abdominal fat distribution in adults: a population-based survey in Southern Brazil. Cad Saude Publica. 2003;19 (Suppl 1): S55-S65.
17. Matos MF, Souza e Silva NA, Pimenta AJ, da Cunha AJ. Prevalence of risk factors for cardiovascular disease in employees of the Research Center at Petrobras. Arq Bras Cardiol. 2004; 82: 1-4.
18. Bertolami MC, Faludi AA, Latorre MR, Zaidan FT. Lipid profile of metallurgic industry employees and its relationship with other risk factors Arq Bras Cardiol. 1993; 60: 293-9.
19. Ingelsson E, Sullivan LM, Fox CS, Murabito JM, Benjamin EJ, Polack JF, et al. Burden and prognostic importance of subclinical cardiovascular disease in overweight and obese individuals. Circulation. 2007; 116: 375-84.
20. Vasan RS, Pencina MJ, Cobain M, Freiberg MS, D’Agostino RB. Estimated risks for developing obesity in the Framingham Heart Study. Ann Intern Med. 2005; 143: 473-80.
21. Bossan FM, Dos Anjos LA, Leite D, Wahrlich V. Nutritional status of the adult population in Niteroi, Rio de Janeiro, Brazil: the nutrition, physical activity, and health survey. Cad Saude Publica. 2007; 23: 1867-76.
23. Vasan RS, Larson MG, Leip EP, Evans JC, O’Donnel CJ, Kannel WB, et al. Impact of high-normal blood pressure on the risk of cardiovascular disease. N Engl J Med. 2001; 345: 1291-7.
24. American Diabetes Association. Diagnosis and classification of diabetes mellitus. Diabetes Care. 2007; 30 (Suppl.1): S42-S47.
25. Ellison JM, Stegmann JM, Colner SL, Michael RH, Sharma MK, Ervin KR, et al. Rapid changes in postprandial blood glucose produce concentration
differences at finger, forearm, and thigh sampling sites. Diabetes Care. 2002; 25: 961-4.
26. Gupta A, Gupta R, Lal B, Singh AK, Kothari K. Prevalence of coronary risk factors among Indian physicians. J Assoc Physicians India. 2001; 49: 1148-52.