Universidade Federal Fluminense – UFF
Mailing address: Delma Maria Cunha – Coordenação do Mestrado em Cardiologia – Av. Marquês do Paraná, 303 – 2º - 24033-900 – Niterói, RJ, Brazil
English version by Stela Maris C. Gandour
Objective: To identiy left ventricular geometric pat-terns in hypertensive patients on echocardiography, and to correlate those patterns with casual blood pressure measurements and with the parameters obtained on a 24-hour ambulatory blood pressure monitoring.
Methods – We studied sixty hypertensive patients, grouped according to the Joint National Committee stages of hypertension.. Using the single- and two-dimensional Doppler Echocardiography, we analyzed the left ventricu-lar mass and the geometric patterns through the correla-tion of left ventricular mass index and relative wall thi-ckness. On ambulatory blood pressure monitoring we as-sessed the means and pressure loads in the different geo-metric patterns detected on echocardiography
Results- We identified three left ventricular geometric patterns: 1) concentric hypertrophy, in 25% of the patients; 2) concentric remodeling, in 25%; and 3) normal geometry, in 50%. Casual systolic blood pressure was higher in the group with concentric hypertrophy than in the other groups (p=0.0-01). Mean systolic pressure in the 24h, daytime and nighttime periods was also higher in patients with concentric hyper-trophy, as compared to the other groups (p=0.003, p=0.004 and p=0.007). Daytime systolic load and nighttime diastolic load were higher in patients with concentric hypertrophy ( p=0.004 and p=0.01, respectively).
Conclusions- Left ventricular geometric patterns show significant correlation with casual systolic blood pressure, and with means and pressure loads on ambula-tory blood pressure monitoring.
Key –words: hypertension, left ventricular hypertrophy, echocardiography
Arq Bras Cardiol, volume 76 (nº 1), 22-8, 2001
Delma Maria Cunha, Ademir Batista da Cunha, Wolney de Andrade Martins, Luís Augusto de Freitas Pinheiro, Luís José Martins Romêo, Álvaro Vilela de Moraes,
Fernando Portugal Morcerf
Rio de Janeiro, RJ - Brazil
Echocardiographic Assessment of the Different Left
Ventricular Geometric Patterns in Hypertensive Patients
The occurrence of ventricular hypertrophy undoub-tedly represents an important marker of increased risk for cardiovascular events; therefore, the importance of identi-fying the patterns of hypertrophy in patients with hyper-tension is widely justified 1,2.
A recent study by Mensah et al 3 reported that
measu-rement of the left ventricular mass on echocardiography proved to be better for predicting the evolutional process of hypertension as compared with other variables, such as systolic blood pressure, diastolic blood pressure, and hy-pertension staging 4.
Left ventricular hypertrophy is no longer considered an adaptive process that compensates the pressure impo-sed on the heart and has been identified as an independent and significant risk factor for sudden death, acute myocar-dial infarction, and congestive heart failure 4,5.
In cardiac hypertrophy, anomalous collagenous pro-teins and other types of contractile propro-teins (myosin with different functional properties) are produced. These myo-sins show a lower activity of the ATPase enzyme and a lo-wer velocity of polo-wer generation. Likewise the formation of anomalous collagenous proteins, changes in contractile proteins also occur. Concomitantly, sarcomeres and fibro-blasts proliferate and become hyperplastic. These adapta-tions aim to maintain the cardiac contractile capacity to compensate the pressure load imposed on the heart 6.
The cardiac adaptive process is not always beneficial for functioning of the heart and causes alteration in myo-cardial fibers, in the cardiac capacity to respond to adrener-gic stimuli, in the left ventricular diastolic function, in the coronary artery flow, and finally in the contractile function 6.
increase in mass. Concomitantly to these myocardial chan-ges, hypertrophy of the walls of the resistance coronary vessels occurs 6-8.
Coexistence of these alterations significantly limits the perfusion of left ventricular muscle mass. The decrease in the coronary flow reserve contributes to the pathogenesis of myocardial ischemia and heart failure in patients with left ventricular hypertrophy. Direct effects on myocardial elec-trical instability may also occur, contributing to severe ar-rhythmias and sudden death, which have a high incidence in patients with left ventricular hypertrophy 6,7.
According to Devereux et al 9, the increase in left
ventri-cular mass represents a common final pathway towards which adverse effects on the cardiovascular system converge, resul-ting in a higher vulnerability to complications.
Studies by Levy et al 10 and Kannel 11 reported that left
ventricular hypertrophy is a strong indicator of bad prog-nosis in hypertensive individuals and in the general popula-tion. The risk of congestive heart failure, acute myocardial infarction, and sudden death is 6- to 8-fold higher in patients with left ventricular hypertrophy.
The term “concentric remodeling” has recently been used to explain volumetric or geometric alterations due to injuries to the myocardium, and it probably means that a structural or biochemical alteration of the muscle, vascular, or interstitial compartments is happening 7,8.
Koren et al 12 and Casale et al 13, among others, have
shown that even in patients with normal left ventricular mass, definition of the left ventricular geometry, and in par-ticular of concentric remodeling, is an important marker of cardiovascular risk.
The hemodynamic stress is clearly a critical determi-nant for left ventricular hypertrophy, and elevated blood pressure is its major triggering factor.
This study aims to identify echocardiographic left ven-tricular geometric patterns in hypertensive individuals and to correlate these patterns with a casual blood pressure measurement and with the parameters obtained on ambula-tory blood pressure monitoring for 24 hours.
Methods
We studied 60 patients from 1995 to 1997, who had been diagnosed with hypertension by casual measurement of the blood pressure and who had not received antihypertensive treatment for at least the last 3 weeks. Their ages ranged from 18 to 65 years. The casual blood pressure was considered the mean of the 3 pressure values measured in the sitting posi-tion, in the supine posiposi-tion, and in the standing posiposi-tion, wi-th a time interval of 5 minutes, and wi-these measurements were performed during routine ambulatory visits.
Pressures were gauged by an indirect method with a conventional mercury sphygmomanometer, XJ11YA model (Nrughai Goode Medical Instrument Factory, Japan), which was graded from 0 to 300, at every 2mm of mercury (mmHg), and calibrated. Calibration of the mercury manometer was assessed by visual inspection of the coincidence of the point of mercury with the zero level of the device 14,15.
Determination of the systolic and diastolic levels of blood pressure was based on Korotkoff sounds 14,15.
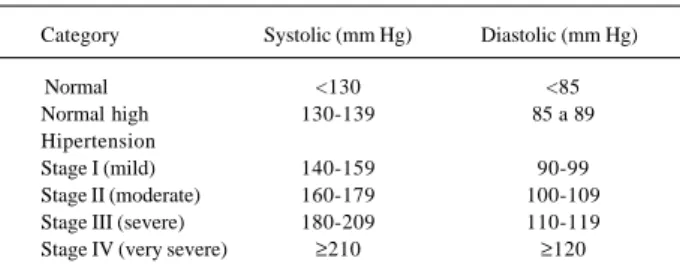
Systo-lic blood pressure was identified as the first audible sound, which is a weak sound followed by regular beats (phase I) that increase in intensity. Diastolic blood pressure was iden-tified as the point where the sounds disappeared (phase V). Blood pressure classification was based on the Fifth Report on the Joint National Committee (JNC-V) 16, and
tho-se patients with normal or normal-to-high blood pressure were excluded from the study (Table I).
Stages from I to IV were considered, and the diastolic blood pressure was used as the determining factor to define the stage of hypertension.
All patients were analyzed considering age, sex, and color. The patients diagnosed with coronary artery disease, valvular heart diseases, pericardial diseases, cardiomyopa-thies, and debilitating diseases were excluded from the study.
Echocardiography was performed by a single profes-sional with wide experience in the method. Three measure-ments were taken for each variable studied, and the final mean value was considered for analysis.
The patients were then divided into groups according to the geometric pattern found on echocardiography. For calculating left ventricular mass, we used the combination of the cubic function with the determinations of the Penn Convention for measurements, according to the method of anatomic validation established by Devereux et al 9. The
re-sults expressed in grams were corrected for body surface and, therefore, we obtained the left ventricular mass index (g/m2). Left ventricular mass values below 125g/m2 were
considered normal, independent from sex. This value of mass was adopted as the cut point because it was conside-red in some studies 10,11,17 as predictive of cardiovascular
events in men and women.
The following formula was used for calculating left ventricular mass 18:
LV mass = 1.04 (LVDD + IVST + LVPWT)3 – LVDD3 – 13.6
Where: 1.04 = myocardial density; LVDD = left ventri-cular internal diastolic diameter; IVST = interventriventri-cular septal thickness; LVPWT = left ventricular posterior wall thi-ckness; 13.6 = constant used by Devereux in the validation of anatomic mass measurement.
Left ventricular relative thickness and its relation with left ventricular mass defined left ventricular geometric pat-terns. For determining the relative wall thickness (RWT), we
Table I – Classification of blood pressure according to JNC-V
Category Systolic (mm Hg) Diastolic (mm Hg)
Normal <130 <85
Normal high 130-139 85 a 89
Hipertension
Stage I (mild) 140-159 90-99
considered the left ventricular posterior wall diastolic thick-ness multiplied by 2 and divided by the diastolic diameter of this cavity 12,18: RWT = 2 x LVPWT/LVDD
Values below 0.45 were considered normal 12,18.
When quantitatively studying left ventricular mass and its relation with the relative wall thickness, we found three types of left ventricular geometric patterns, as follows: 1) concentric hypertrophy, left ventricular mass index >125g/ m2, and relative wall thickness >0.45; 2) concentric
remode-ling, left ventricular mass index <125g/m2, and relative wall
thickness >0.45; and 3) normal geometry, left ventricular mass index <125g/m2, and relative wall thickness <0.45.
For analyzing left ventricular systolic function, we cal-culated the ejection fraction (stroke volume/diastolic volu-me x 100) and the percentage of left ventricular systolic shor-tening (%∆ D), obtained with the following equation: dias-tolic diameter – sysdias-tolic diameter/diasdias-tolic diameter x 100.
Diastolic function was assessed by the following pa-rameters: 1) IVRT (isovolumetric relaxation time); 2) E/A ratio on Doppler; 3) E/A ratio by analysis of the left atrial posterior wall; 4) E deceleration; 5) time of E deceleration; and 6) measurement of the E to F slope of the mitral valve on one-dimensional echocardiography 19,20.
All patients underwent ambulatory blood pressure monitoring 18,19 by the auscultatory method during 24-hours
with the device AND TM 2420/TM 2020 from Takeda. We considered the examinations whose valid readings were higher than 80%. To check the reliability of the mea-surements obtained by ambulatory blood pressure moni-toring, blood pressure was measured with a mercury sphygmomanometer, properly calibrated, and no difference of pressure between the instruments greater than 3mmHg was allowed.
Analysis of the ambulatory blood pressure monitoring met the criteria established by the II Consenso Brasileiro para Uso da Monitorização Ambulatorial da Pressão Arterial 21-23.
The percentage of blood pressure measurements above the values considered normal for the day and night periods related to systolic and diastolic pressures was called pressure load 21.
Pressure measurements obtained on ambulatory blood pressure monitoring were analyzed according to values previously established through population studies, which may constitute an analysis of a recording of ambulatory blood pressure monitoring 21.
In order to compare means in independent samples, we used the Student t test or the Mann-Whitney’s test, when the Student t test could not be applied. Comparisons of the means of the 3 or more groups were performed throu-gh analysis of variance. We used the Tukey test for multiple comparisons to distinguish the different groups. In the case of variables that did not show an approximately normal dis-tribution, such as the pressure load, the Kruskal-Wallis ana-lysis of variance and the corresponding test of multiple comparisons were used. We used Pearson’s correlation coefficient (r) to assess whether a significant association between 2 continous variables occurred. In the comparison
of proportions, we used the chi-square test or Fisher exact test, when the chi-square test could not be applied.
We adopted the statistical significance level of 5%.
Results
We identified three types of left ventricular geometry in the hypertensive patients studied: 1) normal geometry, characterized by normal left ventricular mass index and nor-mal relative wall thickness [30 (50%) patients]; 2) concentric hypertrophy, characterized by increased left ventricular mass index and increased relative wall thickness [15 (25%) patients]; and 3) concentric remodeling, where the left ven-tricular mass index is normal and the relative wall thickness is increased [15 (25%) patients].
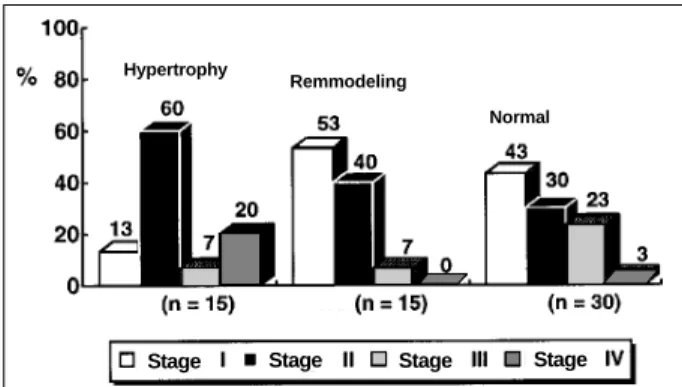
Blood pressure classification was as follows: 1) stage I of hypertension, 23 (38.3%) patients; 2) stage II, 24 (40%) patients; 3) stage III, 9 (15%) patients; and 4) stage IV, 4 (7%) patients. Most patients were in stages I and II (fig. 1). Figure 2 shows the percentage distribution of hyper-tensive patients according to the blood pressure classifica-tion and the geometric patterns found in the study. Sixty per-cent of the patients with conper-centric hypertrophy had stage II hypertension, while 53.3% of the patients with concentric remodeling had stage I hypertension. In all left ventricular geometric patterns (concentric hypertrophy, concentric re-modeling, and normal geometry), patients in hypertensive stages I and II predominated.
When casual blood pressure was correlated with left ventricular geometry, we observed that systolic pressure
Fig. 2 – Left ventricular geometric patterns in hypertensive patients according to the stages of the JNC-V classification.
Stage Stage Stage Stage
Hypertrophy
Remmodeling
Normal
Fig. 1 – Percentage of hypertensive patients distributed in stages according to the JNC-V classification of systemic hypertension.
Stage Stage
Stage
was significantly higher (p=0.001) in patients with concen-tric hypertrophy as compared with those with concenconcen-tric re-modeling or normal geometry. In regard to casual diastolic pressure, the means were very close in the three groups, the higher mean diastolic blood pressure occurring in patients with concentric hypertrophy; however, this difference was not statistically significant (Tables II and III).
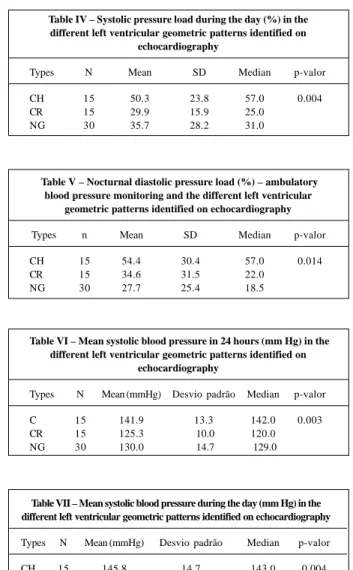
In regard to the pressure load obtained by ambulatory blood pressure monitoring, a statistically significant differen-ce in systolic pressure load during the day was observed between the patients with concentric hypertrophy and those with concentric remodeling or normal geometry (p=0.004). No statistically significant difference was observed in the mean diastolic pressure load during the day; however, the noctur-nal period showed a statistically significant difference betwe-en the group with concbetwe-entric hypertrophy and those with concentric remodeling and normal geometry (p=0.014). In-creased diastolic load at night was important in determining left ventricular geometry (tables IV and V).
In our series, the systolic means analyzed on ambula-tory blood pressure monitoring, in the 24-hour period, du-ring the day or at night, were statistically higher in patients with concentric hypertrophy than in the remaining pa-tients with concentric remodeling or normal geometry, or both (p=0.003; p=0.004; and p=0.007, respectively). Diastolic means only showed significant differences between the groups at night (p=0.039), where the values found in patients with concentric hypertrophy were consi-derably different from the remaining groups (tables VI, VII, VIII, and IX).
When left ventricular systolic function was analyzed on echocardiography in the different geometric pattern groups, we observed that ejection fraction was significantly lower in patients with concentric hypertrophy as compared with those with no geometric alterations in the left ventricle (p=0.01) (Table X).
In regard to the percentage of systolic shortening (%
∆ d), no significant difference was observed in the means of the groups.
On echocardiography, two parameters (IVRT and E/A
Table II – Systolic casual blood pressure in the different left ventricular geometric patterns in hypertensive individuals
Types N Mean SD p valor
CH 15 178.3 25.4 0.001
CR 15 160.9 19.1
NG 30 156.5 11.1
CH- concentric hypertrophy; CR- concentric remodeling; NG- normal geometry.
Table III – Diastolic casual blood pressure in the different left ventricular geometric patterns in hypertensive individuals
Types N Mean SD p-valor
CH 15 106.0 10.5 0.07
CR 15 98.5 6.5
NG 30 102.0 8.5
Table IV – Systolic pressure load during the day (%) in the different left ventricular geometric patterns identified on
echocardiography
Types N Mean SD Median p-valor
CH 15 50.3 23.8 57.0 0.004
CR 15 29.9 15.9 25.0
NG 30 35.7 28.2 31.0
Table V – Nocturnal diastolic pressure load (%) – ambulatory blood pressure monitoring and the different left ventricular
geometric patterns identified on echocardiography
Types n Mean SD Median p-valor
CH 15 54.4 30.4 57.0 0.014
CR 15 34.6 31.5 22.0
NG 30 27.7 25.4 18.5
Table VI – Mean systolic blood pressure in 24 hours (mm Hg) in the different left ventricular geometric patterns identified on
echocardiography
Types N Mean (mmHg) Desvio padrão Median p-valor
C 15 141.9 13.3 142.0 0.003
CR 15 125.3 10.0 120.0
NG 30 130.0 14.7 129.0
Table VII – Mean systolic blood pressure during the day (mm Hg) in the different left ventricular geometric patterns identified on echocardiography
Types N Mean (mmHg) Desvio padrão Median p-valor
CH 15 145.8 14.7 143.0 0.004
CR 15 129.9 10.0 125.0
NG 30 132.9 14.8 132.5
Table VIII – Mean nocturnal systolic blood pressure (mmHg) in the different left ventricular geometric patterns identified on echocardiography
Types N Mean Desvio padrão Median p-valor
CH 15 126.0 16.6 128.0 0.007
CR 15 111.5 11.0 107.0
NG 30 113.8 12.7 112.0
Table IX – Mean nocturnal diastolic blood pressure (mmHg) – ambulatory blood pressure monitoring and the different left ventricular geometric patterns identified on echocardiography
Types N Mean SD Median p-valor
CH 15 80.1 8.2 82.0 0.039
CR 15 71.3 11.7 69.0
NG 30 73.7 9.0 71.5
Discussion
Left ventricular hypertrophy, at first an adaptive res-ponse of the heart to hemodynamic overload, is also the re-sult of a process modulated by other biological determi-nants involving humoral, physical, and genetic factors, pro-per for each type of hypro-pertension 24.
Some authors observed that quantitative variables are not exclusive in determining the degree of hypertrophy. In 1953, Grant, cited by Sens et al 25, already stated that many
exceptions to this rule existed. Autopsy studies showed that many patients with marked hypertension had little or no hypertrophy, considering the same duration and degree of severity of the disease.
Our study showed that 53.3% of the hypertensive pa-tients with left ventricular concentric remodeling are in stage I of hypertension, according to the JNC-V classification, and
that 60% of the hypertensive patients with concentric hy-pertrophy are in stage II, being considered mild and mode-rate hypertensive patients, respectively. Therefore, we ob-serve that left ventricular geometric alterations do not de-pend on the degree of hypertension.
In the population studied, left ventricular geometric al-terations occurred in 50% of the hypertensive patients. We know that left ventricular concentric remodeling even in the absence of hypertrophy may be related to a higher risk of cardiovascular events in hypertensive patients. Therefore, analysis of the relative wall thickness seems to be a useful index of easy technical obtainment, providing valuable in-formation in regard to adequacy of hypertrophy in different conditions 12.
In most of the studies, only 30% of the hypertensive patients have left ventricular hypertrophy, but this figure in-creases to 50 to 60% when measurements such as relative wall stress and relative wall thickness are used in the analy-sis of left ventricular geometry 26.
Devereux et al 27 carried out a study to assess left
ven-tricular mass index and relative wall thickness as two indices of left ventricular hypertrophy follow-up in nontreated hy-pertensive patients. These authors showed that relative wall thickness, as an index to assess the severity of hyper-trophy, has a direct and strict relation with total peripheral resistance and an inverse relation with cardiac index. The classic pattern of hypertrophy in hypertensive patients (concentric hypertrophy), determined by relative wall thick-ness, correlates with elevated peripheral resistance (deter-mined on echocardiography), suggesting that left ventricu-lar hemodynamic and anatomic alterations may have inter-dependent pathophysiological mechanisms.
Studies, such as the Framingham Heart Study 10, have
shown that not only detection of hypertrophy but also its de-gree may be associated with higher risks of cardiac events. Therefore, for each increment of 50g/m2 in left ventricular
mass, corrected for the patient’s height, an increase of 1.73 occurs in the relative risk of mortality, even in patients with no cardiovascular disease.
In regard to diastolic function and the different pat-terns of left ventricular adaptation to hypertension, recent studies 28 have shown that indices used for analyzing
dias-tolic function may have a distinct association with a certain type of left ventricular geometry, suggesting different me-chanisms of adaptation in hypertension.
Some interrelations between factors accounting for left ventricular hypertension and diastolic function deficit are complex and not yet clearly understood in hypertensive pa-tients. Abnormalities in diastolic function in patients with normal systolic function may be the most early manifesta-tion of systemic hypertension. These manifestamanifesta-tions seem to be mediated by an increase in the sympathetic activity and in the renin-angiotensin system and may be an alert for monitoring these patients 28.
In our study, the altered diastolic function indices that showed statistical significance were more common in the group with concentric hypertrophy. When we compared pa-Table X – Behavior of the left ventricular ejection fraction (%) on
echocardiography in the different left ventricular geometric patterns
Types N Mean SD Median p-valor
CH 15 64.1 12.2 64.0 0.01
CR 15 66.3 9.2 64.0
NG 30 71.9 6.7 73.5
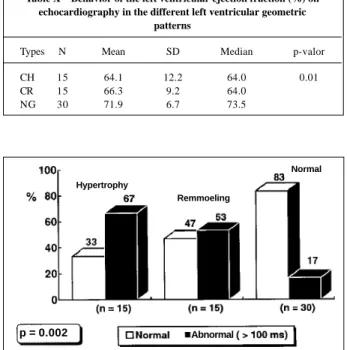
Fig. 3 – Diastolic function – isovolumetric relaxation time in the different left ventricular geometric patterns in hypertensive individuals.
Hypertrophy
Remmoeling
Normal
Abnormal
Fig. 4 – Diastolic function – E/A ratio analyzed through the movement of the left atrial posterior wall in the different left ventricular geometric patterns in hyperten-sive indi
Hypertrophy
Remmoeling Normal
Abnormal
p = 0.002
1. Levy D, Anderson KM, Savage DD. Echocardiographically detected left ventri-cular hypertrophy: Prevalence and risk factors in the Framingham Heart Study. Ann Intern Med 1988;108: 7-13.
2. Post WS, Levy D. New Development epidemiology of left ventricular hypertrophy. The Framingham Heart Study. Massachusetts Curr Opin Cardiol 1994; 5: 534-41. 3. Mensah G, Pappas T, Koren M, et al. Comparison of classification of the severity
of hypertension by blood pressure level and by World Health Organization cri-teria in the prediction of concurrent cardiac abnormalities and subsequent com-plications in essential hypertension. J Hypertens 1993; 11: 1429-40. 4. The Guidelines subcommitte of the WHO/ISH Mild Hypertension Liaison
Committe: 1993. Guidelines for the management of mild hypertension: memo-randum from a World Health Organization International Society Hypertension meeting. Hypertension 1993; 22: 392-403.
5. Devereux RB. Does increased blood pressure cause left ventricular hypertrophy or vice versa? Ann Intern Med 2000; 112: 57-8.
6. Saragoça M. A Hipertrofia ventricular esquerda e sua reversão ( Conferência). Arq Bras Cardiol 1992; 58: 351-4.
7. Mady C. A remodelagem, remodelação, remodelamento. Arq Bras Cardiol 1996; 2: 51-63.
8. Mandarim-de-Lacerda CA. Aspectos morfológicos da remodelação ventricular esquerda na cardiomiopatia hipertensiva. Arq Bras Cardiol 1995; 65: 523-7. 9. Devereux RB, Reicheck MD. Echocardiographic determination of left
ventricular mass in men. Anatomic validation of the method. Circulation 1997; 55: 613-8.
10. Levy D, Garrison RJ, Savage DD. Prognostic implications of echocardiographi-cally determined left ventricular mass in the Framingham Heart Study. N Eng J Med 1990; 322: 1561-6.
11. Kannel WB. Prevalence and natural history of eletrocardiography left ventri-cular hypertrophy. Am J Med 1983; 75: 4-8.
12. Koren MJ, Devereux RB, Casale PN. Relation of the left ventricular mass and geo-metry to morbidity an mortality in uncomplicated essential hypertension. Ann Intern Med 1991; 114: 345-52.
13. Casale E, Paul N, Devereux RB, Milner M, et al. Value of echocardiography mea-surement of left ventricular mass in predicting cardiovascular morbid events in hypertensive men. Ann Intern Med 1986; 105: 173-8.
14. Perloff D, Geim C, Flack J, et al. Human blood pressure determination by Sphyg-momanometer. Circulation 1993; 88: 2460-70.
15. Holanda H, Mion Jr D, Pierium MAS. Medida da pressão arterial: critérios empre-gados em artigos científicos de periódicos brasileiros. Arq Bras Cardiol 1997; 68: 433-6.
16. The Fifth Report of the Joint National Committee (JNC-V) on detection, evaluati-on and treatment of high blood pressure. Arch Intern Med Jan 1993; 153: 154-81. 17. Levy D, Garrison RJ, Savage DD, Kannel WB, Castelli WP. Left ventricular mass and incidence of coronary heart disease in an elderly cohort. Ann Intern Med 1989; 110: 101-7.
18. Devereux RB, Alonso DR, Lutas EM, et al. Echocardiographic assessment of left ventricular hypertrophy: comparison to necropsy findings. Am J Cardiol 1986; 57: 450-8.
19. Morcerf FAP. Ecocardiograma unidimensional normal. In Ecocardiografia uni-bidimensional, transesofágica e Doppler. 2a ed. Rio de Janeiro. Revinter, 1996;
45-72.
20. Morcerf FAP. Avaliação do tamanho e da função do ventrículo esquerdo. In Eco-cardiografia uni-bidimensional, transesofágica e Doppler. 2a ed. Rio de Janeiro:
Revinter, 1996; 193-208.
21. Consenso Brasileiro para uso da monitorização ambulatorial da pressão arterial II. J Bras Nefrol 1997; 19(suppl 1): 53-64.
22. Consenso Brasileiro para uso da MAPA I. Arq Bras Cardiol 1993; 60: 129-34. 23. Simpósio ABC. Monitorização ambulatorial da pressão arterial. Arq Bras Cardiol
1996; 67: 130-48.
24. Messerli FH, Aepfelbacher FC. Hipertensão e hipertrofia ventricular esquerda. Clin Cardiol 1995; 4: 561-70.
25. Sens S, Tarazi RC, Khairallah PA, et al. Hypertrophy in spontaneously hyperten-sive rats. Circ Res 1974; 35: 775-81.
26. Korner PI, Jennings GL. Assessment of prevalence of left ventricular hypertro-phy in hypertension. J Hypertens 1998; 16: 715-23.
27. Devereux RB, Savage DD, Sachs I. Relation of hemodynamic load to left ventri-cular hypertrophy and performance in hypertension. Am J Cardio 1997; 51: 171-6.
28. Agabiti RE, Muiesan ML. Hypertension and diastolic function. Drugs 1993; 46(suppl. 2): 61-7.
29. Marco EJ, Cianciulli T, Espinosa JH, et al. Ambulatory blood pressure monito-ring and diastolic left ventricular abnormalities in established and borderline hypertensions. Medicine (B. Aires) 1993; 53: 202-6.
References
tients with concentric remodeling and normal geometry,al-terations in diastolic function prevailed in a higher number of patients with concentric remodeling, but with no statisti-cal significance.
Analysis of blood pressure behavior on ambulatory blood pressure monitoring and the correlation of means and pressure loads with left ventricular hypertrophy have been frequent among authors 29-36.
Verdecchia et al 36, in a recent study, showed that after
adjusting for the means of 24 hours, a constant pressure overload was associated with increased left ventricular mass. Hypertension during the day, associated or not with nocturnal drop, was a determinant in left ventricular wall thickening in men. In our study, we observed a significant difference in systolic pressure load during the day in the pa-tients with concentric hypertrophy and those with concen-tric remodeling or normal geometry.
White et al 37, in a follow-up study of pressure load
du-ring the day as a determinant of cardiac function in patients with hypertension, concluded that the 2 parameters of ambu-latory blood pressure monitoring that better correlated with anatomic and functional alterations of hypertension were pressure loads and the mean blood pressure in 24 hours. Our study has also shown that patients with concentric
hy-pertension have a mean systolic pressure in 24 hours signi-ficantly higher than patients with concentric remodeling and normal geometry (p=0.003). In regard to systolic load in 24 hours, we observed no statistically significant correlation (p=0.07) when comparing the patients with concentric hy-pertrophy with those of the remaining groups.
In conclusion, the echocardiographic study of blood pressure has shown to be fundamental for clinical assess-ment of hypertensive patients, aiming to detect early left ventricular morphologic and functional alterations that in-terfere with the evolutionary process of hypertension.
The concomitant study of ambulatory blood pressure monitoring helped identify patients, who, in addition to left ventricular structural alterations, also have an increase in loads or mean pressures over 24 hours, or both. Identifying the concentric remodeling pattern and its correlation with the parameters observed on ambulatory blood pressure mo-nitoring raises the possibility of identifying a group of hy-pertensive patients at high risk for cardiovascular diseases, who usually go unnoticed by cardiologists and clinicians.
30. Verdecchia P, Schillaci G, Borgione C. White coat hypertension and white coat effect: similarities and differences. Am J Hypertens 1995; 8: 790-8.
31. Pickering TG - Ambulatory blood pressure monitoring in clinical practice. Clin Cardiol 1991; 14: 557-62.
32. Glen SK, Elliot HL. Curzio JI. White coat Hypertension as a cause of cardiovas-cular disfunction. Lancet 1996; 348: 654-7.
33. National High Blood Pressure Education Program Working Group. Report on ambulatory blood pressure monitoring. The National Blood Pressure Education Program Coordinating Committee. Arch Intern Med 1990; 150: 2270-80.
34. Sheps SG, Bailey KR, Zacharia PK. Ambulatory blood pressure monitoring. J Hum Hyperten 1994; 8: 873-8.
35. Verdecchia P, Schillaci B, Staessen J, et al. A consensus view on the technique of blood pressure monitoring. Hypertension 1995; 26: 912- 6.
36. Verdecchia P, Schillac G, Borgione C, et al. Adverse prognostic significance of concentric remodeling of the left ventricle in hypertension patients with normal left ventricular mass. J Am Coll Cardiol 1995; 25: 871-8.