Maria Jacirema Ferreira GonçalvesI
Maria Lúcia Fernandes PennaII
I Escola de Enfermagem de Manaus. Universidade Federal do Amazonas. Manaus, AM, Brasil
II Instituto de Medicina Social. Universidade do Estado do Rio de Janeiro. Rio de Janeiro, RJ, Brasil
Correspondence:
Maria Jacirema Ferreira Gonçalves Universidade Federal do Amazonas Escola de Enfermagem de Manaus R.Teresina, 495 – Adrianópolis 69057-070 Manaus, AM, Brasil E-mail: [email protected] Received: 10/25/2006
Reviewed: 6/6/2007 Approved: 7/24/2007
Tuberculosis morbidity and
effectiveness of the control
programin Brazilian
municipalities, 2001-2003
ABSTRACT
OBJECTIVE: To analyze Brazilian municipalities according to morbidity and effectiveness of epidemiological inspection control of tuberculosis and AIDS.
METHODS: Exploratory analysis of two non-hierarchical data clusters of epidemiological inspection data on tuberculosis and AIDS, and operational indicators of the Programa Nacional de Controle de Tuberculose (National Tuberculosis Control Program), from 2001 to 2003. The distribution was stratifi ed in metropolitan areas and priority municipalities, according to the size of the population. The association between morbidity clusters and effectiveness was evaluated by the Chi-square test, with analysis of residues in order to identify signifi cant associations.
RESULTS: Out of the fi ve morbidity clusters, the concerning epidemiological situation occurs in municipalities with high incidence of Aids, with high or low incidence of tuberculosis, prevailing in the Southeast and South of Brazil and larger cities. Out of the six program effectiveness clusters, moderate and average effectiveness are signifi cantly associated to priority municipalities, in metropolitan areas with more than 80 thousand inhabitants. Clusters with average and poor effectiveness represent 10% of municipalities with elevated treatment drop out and low rates of cure. The “no data” cluster is associated with the very low incidence of tuberculosis and AIDS cluster.
CONCLUSIONS: The fi ndings refl ect inadequacy of inspection concerning the epidemiological reality in Brazil: precarious social factors associated with tuberculosis and AIDS and insuffi cient effectiveness of the control program.
KEY WORDS: Tuberculosis, epidemiology. Program evaluation. Health status indicators. Epidemiologic surveillance. Brazil.
INTRODUCTION
Tuberculosis (TB) has a high incidence in Brazil, representing a social and economical burden for health because of its individual and collective harms. From 80,000 to 90,000 cases are recorded in Brazil annually, since 1980, cor-responding to an average incidence of 45.2 cases per each 100,000 inhabitants in 2003.* There is no perspective to eliminate TB due to the impact caused by the AIDS7 pandemic, which already manifests itself in Brazil as an important
TB predictor.
Brazil comprises over 5,561 municipalities, out of which 387 are in metropolitan regions and 312 have more than 80,000 inhabitants. Hence, it is necessary to analyze this great number of municipalities concerning the TB epidemiological situation and the performance of the inspection by the Programa Nacional de Con-trole da Tuberculose (National TB Control Program – PNCT).
In the 1980’s, the PNCT initiated the process of de-centralization from the federal level to the state level, expanding to the municipal level as of 1990. In 1993, the World Health Organization (WHO) declared a state of emergency on tuberculosis24 and the Ministério da Saúde (Ministry of Health – MS) defi ned the disease control plan, whose target would be the strengthening of the PNCT in municipalities. In 1996, 230 priority municipalities were chosen for the program, which concentrated 75% of estimated TB cases in Brazil. From 2000 onwards, criteria of selection were detai-led and redesigned to 315 municipalities, aiming at improving the program’s performance. The choice of priority municipalities was based on criteria of TB and AIDS epidemiological magnitude, size of population and operational information on case ins-pection.20 The PNCT directed the control policy to
these municipalities, a subgroup of about 5.7% of the Brazilian municipalities that concentrate 53% of the population.
Although there are studies on the assessment of TB control around the world,17,18 there is a lack of
informa-tion in Brazil19 and its municipalities3,8 pertaining the
performance in the PNCT. The organization of the Sis-tema Único de Saúde (National Health System – SUS) itself requires one assessment per municipality. This national and local knowledge may be used to guide and contribute to the decision-making about TB control po-licy in order to direct efforts to municipalities with gre-ater risk to the collectivity or wherever the program’s operational situation is beyond the established goals.
The analysis of the performance of municipalities in the PNCT is necessary, because the measurement by means of indicators expresses, by approximation, the program’s situation. Such method of approach may be incorporated in the assessment of the health program, which consists in a judgment of value about an interven-tion, with the goal of contributing to decision-making,2
and involving information on the characteristics, activi-ties, processes and results4 regarding the PNCT.
The objective of the present study was to analyze Brazilian municipalities according to epidemiological inspection data on TB and AIDS and the operational performance of the PNCT.
METHODS
Two non-hierarchical clusters were formed according to morbidity and performance, whose number was established by the clustergram from epidemiological inspection data on TB and AIDS and from the PNCT’s operational indicators.
The cluster analysis is exploratory6 and aims at the
description of observation units according to a
classi-fi cation generated from the data’s own behavior and not defi ned a priori.
The number of clusters was determined by the inspec-tion of the clustergram,21 where groups of morbidity
and performance indicators were gathered from one to ten clusters and diagrammed in the clustergram. The cut-off point was defi ned where two groups start showing instability in partition, blending together. The judgment occurred from the generation of classifi able and epidemiologically interpretable clusters.
Operational indicators from priority and non-priority municipalities, metropolitan and non-metropolitan regions and size of population (municipalities with over 80,000 inhabitants or not) were used, from 2001 to 2003. TB data were obtained in the database of the
Sistema de Informação de Agravos de Notifi cação do Ministério da Saúde (Ministry of Health’s System of In-formation on Notifi cation Diseases – Sinan-MS). AIDS notifi cations and population estimate were compiled from the Departamento de Informação e Informática do Sistema Único de Saúde (Department of Information and Computer Sciences - Datasus).
The variables used in the fi rst cluster (morbidity) were average rates of incidence of TB and AIDS per 100,000 inhabitants. The inclusion of AIDS in this classifi cation is justifi ed by its acknowledged association with TB,5
and by its being one of the PNCT’s criteria for
classi-fi cation of priority municipalities.20
In the second cluster (performance), the variables were: proportion of treatment dropout among new closed cases; proportion of cases notifi ed through residence municipality; proportion of cure among new cases with closure information; proportion of cases with closure information among new cases; proportion of cases in supervised treatment (Directly Observed Treatment Strategy – DOTS) among new cases; and proportion of lung cases among new cases that have performed sputum bacilloscopy at the beginning of the treatment. These are the variables traditionally used for the PNCT’s assessment, having estimated values for the states since the 1980’s.13 The program as a whole cannot
be evaluated based on one single indicator, many should be analyzed jointly.16 Therefore, it is said to be possible
The cluster analysis was accomplished in the Stata software, using a non-hierarchical method of averages
(kmeans). Clusters were defi ned based on the simi-larity among municipalities, measured by Euclidean distance among variables, discriminating more similar municipalities in the groups and more heterogeneous municipalities among groups. 1
The fi rst grouping had its process initiated from mu-nicipal units randomly defi ned as centroid (krandom),
which is more adequate for data with great variability, such as the incidence of TB and AIDS. The second grouping used random partitions in the group of municipalities (prandom); considering that variables have the same dimension and can only vary from zero to one hundred, groupings produce less discrepancy. For both cases, a seed was determined so as to enable the reproducibility of the random process. There were 2,256 municipalities that were included in the second grouping due to lack of data and, for this reason, were classifi ed in the group of missing data.
The values of indicators were treated as a population of numbers in a multidimensional space. The algorithm for cluster defi nition tried to maximize the distance among clusters in this space. The analysis considers the distri-bution of these values to classify each municipality in the closest group in the multidimensional space defi ned by the variables used.
The municipality clusters were presented on thematic maps.
To better understand the municipality classifi cation in each cluster, it was also compared: the distribution by clusters of municipalities that belonged to me-tropolitan regions or not; whether they were priority or non-priority municipalities; and, according to the size of population, whether they were municipalities with over 80,000 inhabitants or not. The Chi-square test (χ2) was used to identify association among these
municipality categories and their distribution by clus-ter, as well as the association between morbidity and performance clusters. Next, standardized residues from the contingency table were used according to Pereira;15
general chi-square indicates if the clusters distribution is dependent, and the standardized residues show the characteristic patterns of each category of each va-riable, according to the excess or lack of occurrences of its combination with each category of the other variable, enabling conclusions about the signifi cance of associations.
The signifi cance level adopted was 5% for the associa-tion among variables in the χ2 test and in the analysis
of residues. This signifi cance level for the excess of occurrences corresponds to the residue with positive value over 1.96.
RESULTS
The average incidence rate of TB among all municipa-lities was 19.19/100,000 inhabitants, and the average incidence rate of AIDS, 4.61/100,000.
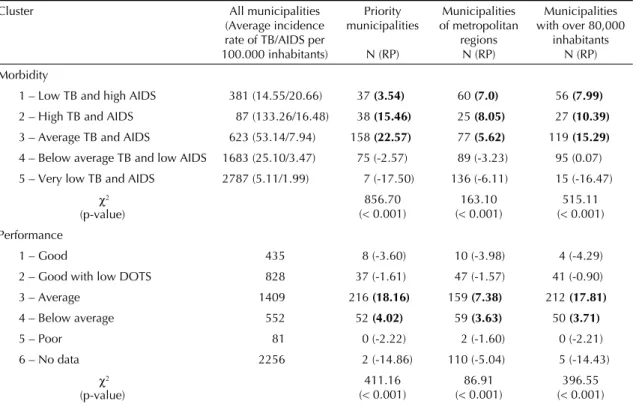
Five municipality clusters were defi ned for TB and AIDS morbidity indicators, shown on Table 1. This table shows the distributions of all municipalities in clusters and their stratifi cation by priority municipa-lities, metropolitan regions, and size of population. There was association between cluster classifi cation and the priority municipality (χ2=856.70; p<0.001),
metropolitan region (χ2=163.10; p<0.001) and size
of population variables (χ2=515.11; p<0.001). The
standardized residues show the excesses concentrated in clusters 1, 2 e 3.
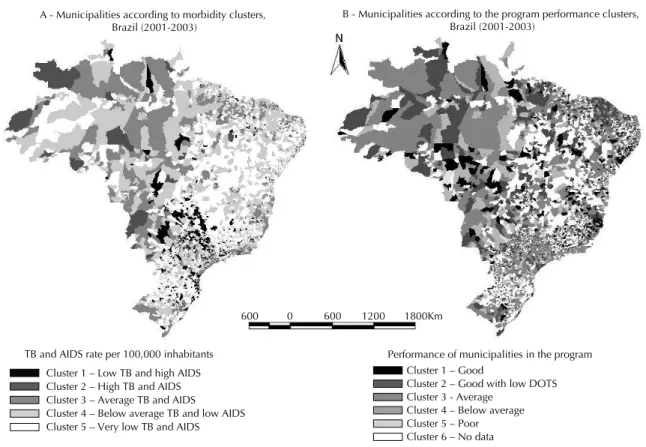
Figure 1-A shows the spatial distribution of muni-cipalities according to morbidity clusters. A greater prevalence of cluster 1 is observed in the southeast region of Brazil, especially in the state of São Paulo, and in the south of Brazil, with a prevalence in the state of Santa Catarina; cluster 2 is more expressive in the north and center-west regions; cluster 3 stands out in the north (in the states of Amazonas and Pará), and center-west regions (in the states of Mato Grosso and Mato Grosso do Sul); cluster 4 is prevalent in the northeast region (in the states of Ceará, Pernambuco, and Sergipe); and, cluster 5, in the south region, though it is also present in many municipalities of the northeast region.
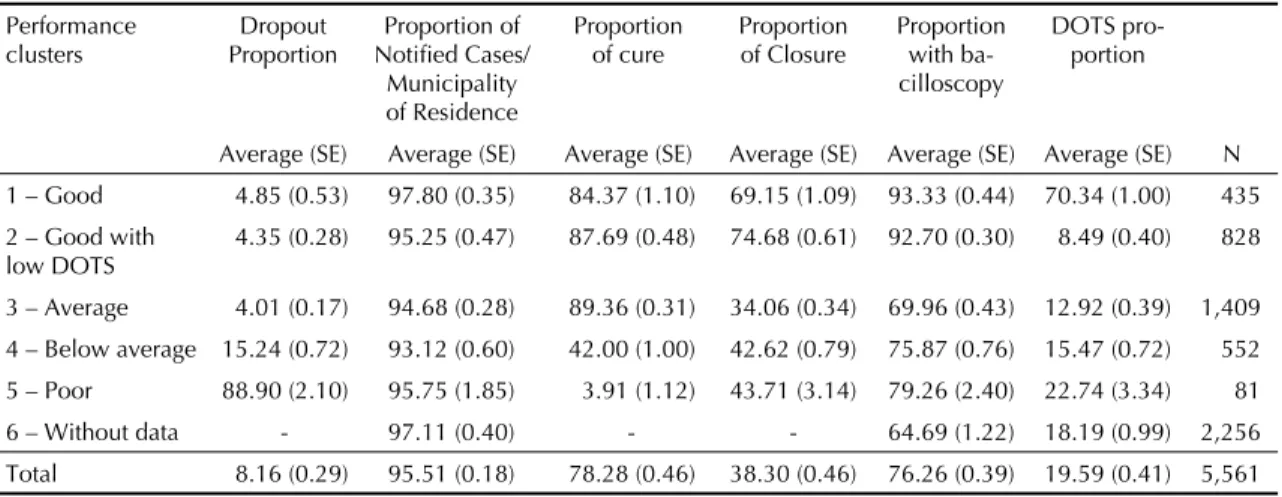
In the second grouping fi ve clusters were defi ned, in-cluding one inputted ad hoc due to the predominance of missing data, totaling six groups. Table 1 shows the number of municipalities per cluster, averages and standard-error (SE) of percentages of performance indicators. Clusters were classifi ed based on their epi-demiological characteristics, according to the averages shown in performance indicators (Table 2); cluster 1 – good, presenting low proportion of dropout, high rate of cure, high closure information, high bacilloscopy and high DOTS; cluster 2 – good, with low DOTS: differs from cluster 1 for presenting the lowest avera-ge proportion of DOTS among all clusters; cluster 3 – average, with a low proportion of dropout, elevated cure, low closure information, low bacilloscopy, and average DOTS; cluster 4 – below average, with quite elevated proportion of dropout, low rate of cure, low closure information, low bacilloscopy, and average DOTS; cluster 5 – poor, showing very high dropout rate, very low rate of cure, low closure information, low bacilloscopy, and average DOTS; cluster 6 – no data due to lack of data in all performance indicators, or only in indicators of treatment result.
municipa-Table 3 shows the distribution of PNCT performance and morbidity clusters, with statistically signifi cant differences (χ2=1,924, p<0.001), indicating that the
PNCT’s performance and morbidity are dependent. The analysis of standardized residues allowed to cha-racterize the signifi cant associations, as it is shown on Table 3, where the residues with positive value over 1.96 are highlighted in bold, corresponding to the signifi cance level for the excess of occurrences among the categories.
DISCUSSION
Data were analyzed, considering the limitations of a uniquely ecological study with secondary data. Stu-dies based on secondary data refl ect the defi ciencies of the information systems that generate them, which may result in the inclusion of biased information and false conclusions. In this study, the lack of information itself was incorporated under the aspect of operational indicator, whose interpretation of results took into account the possibility of sub-registry of cases. It was also taken into account the fact that the assessment only with the result and process components excludes the aspect of program structure; though not compromising the judgment of the analysis results.
lities with over 80,000 inhabitants (Table 1) shows that these variables are not independent (p<0.001). Out of 315 priority municipalities, most of them (216) have an average performance classifi cation, followed by below average (52 municipalities). In metropolitan regions, 159 are average and 59 are in the below average clus-ter. Furthermore, out of the 312 municipalities with more than 80,000 inhabitants, there is also a higher number of municipalities in the average cluster (212 municipalities), followed by the below average cluster, with 50 municipalities. The analysis of standardized residues (Table 1) characterizes average to below average clusters as signifi cant; average performance cluster was the one with the greatest importance in the association.
The mapping of performance clusters is shown on Figure 1-B, where it can be observed that cluster 1 is more apparent in the center-west region of Brazil, on the northeast coast and in the state of Minas Gerais; cluster 2 is expressive in Ceará and in the southeast region, especially in the state of São Paulo; cluster 3 is abundant in the north and southeast regions; clusters 4 and 5 are scattered across the whole map; and cluster 6 is expressive in the countryside of the northeast region and in the south of Brazil.
Figure. Spatial Distribution of tuberculosis and AIDS morbidity clusters (A) and performance (B) in municipalities. Brazil, 2001–2003.
Source: Sistema de Informação de Agravos de Notifi cação do Ministério da Saúde (Health Ministry’s Information System on Notifi cation Diseases - Sinan)
Cluster 1 – Low TB and high AIDS Cluster 2 – High TB and AIDS Cluster 3 – Average TB and AIDS Cluster 4 – Below average TB and low AIDS Cluster 5 – Very low TB and AIDS
Cluster 1 – Good
Cluster 2 – Good with low DOTS Cluster 3 - Average
Cluster 4 – Below average Cluster 5 – Poor Cluster 6 – No data
TB and AIDS rate per 100,000 inhabitants Performance of municipalities in the program A - Municipalities according to morbidity clusters,
Brazil (2001-2003)
B - Municipalities according to the program performance clusters, Brazil (2001-2003)
From the PNCT’s epidemiological and operational as-sessment perspective, the classifi cation in interpretable clusters enables the detection of risks and operational problems across the country. This strategy differs from the restrict assessment and action in a small subgroup of municipalities, with an important proportion of number of notifi ed cases and national population. The structure of the SUS under municipal administration imposes assessment strategies on municipal health departments in relation to the planning and evaluation of their activities. When the SUS, on a national basis, has the responsibi-lity of giving an answer to each of the 5,561 Brazilian municipalities, the most productive approach is that of exploratory analysis, which is not of a statistic nature, nor does it seek to discuss determinations or causality. Therefore, this analysis does not take into account either the variance of dependent indicators of the municipal population size, or the determination of the phenomena studied (association between morbidity and socio-econo-mic factors or the age distribution of the population).
Results discriminated Brazilian municipalities well, enabling the PNCT’s diagnosis in these locations and raising possible explanations for the situation of the program in Brazil.
The fi rst morbidity cluster has the risk of increasing TB incidence, because AIDS is the most powerful, well-known factor for the development of TB.5,22 In
municipalities where both diseases have high incidence rates, there is epidemiological gravity, offering a greater risk to the population due to the presence of an infec-tion source, as well as a greater demand for inspecinfec-tion actions by healthcare services.
On the other hand, in cluster 5 – very low TB and AIDS – it is suggested the possibility that this is a mixture of municipalities with bad quality inspection with those who really have low TB and AIDS, leading to the supposition that the identifi ed rate is possibly being underestimated. This is corroborated by the existence of a great proportion of municipalities with poor per-formance and with no data, and in this last case the association is more important.
It was observed that there are municipalities with good performance, regardless of DOTS implementation. Moreover, the elevated proportion of patients treated with this strategy is present in small municipalities, non-priority and not belonging to metropolitan regions. The municipalities classifi ed as good with low DOTS
Table 1. Distribution of municipalities in tuberculosis morbidity and performance clusters, according to priority municipali-ties and metropolitan regions with over 80,000 inhabitants. Brazil, 2001-2003.
Cluster All municipalities
(Average incidence rate of TB/AIDS per 100.000 inhabitants)
Priority municipalities
N (RP)
Municipalities of metropolitan
regions N (RP)
Municipalities with over 80,000
inhabitants N (RP)
Morbidity
1 – Low TB and high AIDS 381 (14.55/20.66) 37 (3.54) 60 (7.0) 56 (7.99)
2 – High TB and AIDS 87 (133.26/16.48) 38 (15.46) 25 (8.05) 27 (10.39)
3 – Average TB and AIDS 623 (53.14/7.94) 158 (22.57) 77 (5.62) 119 (15.29)
4 – Below average TB and low AIDS 1683 (25.10/3.47) 75 (-2.57) 89 (-3.23) 95 (0.07)
5 – Very low TB and AIDS 2787 (5.11/1.99) 7 (-17.50) 136 (-6.11) 15 (-16.47)
χ2 (p-value)
856.70 (< 0.001)
163.10 (< 0.001)
515.11 (< 0.001)
Performance
1 – Good 435 8 (-3.60) 10 (-3.98) 4 (-4.29)
2 – Good with low DOTS 828 37 (-1.61) 47 (-1.57) 41 (-0.90)
3 – Average 1409 216 (18.16) 159 (7.38) 212 (17.81)
4 – Below average 552 52 (4.02) 59 (3.63) 50 (3.71)
5 – Poor 81 0 (-2.22) 2 (-1.60) 0 (-2.21)
6 – No data 2256 2 (-14.86) 110 (-5.04) 5 (-14.43)
χ2 (p-value)
411.16 (< 0.001)
86.91 (< 0.001)
396.55 (< 0.001)
Source: Sistema de Informação de Agravos de Notifi cação do Ministério da Saúde (Ministry of Health’s System of Informa-tion on Notifi caInforma-tion Diseases – Sinan)
RP = Standardized residues
Observation: Residues with positive values over 1.96 are marked in bold, corresponding to the signifi cance level for the excess of occurrences among categories.
have the lowest average of DOTS proportion (8.5%) among all clusters, even inferior to Brazil’s national average (19.6%). Without a doubt, there is TB control program working with good performance, regardless of the adoption of the DOTS. This is the only difference between performance clusters 1 and 2, which, except for the outcome proportion, can reach the minimum required for the good functioning of the program.
In 1998, the DOTS strategy was introduced in the PNCT, and in 1999 it was present in 288 municipali-ties.19 After fi ve years, it was pointed out as a reality not
consolidated in Brazil. The DOTS average proportion in Brazil is only 20%, arousing the need to assess the rea-sons for its restricted adoption, as it has a positive im-pact on TB control in other countries.10,18 The adoption
of this strategy has been recommended in some studies in Brazil.9,12 Among explanatory hypotheses that must
be evaluated, the following stand out: obstacles to the uniformity and guidance of the national policy of imple-mentation, use and assessment of the DOTS; obstacles to the strategy implementation, especially in large municipalities; capacity of administrators; diffi culties
Table 2. Average of indicators according to performance clusters of the Programa de Nacional Controle da Tuberculose
(National Program of Tuberculosis Control), 2001-2003. Performance
clusters
Dropout Proportion
Proportion of Notifi ed Cases/ Municipality of Residence
Proportion of cure
Proportion of Closure
Proportion with ba-cilloscopy
DOTS pro-portion
Average (SE) Average (SE) Average (SE) Average (SE) Average (SE) Average (SE) N
1 – Good 4.85 (0.53) 97.80 (0.35) 84.37 (1.10) 69.15 (1.09) 93.33 (0.44) 70.34 (1.00) 435
2 – Good with low DOTS
4.35 (0.28) 95.25 (0.47) 87.69 (0.48) 74.68 (0.61) 92.70 (0.30) 8.49 (0.40) 828
3 – Average 4.01 (0.17) 94.68 (0.28) 89.36 (0.31) 34.06 (0.34) 69.96 (0.43) 12.92 (0.39) 1,409
4 – Below average 15.24 (0.72) 93.12 (0.60) 42.00 (1.00) 42.62 (0.79) 75.87 (0.76) 15.47 (0.72) 552
5 – Poor 88.90 (2.10) 95.75 (1.85) 3.91 (1.12) 43.71 (3.14) 79.26 (2.40) 22.74 (3.34) 81
6 – Without data - 97.11 (0.40) - - 64.69 (1.22) 18.19 (0.99) 2,256
Total 8.16 (0.29) 95.51 (0.18) 78.28 (0.46) 38.30 (0.46) 76.26 (0.39) 19.59 (0.41) 5,561
Source: Sinan SE: Standard-Error
Table 3. Distribution of performance and morbidity clusters of the Programa Nacional de Controle da Tuberculose (National Program of Tuberculosis Control), according to number, percentage and standardized residue, Brazil – 2001-2003.
Morbidity Clusters
Performance Clusters 1 – Good
N (%) RP
2 – Good with low DOTS
N (%) RP
3 – Average N (%) RP
4 – Below average N (%) RP
5 – Poor N (%) RP
6 – Without Data N (%) RP
Total N (%) 1. Low TB
and high AIDS
10 (2.6) -3.91 64 (16.8) 1.08 128 (33.6) 3.84 50 (13.1) 2.17 5 (1.3) -0.24 124 (32.6) -3.30 381 (100)
2. High TB and AIDS
2 (2.3) -1.93 15 (17.2) 0.62 45 (51.7) 5.70 21 (24.1) 4.47 1 (1.2) -0.24 3 (3.5) -7.10 87 (100)
3. Average TB and AIDS
43 (6.9) -0.91 132(21.2) 4.69 314 (50.4) 15.26 96 (15.4) 4.86 5 (0.8) -1.44 33 (5.3) -19.03 623 (100)
4. Below average TB and AIDS
181(10.8) 5.36 349(20.7) 8.07 667 (39.6) 16.14 236 (14.0) 6.73 31 (1.8) 1.58 219(13.0) -27.57 1,683(100)
5. Very low TB and AIDS
199(7.1) -1.90 268(9.6) -11.07 255 (9.2) -27.82 149 (5.4) -11.45 39(1.4) -0.36 1,877(67.4) 40.77 2,787(100)
Total N (%) 435 (7.8) 828 (14.9) 1,409 (25.3) 552 (9.9) 81 (1.5) 2,256 (40.6) 5,561(100)
Source: Sinan
RP = Standardized residues
Observation: Residues with positive values over 1.96 are marked in bold, corresponding to the signifi cance level for the excess of occurrences among categories.
to get the resources for its implementation. How well the DOTS can be executed in metropolitan regions is something that should be questioned; regions where the-re athe-re long distances and patients athe-re not excused from work daily in order to receive supervised treatment. Therefore, issues related to the patients should also be considered when having the DOTS in mind.23
In the group formed by average, below average and poor performances, 37% of municipalities were classifi ed in these clusters, whose mapping does not show a regional pattern of agglomeration, indicating that the pheno-menon happens throughout Brazil indistinctly. These municipalities correspond to 59.8% of TB notifi ed cases and 74% of the Brazilian population.
As the proportion of large and priority municipalities is predominant in the average performance, the relation between resources to the SUS and the priority designa-ted to this group of municipalities in the last ten years stands out. It is observed that the main problem is the outcome information of cases, which is smaller in all clusters. Furthermore, the proportion of cases that had sputum bacilloscopy does not reach 70%, and, as it seems, the DOTS is not a priority in these locations. Standardized residues indicate their importance in priority municipalities, metropolitan regions, and those with more than 80,000 inhabitants.
It is possible that the low outcome information reveals problems of completion of data, because the proportion of cure is high. Nevertheless, the bacilloscopy propor-tion indicates problems that are beyond the informapropor-tion system. It is possible that TB patients are being treated without meeting the rules of the program. The study of other indicators, such as those regarding the program structure, might contribute to discriminate the situation of municipalities with average performance.
The PNCT’s worst situation is evident in cluster 6 – with no data, with a higher incidence in small mu-nicipalities. This information arouses the necessity for attention to these municipalities, which present the lowest program operational capacity and, therefore, need to have its program reinforced.
The association of very low morbidity of TB and AIDS with performance in the cluster with no data (Table 3) shows strong connection, according to standardized residues. This points to notifi cation problems as well as the capacity of municipalities to follow cases being treated, as the situation of missing data is concentrated in the majority of them.
It was observed that clusters of greater risk morbidi-ty (low TB and high AIDS, and high TB and AIDS
– clusters 1 and 2) are strongly associated to average and below average performances (clusters 3 and 4), revealing inadequacy of inspection actions towards the epidemiological reality. For the problem under study, less morbidity is not necessarily due to the program’s good performance, unlike what happens in immuno-preventive diseases. For these, the result of decrease in morbidity evidences adequate performance in the execution of immunization.
Epidemiological inspection has the role of recom-mending and implementing actions that lead to the prevention and control of the disease. It should take into consideration the fact that morbidity by transmissible diseases is heavily infl uenced by the operational process of healthcare services.14
The cluster with below average performance is asso-ciated to priority municipalities, metropolitan regions and those with more than 80,000 inhabitants, as well as to almost all other morbidity clusters, except for too low TB and AIDS. A high dropout average pro-portion (15.2%), greater than the national average (8.16%), is observed in this cluster. However, the
Ministério da Saúde (Ministry of Health) considers a dropout rate below 5% as an adequate assessment of the program.* The decrease in treatment dropout is an important goal for the program, considered to be one of the most serious problems concerning TB control. That is because it involves the persistence of infection source, the increase in mortality and relapse rates, be-sides promoting the development of resistant bacillus strains.11
The present analysis shows that the PNCT is not ade-quate to either the small municipalities or the priority ones. Although the priority ones receive more input, they respond unsatisfactorily to the program’s inspec-tion needs.
The assistance to TB patients by a specifi c doctor makes the program’s effi ciency unfeasible in small municipalities, something that can explain the great proportion of poor and no data clusters. Nonetheless, clusters with good and good with low DOTS consist of small municipalities (431 and 787 municipalities respectively). It is possible that the DOTS strategy in these regions is more effective, considering that it can use all healthcare staff in its implementation. In addi-tion, the greater integration of the entire TB program in the primary attention to health makes it possible to deal with the TB problem as a whole and, consequently, improve the actions of the program.
A deepened analysis with a qualitative approach in performance clusters 1 and 2, focused on municipalities
with different sizes of population, might propitiate the identifi cation of the conditioning factors for the PNCT’s good performance in these regions. The qualitative analysis will make it possible to identify what causes municipalities in clusters 1 and 2 to have a good perfor-mance, even without using the DOTS and vice-versa. In this manner, federal recommendations can be adopted, contributing to the improvement of municipalities with inadequate performance.
Regional differences express the reality of states and municipalities. Those are extremely serious situations, represented by extremely high incidence rate of TB
and explained by precarious social factors associated to TB and AIDS and by insuffi cient intervention of the control program.
1 Carvalho MS, Cruz OG, Nobre FF. Perfi l de risco: método multivariado de classifi cação sócio-econômica de microáreas urbanas - os setores censitários da
região metropolitana do Rio de Janeiro. Cad Saude
Publica. 1997;13(4):635-45.
2. Contandriopoulos AP, Champagne F, Denis JL, Avargues MC. L’évaluation dans le domaine de la
santé: concepts et méthodes. RevÉpidémiol Santé
Publique. 2000; 48(6):517-39.
3 Costa JSD, Gonçalves H, Menezes AMB, Devens E, Piva M, Gomes M, et al. Controle epidemiológico da tuberculose na cidade de Pelotas, Rio Grande do
Sul, Brasil: adesão ao tratamento. Cad Saude Publica.
1998;14(2):409-15.
4 Donabedian A. Evaluating the quality of medical care.
1966. Milbank Q. 2005;83(4):691-729.
5 Frieden TR, Sterling TR, Munsiff SS, Watt CJ, Dye C.
Tuberculosis. Lancet. 2003;362(9387):887-99.
6 Hair JFJ, Anderson RE, Tatham RL, Black WC. Multivariate data analysis. Saddle River: Prentice Hall; 1995.
7 Lillebaek T, Andersen AB, Dirksen A, Smith E, Skovgaard LT, Kok-Jensen A. Persistent high incidence of tuberculosis in immigrants in a low-incidence
country. Emerg Infect Dis. 2002;8(7):679-84.
8 Menezes AMB, Costa JD, Gonçalves H, Morris S, Menezes M, Lemos S, et al. Incidência e fatores de risco para tuberculose em Pelotas, uma cidade do sul
do Brasil. Rev Bras Epidemiol. 1998;1(1):50-53.
9 Mota FF, Vieira-da-Silva LM, Paim JS, Costa MC. Distribuição espacial da mortalidade por tuberculose
em Salvador, Bahia, Brasil. Cad Saude Publica.
2003;19(4):915-22.
10 Murray CJ, Salomon JA. Modeling the impact of global
tuberculosis control strategies. Proc Natl Acad Sci USA.
1998;95(23):13881-6.
11 Natal S, Valente J, Gerhardt G, Penna MLF. Modelo de predição para o abandono do tratamento
da tuberculose pulmonar. Bol Pneumol Sanit.
1999;7(1):65-78.
12 Oliveira HB, Moreira Filho DC. Abandono de tratamento e recidiva da tuberculose: aspectos de
episódios prévios, Campinas, SP, Brasil, 1993-1994.
Rev Saude Publica. 2000;34(5):437-43.
13 Penna MLF. Estratégias de controle da tuberculose:
da descoberta do bacilo aos nossos dias. Cad IMS.
1988;2(2):117-46.
14 Penna MLF, Faerstein E. Coleta de dados ou sistema de informação? O método epidemiológico na avaliação
dos serviços de saúde. Cad IMS. 1987;1(2):68-78.
15 Pereira JCR. Análise de dados qualitativos: estratégias metodológicas para ciências da saúde, humanas e sociais. São Paulo: EDUSP; 2004.
16 Pio A, Chaulet P. Tuberculosis Handbook. Geneva; 1998. (WHO/TB/98.253).
17 Raviglione MC, Dye C, Schmidt S, Kochi A. Assessment of worldwide tuberculosis control. WHO
Global Surveillance and Monitoring Project. Lancet.
1997;350(9078):624-9.
18 Raviglione MC, Pio A. Evolution of WHO policies
for tuberculosis control, 1948-2001. Lancet.
2002;359(9308):775-80.
19 Ruffi no-Netto A. Impacto da reforma do setor saúde
sobre os serviços de tuberculose no Brasil. Bol
Pneumol Sanit. 1999;7(1):7-18.
20 Ruffi no-Netto A. Tuberculose: a calamidade
negligenciada. Rev Soc Bras Med Trop.
2002;35(1):51-8.
21 Schonlau M. The clustergram: A graph for visualizing hierarchical and non-hierarchical cluster analyses.
Stata J. 2002;2(4):391-402.
22 Toledo ACC, Greco DB, Antunes CM. Risk factors for tuberculosis among human immunodefi ciency virus-infected persons. A case-control study in Belo
Horizonte, Minas Gerais, Brazil (1985-1996). Mem
Inst Oswaldo Cruz. 2000;95(4):437-43.
23 Vendramini SHF, Villa TCS, Palha PF, Monroe AA. Tratamento supervisionado no controle da tuberculose em uma unidade de saúde de Ribeirão
Preto: a percepção do doente. Bol Pneumol Sanit.
2002;10(1):2-12.
24 World Health Organization. The Global Plan to Stop TB 2006–2015: actions for life toward a world free of tuberculosis. Geneva; 2006.
REFERENCES
MJF Gonçalves was supported by the Fundação de Amparo à Pesquisa do Estado do Amazonas (Fapeam – Process 008/2004; doctoral scholarship).