Use of and access to health services in
Brazil, 2013 National Health Survey
Sheila Rizzato StopaI, Deborah Carvalho MaltaII, Camila Nascimento MonteiroIII, Célia Landmann SzwarcwaldIV, Moisés GoldbaumV, Chester Luiz Galvão CesarVI
I Programa de Pós-Graduação em Saúde Pública. Faculdade de Saúde Pública. Universidade de São Paulo.
São Paulo, SP, Brasil
II Departamento de Enfermagem Materno Infantil e Saúde Pública. Escola de Enfermagem. Universidade Federal
de Minas Gerais. Belo Horizonte, MG, Brasil
III Núcleo de Indicadores e Sistemas de Informação. Hospital Israelita Albert Einstein. São Paulo, SP, Brasil IV Instituto de Comunicação e Informação Científica e Tecnológica em Saúde. Fundação Oswaldo Cruz.
Rio de Janeiro, RJ, Brasil
V Departamento de Medicina Preventiva. Faculdade de Medicina. Universidade de São Paulo. São Paulo, SP, Brasil VI Departamento de Epidemiologia. Faculdade de Saúde Pública. Universidade de São Paulo. São Paulo, SP, Brasil
ABSTRACT
OBJECTIVE: To analyze the use of health services in the Brazilian population by sociodemographic factors, according to data from the 2013 Brazilian National Health Survey.
METHODS: he study analyzed data from 205,000 Brazilian citizens in all age groups who participated in the Brazilian National Health Survey, a cross-sectional study carried out in 2013. Prevalence and conidence intervals were estimated for indicators related to access to and use of health services according to age group, level of education of head of household, and Brazilian macroregions.
RESULTS: Among individuals who sought health services in the two weeks prior to the survey, 95.3% (95%CI 94.9–95.8) received care in their irst visit. Percentages were higher in the following groups: 60 years of age and over; head of household with complete tertiary education; living in the South and Southeast regions. In addition, 82.5% (95%CI 81.2–83.7) of individuals who received health care and prescriptions were able to obtain all the necessary medicines, 1/3 of them from SUS. Less than half the Brazilian population (44.4%; 95%CI 43.8–45.1) visited a dentist in the 12 months prior to the survey, with smaller percentages among the following groups: 60 years of age or older; head of household with no education or up to incomplete elementary; living in the North region of Brazil.
CONCLUSIONS: People living in the South and Southeast regions still have greater access to health services, as do those whose head of household has a higher level of education. he (re) formulation of health policies to reduce disparities should consider diferences encountered between regions and social levels.
DESCRIPTORS: Health Services, supply & distribution. Health Services Accessibility. Equity in Access. Socioeconomic Factors. Health Surveys.
Correspondence: Sheila Rizzato Stopa
Departamento de Epidemiologia, FSP-USP
Av. Dr. Arnaldo, 715
01246-904 São Paulo, SP, Brasil E-mail: [email protected]
Received: 14 Jun 2016 Approved: 1 Sep 2016
How to cite: Stopa SR, Malta DC, Monteiro CN, Szwarcwald CL, Goldbaum M, Galvão Cesar CL. Use of and access to health services in Brazil, 2013 National Health Survey. Rev Saude Publica. 2017;51 Suppl 1:3s.
Copyright: This is an open-access article distributed under the terms of the Creative Commons Attribution License, which permits unrestricted use, distribution, and reproduction in any medium, provided that the original author and source are credited.
INTRODUCTION
he use of health services results from several interacting factors, such as how users perceive them and their need and to what extent they are available1,2. Various conditions are associated
with the ofer of such services. Geographical accessibility and sociocultural and economic factors, for example, play an essential role in the demand for health services.3,4
he use of health services is determined by a need perceived by users based on their health situation and previous knowledge of the disease or condition, which in turn is inluenced by sociodemographic factors2,3.
Access to health services also relects existing inequalities and vulnerabilities among society, produced within the social framework. It is the state’s duty to ensure the principle of equity of the Brazilian Uniied Health System (SUS), guaranteed by the Constitution, to ofset the inequalities produced at social level3,4.
Population-based studies that address the use of health services are key to describing frequencies and trends. he indings of such studies lead to knowledge of access to and use of services in a given population, providing support for the planning and (re)formulation and management of health policies2,5.
Since the 1980s, the Brazilian National Household Survey Sample (PNAD) has been surveying the use of health services in its health supplements. However, these supplements have only been published regularly every ive years since 1998. hey have addressed access to and use of health services, self-reported morbidity, health plan coverage, health costs, and lifestyle5. One of the objectives of the 2013 Brazilian National Health Survey (PNS) was to continue the work of the PNAD health supplements, but addressing a wider range of topics. PNS is a component of the Integrated Household Surveys System (SIPD) and is independent of the continuous PNAD, that is, it has its own design and was conceived to collect health information6. he second volume of PNS data allowed the monitoring of indicators of access
to and use of health service addressed in previous PNAD supplements.a
his study aimed to analyze the use of health services in the Brazilian population by sociodemographic factors, according to data from the 2013 PNS.
METHODS
his study analyzed data from the 2013 PNS, a population-based household survey conducted in Brazil by the Brazilian Institute of Geography and Statistics (IBGE), in partnership with the Brazilian Ministry of Health.
Cluster sampling was used in three selection stages. In the irst stage, we stratiied the primary sampling units composed of census tracts, using simple random selection. In the second stage, we randomly selected 10 to 14 households in each primary sampling unit. In the third stage, an adult was selected with equiprobability among all adults resident in the household. he census tracts used in the PNS were drawn from the IBGE SIPD, using the Master Sample of that system, with a wider geographical scope and gain in estimate precisiona.
he estimated PNS sample size was approximately 81,000 households, with 81,254 households selected to compose the sample. Of these, 69,994 were occupied and home interviews were carried out in 64,348 of them. A total of 60,202 individual interviews was performed with selected adults in the households. he loss rate was 20.8% for home interviews and 25.9% for individual interviews. he PNS sample was planned considering the precision level desired for some estimates of speciic indicators of interest. his strategy allowed the estimation of parameters at diferent geographical levels: federative units, capitals, metropolitan areas and the remaining federative unitsa.
a Instituto Brasileiro de Geografia
Sample weights were deined for the primary sampling units, households and all residents, as well as for the selected resident. he latter was estimated considering the weight of the corresponding household, the probability of selection, adjustments for non-response per gender, and calibration by population totals by gender and age groups. Details on the sampling process, weighting factors, collection and other information can be found in the oicial publication with the PNS resultsa.
Information on access to and use of health services was obtained using data related to all household residents. hus, PNS collected information for 205,000 residents, representing 200.6 million Braziliansa.
he study analyzed PNS data related to access to and use of health services according to whether users:
1. Did not perform their normal activities for health reasons in the two weeks prior to the survey;
2. Usually seek the same facility, doctor or health service when in need of health care;
3. Visited a doctor in the last 12 months;
4. Visited a dentist in the last 12 months;
5. Sought health care in the two weeks prior to the survey;
a. ... and received health care in their irst visit;
b. ... and received health care;
6. Sought health care in the two weeks prior to the survey and were prescribed medication;
7. Obtained all medicines prescribed in the last visit;
8. Obtained at least one of the medicines prescribed in the last visit;
9. Obtained at least one of the medicines prescribed in the last visit from the Popular Pharmacy Program (PFP);
10. Obtained at least one of the medicines prescribed in the last visit from the public health service;
11. Were hospitalized for 24 hours or more in the 12 months prior to the survey;
a. ... by SUS, and rated the service received as good or very good;
b. ... and the last hospitalization was by SUS.
Prevalence and conidence intervals of 95% (95%CI) were estimated and stratiied by age group (0–17; 18–29; 30–39; 40–59; 60 or over), level of education of head of household (no education and incomplete elementary; complete elementary and incomplete secondary; complete secondary and incomplete tertiary; complete tertiary), Brazilian macroregion (North, Northeast, Southeast, South, and Center-West) and Brazil. he diferences were considered signiicant when no overlap between conidence intervals was identiied.
Data analysis was performed with Stata software version 11.0, using the survey module, which considers efects of complex sampling. he PNS was approved by the National Research Ethics Committee (Protocol 328,159, of June 26, 2013). All interviewees were consulted, informed and accepted to participate in the research.
RESULTS
or health service, and 44.4% visited a dentist in the last 12 months. In addition, among the 15.3% who reported having sought the health service in the two weeks prior to the survey, 95.3% received health care in their irst visit.
Regarding age groups, the study identiied diferences in several indicators, with the highest percentages in the group aged 60 years or over for the following indicators: not performing normal activities for health reasons in the two weeks prior to the survey (11.5%), visiting a doctor in the last 12 months (83.5%), seeking health care in the two weeks prior to the survey (25.0%), obtaining at least one of the medicines prescribed in the last visit from the PFP (30.3%) (Table 1). he younger age groups, on the other hand, showed higher percentages than the oldest one regarding visiting a dentist in the last 12 months (51.0% for ages 18–29 and 28.9% for 60 years or over) and being hospitalized for 24 hours or more, with the last hospitalization by SUS (75.2% for ages 0–17 and 61.8% for 60 years or over). he other indicators were similar between the age groups (Table 1).
Table 1. Indicators of access to and use of health services by age group. 2013 National Health Survey.
Indicator
Total
Age Group
0–17 18–29 30–39 40–59 60 or over
% 95CI% % 95CI% % 95CI% % 95CI% % 95CI% % 95CI%
Did not perform normal activities for health reasons in the two weeks prior to the survey
7.0 6.8–7.2 5.6 5.2–5.9 4.6 4.2–4.9 6.0 5.6–6.4 8.7 8.3–9.1 11.5 10.8–12.2
Usually seeks the same facility, doctor or health service when in need of health care
77.8 77.0–78.6 79.9 79.0–80.9 75.6 74.6–76.7 76.4 75.3–77.5 77.3 76.4–78.3 79.3 78.2–80.4
Visited a doctor in the
last 12 months 71.2 70.7–71.7 69.8 69.0–70.6 64.1 63.1–65.1 68.4 67.4–69.4 73.5 72.8–74.3 83.5 82.8–84.2 Visited a dentist in the
last 12 months 44.4 43.8–45.1 45.2 44.3–46.1 51.0 50.1–52.0 50.4 49.3–51.5 42.9 41.9–43.9 28.9 27.6–30.1 Sought health care in the two
weeks prior to the survey 15.3 15.0–15.7 11.9 11.3–12.4 11.4 10.9–12.0 13.7 13.0–14.4 18.0 17.4–18.6 25.0 24.0–25.9 ... and received care in the
first visit 95.3 94.9–95.8 95.7 94.9–96.5 94.0 92.8–95.1 94.9 93.8–95.9 95.1 94.3–95.8 96.6 95.8–97.3 ... and received care 97.0 96.6–97.4 97.6 96.9–98.2 96.3 95.4–97.2 96.5 95.5–97.4 96.6 96.0–97.3 97.8 97.2–98.4 Received health care in the last
two weeks, with prescribed medicines
64.8 63.8–65.9 69.2 67.2–71.3 59.8 57.4–62.3 61.1 58.7–63.5 64.1 62.3–65.9 67.3 65.2–69.4
Obtained all medicines prescribed in the last health care visit
82.5 81.2–83.7 81.6 79.1–84.1 84.0 81.7–86.4 81.5 79.0–84.0 82.7 81.0–84.5 82.6 80.3–84.8
Obtained at least one medicine prescribed in the last health care visit
92.4 91.7–93.1 91.3 89.7–92.8 93.1 91.7–94.4 90.0 88.1–91.8 92.7 91.5–93.9 94.4 93.2–95.5
Obtained at least one medicine prescribed in the last health care visit from the Popular Pharmacy Program
21.9 20.5–23.4 16.2 13.7–18.7 16.8 14.1–19.5 14.9 12.6–17.1 25.5 23.4–27.6 30.3 27.7–32.8
Obtained at least one medicine prescribed in the last health care visit from the public health system
33.2 31.6–34.7 32.4 29.5–35.3 29.2 26.1–32.2 28.6 25.7–31.5 34.4 32.0–36.8 37.4 34.5–40.2
Was hospitalized for 24 hours or more in the 12 months prior to the survey
6.0 5.8–6.3 4.5 4.2–4.8 5.5 5.1–5.8 5.9 5.5–6.4 6.0 5.6–6.4 10.2 9.6–10.9
... by the Brazilian Unified Health System (SUS) and ranked the service as good or very good
82.4 80.9–83.9 80.5 77.6–83.5 79.7 76.4–82.9 81.3 78.0–84.6 84.2 81.7–86.6 85.5 82.7–88.2
... and the last hospitalization was by the Brazilian Unified Health System (SUS)
Table 2. Indicators of access to and use of health services by level of education. 2013 National Health Survey.
Indicator
Total
Level of education of head of household
No education or incomplete elementary
Complete elementary or incomplete
secondary
Complete secondary or incomplete
tertiary
Complete tertiary
% 95CI% % 95CI% % 95CI% % 95CI% % 95CI%
Did not perform normal activities for health reasons in the two weeks prior to the survey
7.0 6.8–7.2 7.8 7.5–8.1 6.5 6.1–7.0 6.2 5.8–6.5 6.3 5.8–6.9
Usually seeks the same facility, doctor or health service when in need of health care
77.8 77.0–78.6 78.7 77.6–79.8 76.3 74.8–77.9 76.3 75.0–77.5 79.5 77.9–81.1
Visited a doctor in
the last 12 months 71.2 70.7–71.7 67.1 66.4–67.9 70.8 69.6–71.9 74.3 73.5–75.2 81.0 79.9–82.2
Visited a dentist in
the last 12 months 44.4 43.8–45.1 34.1 33.4–34.9 44.6 43.1–46.0 53.0 52.0–54.1 65.8 64.2–67.3
Sought health care in the two
weeks prior to the survey 15.3 15.0–15.7 14.9 14.4–15.4 14.1 13.2–14.9 15.5 14.9–16.1 18.1 17.1–19.2
... and received care in
the first visit 95.3 94.9–95.8 94.5 93.8–95.2 94.6 93.4–95.7 95.9 95.1–96.7 97.7 96.9–98.4
... and received care 97.0 96.6–97.4 96.4 95.7–97.0 96.4 95.5–97.4 97.5 96.8–98.2 98.8 98.3–99.4
Received health care in the last two
weeks, with prescribed medicines 64.8 63.8–65.9 67.2 65.7–68.8 64.7 61.9–67.4 62.9 60.9–64.8 61.2 58.2–64.2
Obtained all medicines prescribed
in the last health care visit 82.5 81.2–83.7 79.8 78.0–81.7 82.3 79.6–85.1 83.8 81.8–85.7 89.3 86.7–91.9
Obtained at least one medicine
prescribed in the last health care visit 92.4 91.7–93.1 92.1 91.1–93.1 92.2 90.4–94.1 92.4 91.1–93.7 94.1 92.1–96.1
Obtained at least one medicine prescribed in the last health care visit from the Popular Pharmacy Program
21.9 20.5–23.4 26.5 24.3–28.6 21.9 18.7–25.1 19.5 17.3–21.8 10.8 8.4–13.2
Obtained at least one medicine prescribed in the last health care visit from the public health system
33.2 31.6–34.7 42.8 40.5–45.1 34.3 30.9–37.8 25.1 22.8–27.5 13.9 11.3–16.6
Was hospitalized for 24 hours or more in the 12 months prior to the survey
6.0 5.8–6.3 6.1 5.8–6.4 6.3 5.6–7.0 5.6 5.3–6.0 6.4 5.8–6.9
... by the Brazilian Unified Health System (SUS) and ranked the service as good or very good
82.4 80.9–83.9 83.3 81.6–85.1 81.6 77.4–85.9 81.0 78.1–83.9 78.1 70.7–85.6
... and the last hospitalization was by the Brazilian Unified Health System (SUS)
65.7 63.8–67.5 82.5 80.7–84.3 68.5 63.5–73.5 53.7 50.5–56.8 21.7 18.1–25.4 Table 2 shows the indicators of access to and use of health services according to the level of education of the head of household. Higher percentages were observed in the group of heads of household with no education to incomplete elementary for the following indicators: not performing normal activities for health reasons in the two weeks prior to the survey (7.8%), receiving health care with medicine prescription in the two weeks prior to the survey (64.8%), obtaining at least one of the prescribed medicines from the PFP (26.5%), being hospitalized for 24 hours or more, with the last hospitalization by SUS (82.5%).
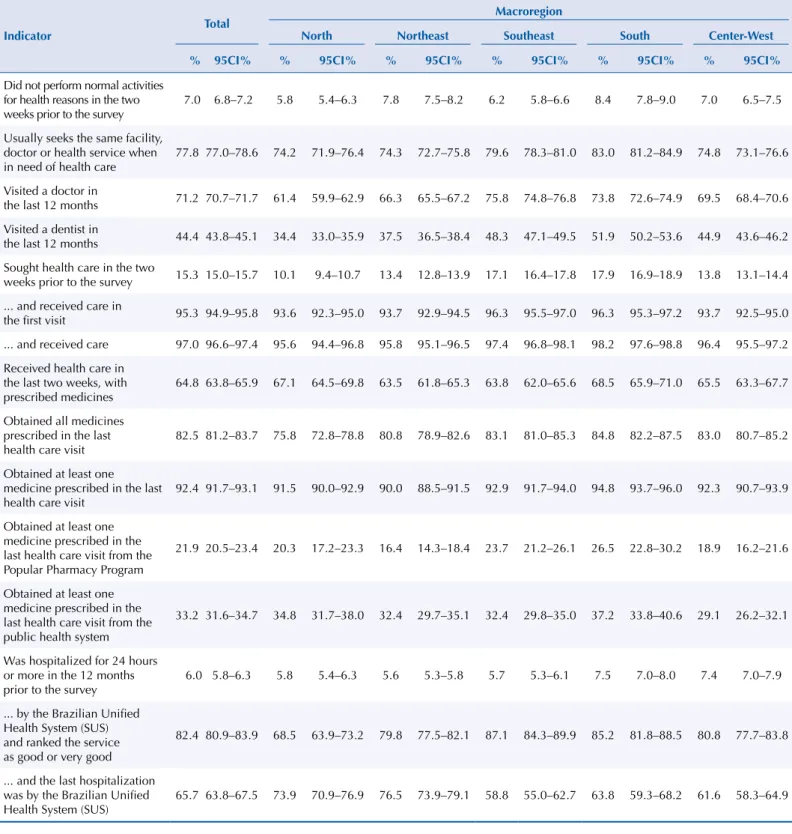
Table 3. Indicators of access to and use of health services by Brazilian macroregions. 2013 National Health Survey.
Indicator
Total Macroregion
North Northeast Southeast South Center-West
% 95CI% % 95CI% % 95CI% % 95CI% % 95CI% % 95CI%
Did not perform normal activities for health reasons in the two weeks prior to the survey
7.0 6.8–7.2 5.8 5.4–6.3 7.8 7.5–8.2 6.2 5.8–6.6 8.4 7.8–9.0 7.0 6.5–7.5
Usually seeks the same facility, doctor or health service when in need of health care
77.8 77.0–78.6 74.2 71.9–76.4 74.3 72.7–75.8 79.6 78.3–81.0 83.0 81.2–84.9 74.8 73.1–76.6
Visited a doctor in
the last 12 months 71.2 70.7–71.7 61.4 59.9–62.9 66.3 65.5–67.2 75.8 74.8–76.8 73.8 72.6–74.9 69.5 68.4–70.6
Visited a dentist in
the last 12 months 44.4 43.8–45.1 34.4 33.0–35.9 37.5 36.5–38.4 48.3 47.1–49.5 51.9 50.2–53.6 44.9 43.6–46.2
Sought health care in the two
weeks prior to the survey 15.3 15.0–15.7 10.1 9.4–10.7 13.4 12.8–13.9 17.1 16.4–17.8 17.9 16.9–18.9 13.8 13.1–14.4
... and received care in
the first visit 95.3 94.9–95.8 93.6 92.3–95.0 93.7 92.9–94.5 96.3 95.5–97.0 96.3 95.3–97.2 93.7 92.5–95.0
... and received care 97.0 96.6–97.4 95.6 94.4–96.8 95.8 95.1–96.5 97.4 96.8–98.1 98.2 97.6–98.8 96.4 95.5–97.2
Received health care in the last two weeks, with prescribed medicines
64.8 63.8–65.9 67.1 64.5–69.8 63.5 61.8–65.3 63.8 62.0–65.6 68.5 65.9–71.0 65.5 63.3–67.7
Obtained all medicines prescribed in the last health care visit
82.5 81.2–83.7 75.8 72.8–78.8 80.8 78.9–82.6 83.1 81.0–85.3 84.8 82.2–87.5 83.0 80.7–85.2
Obtained at least one medicine prescribed in the last health care visit
92.4 91.7–93.1 91.5 90.0–92.9 90.0 88.5–91.5 92.9 91.7–94.0 94.8 93.7–96.0 92.3 90.7–93.9
Obtained at least one medicine prescribed in the last health care visit from the Popular Pharmacy Program
21.9 20.5–23.4 20.3 17.2–23.3 16.4 14.3–18.4 23.7 21.2–26.1 26.5 22.8–30.2 18.9 16.2–21.6
Obtained at least one medicine prescribed in the last health care visit from the public health system
33.2 31.6–34.7 34.8 31.7–38.0 32.4 29.7–35.1 32.4 29.8–35.0 37.2 33.8–40.6 29.1 26.2–32.1
Was hospitalized for 24 hours or more in the 12 months prior to the survey
6.0 5.8–6.3 5.8 5.4–6.3 5.6 5.3–5.8 5.7 5.3–6.1 7.5 7.0–8.0 7.4 7.0–7.9
... by the Brazilian Unified Health System (SUS) and ranked the service as good or very good
82.4 80.9–83.9 68.5 63.9–73.2 79.8 77.5–82.1 87.1 84.3–89.9 85.2 81.8–88.5 80.8 77.7–83.8
... and the last hospitalization was by the Brazilian Unified Health System (SUS)
Regarding health care with medicine prescription, the highest percentage of people who obtained all prescribed medicines was observed in the South region (84.8%) and the lowest in the North region (75.8%). In the Northeast region, 90.0% of the people obtained at least one of the prescribed medicines. he study also found diferences between regions in obtaining medicines from the PFP and the public health service (Table 3).
he hospitalization percentage was higher in the South region (7.5%) compared to the others. Among people who reported hospitalization by SUS, the highest igure was in the Northeast region (76.5%). he Southeast region showed a better evaluation of care received during admission by SUS (87.1%) (Table 3).
DISCUSSION
Access to health services in the irst visit was virtually universal, despite the diferences by age group, level of education, and Brazilian region. Access to medicines was also satisfactory, and 1/3 of the people who managed to obtain at least one of the prescribed medicines did so from SUS. Less than half of the Brazilian population visited a dentist in the 12 months prior to the survey, with the lowest percentages among individuals aged 60 or over; whose head of household had no education or incomplete elementary; and who resided in the North region of the Country. he indings of this study are similar those of other Brazilian studies7,8,b. A study comparing the editions of the PNAD Health Supplement with PNS8 showed that access to and use of health services has been increasing in Brazil, although important regional diferences still remain. Access is directly related to supply (availability of services geared towards the population). Diiculties in this access are, in turn, related to the peculiarities of health systems and services. Several studies suggest that access to and use of health services in Brazil relect inequalities among diferent social groups7,9,10.
he PNS data corroborate such studies, since people living in the Southeast and South regions showed greater access to services when compared to residents of other regions, and people with higher levels of education (income proxy) showed greater access to services compared to those with lower levels of education. Other studies also found large diferences in health services between Brazilian regions11, with higher percentages of medical visits in the South and Southeast
regions, which have better living conditions and higher Human Development Indexes (HDI)12.
PNS assessed the reach of the Family Health Strategy in Brazil. his strategy provided better quality in primary health care, especially for the population with the lowest socioeconomic status13. Since the creation of SUS, services have been expanded and several activities in
health services have been almost universalized, such as vaccination coverage.
Demand for health services in the two weeks prior to the survey was greater in the population with complete tertiary education. A study carried out in São Paulo reported that older adults with lower income and educational levels sought health services less frequently14. According to Viacava and Bellido15, the rates of medical appointments in the last 12 months in Brazil increased from 54.7% in 1998 to 71.2% in 2013, despite persistent diferences by region and schooling. Diferences in the use of services and reduced access to medical appointments by education level have also been described in a study by Barros16 comparing the 2003 and 2008 editions of PNAD.
he possibility of using a health service regularly can be considered an important indicator of access to the health system. In turn, access is a complex concept and relates – in addition to the ofer, capacity of producing services – to the health needs perceived by the user, mediated by individual factors. hus, such factors, as the emergence of health problems or complaints, are transformed in demands and, consequently, use of services4,17.
he data found in PNS show an increase compared to previous PNADs: about 78% of the Brazilian population usually seek the same facility, doctor or health service when they need
b Instituto Brasileiro de Geografia
health care. It is important to note that no diferences were found by level of education of the head of household, indicating the importance of SUS in reducing inequalities in health.
Limitation of normal activities for health reasons is an indicator suggested by the World Health Organization for health surveysc, since it assesses the impact of a particular disease
or problem on an individual’s daily life. As in PNS, other surveys carried out in Brazilb and
in the city of São Paulo2 have used this indicator when investigating the two-week period
prior to the survey. he percentage of people who did not perform their normal activities in those two weeks was lower among those whose head of household had complete tertiary education, a pattern observed in previous PNAD editions. However, the percentage of people who did not perform their normal activities for health reasons was higher among those living in the South region, unlike the indings of the study by Travassos7, who found the highest percentages in the Southeast region of Brazil.
Regarding hospitalizations for 24 hours or more in the 12 months prior to the survey, higher percentages were observed in the group of heads of household with no education or incomplete elementary. he hospitalization rate was also higher in the South region, while the percentage of people whose last hospitalization was by SUS was higher in the Northeast region. his relects the large coverage of health plans in the Southeastern and Southern regions and the low coverage in the Northeast region, expanding in the latter the participation of SUS in health care to the population18.
Regional inequalities were also found by Viacava et al.19 when analyzing hospitalizations for
angioplasty and revascularization surgery, used as a proxy for access to high complexity services. Brazil is a privileged setting for the debate on social inequalities, due to its long tradition of commitment to health equity. Many obstacles prevail, such as the prevailing historical inequality. he Southeast region, which has the highest HDI in Brazil, showed a lower percentage of hospitalizations by SUS, but at the same time had a better evaluation of received care.
In the area of dental visits, the World Health Organization recommends one dentist for every 1,500 inhabitants. In Brazil, there is one dentist for every 800 inhabitants. However, a low percentage of dental visits was found, especially in the population with, at most, incomplete secondary education. In addition, a diference between the Brazilian regions was identiied. he highest percentages were observed in the South and Southeast regions, and the lowest in the North. he Brazil Sorridente (Smiling Brazil) program20, a policy for social inclusion implemented in 2006 in Brazil, has extended
the population’s access to oral health, but signiicant inequalities persist by schooling. Oral health policy in Brazil is still expanding and seems to have contributed to the increase in the use of services in this area, but not enough to overcome the socioeconomic inequalities in the use of these services. he present study ratiies Barbato et al.21, who airm: “Brazilians have in their mouths a
clear picture of existing inequalities in Brazilian society as a whole” (p. 1,812).
he study identiied a high percentage of access to medicines obtained from SUS or the private sector, and a high percentage of access to at least one of the medicines prescribed in the last health visit, which agrees with the literature22. Diferences were observed between
Brazilian regions regarding access to medicines in the public service and PFP (in both cases, higher in the South). Higher percentages of people who obtained medicines from the public health service or PFP were observed in the group of heads of household with no education to incomplete elementary. he results of this study show that the population with low purchasing power is supported by SUS for access to medicines and, therefore, SUS tends to equity in its attempt to universalize access to medicines23,24.
A limitation of this study is obtaining information from a single respondent, i.e., one person in the household answered on behalf of the other residents, potentially inluencing the validity of the information25. Another factor was the use of level of education as income proxy, since the lack of data on household income and per capita income made it impossible to analyze access to and use of services in this perspective, which is signiicant in terms of health inequalities.
c World Health Organization,
PNS was designed with the purpose of improving and expanding the PNAD Health Supplements, since the PNS sampling process aforded coverage of a wider geographical area and gain in estimate accuracy. To enable comparability with PNAD supplements, the blocks that investigated the use of health services were maintained, ensuring continuity of the historical series. he monitoring of indicators of access to and use of health services via population-based surveys is invaluable to assess health systems, contributing to the advancement of knowledge and improvements in health policies.
Although PNS data show improvements and advances in access to and use of health services, diferences by region and level of education are still observed: the South and Southeast regions have greater access, as well as those individuals whose head of household has a higher level of education. here is great worth in aiming to reduce disparities between regions and diferent levels of society, since the process of implementing SUS includes the principle of universalization, guaranteed by the Constitution and regulated according to the needs of the population it serves.
he results of this study underscore the importance of monitoring the described indicators and improving policy frameworks, aiming at the better functioning of the health system.
REFERENCES
1. Dever GEA, Champagne F. A epidemiologia na administração dos serviços de saúde. São Paulo: Pioneira; 1988.
2. Cesar CLG, Goldbaum M. Usos de serviços de saúde. In: Cesar CLG, Carandina L, Alves MCGP, Azevedo MB, Goldbaum M. Saúde e condição de vida em São Paulo: inquérito multicêntrico de saúde no Estado de São Paulo: ISA-SP. São Paulo: Faculdade de Saúde Pública da USP; 2005. p. 185-98.
3. Barata RB. Acesso e uso de serviços de saúde: considerações sobre os resultados da Pesquisa de Condições de Vida 2006. São Paulo Perspect. 2008;22(2):19-29.
4. Travassos C, Martins M. Uma revisão sobre os conceitos de acesso e utilização de serviços de saúde. Cad Saude Publica. 2004;20 Supl 2:S190-8. https://doi.org/10.1590/S0102-311X2004000800014.
5. Travassos CMR, Viacava F, Laguardia J. Os Suplementos Saúde na Pesquisa Nacional por Amostra de Domicílios (PNAD) no Brasil. Rev Bras Epidemiol. 2008;11 Supl 1:98-112. https://doi.org/10.1590/S1415-790X2008000500010.
6. Szwarcwald CL, Malta DM, Pereira CA, Vieira MLFP, Conde WL, Souza Júnior PRB, et al. Pesquisa Nacional de Saúde no Brasil: concepção e metodologia de aplicação. Cienc Saude
Coletiva. 2014;19(2):333-42. https://doi.org/10.1590/1413-81232014192.14072012.
7. Travassos C, Oliveira EXG, Viacava F. Desigualdades geográficas e sociais no acesso aos serviços de saúde no Brasil: 1998 e 2003. Cienc Saude Coletiva. 2006;11(4):975-86. https://doi.org/10.1590/S1413-81232006000400019.
8. Viacava F, Bellido JG. Condições de saúde, acesso a serviços e fontes de pagamento, segundo inquéritos domiciliares. Cienc Saude Coletiva. 2016;21(2):351-70.
https://doi.org/10.1590/1413-81232015212.19422015.
9. Cesar CLG, Tanaka OY. Inquérito domiciliar como instrumento de avaliação de serviços de saúde: um estudo de caso na região sudoeste da área metropolitana de São Paulo, 1989-1990. Cad Saude Publica. 1996;12 Supl 2:S59-70.
https://doi.org/10.1590/S0102-311X1996000600007.
10. Lima-Costa MF, Barreto S, Giatti L. A situação socioeconômica afeta igualmente a saúde de idosos e adultos mais jovens no Brasil? Um estudo utilizando dados da Pesquisa Nacional por Amostra de Domicílios – PNAD/98. Cienc Saude Coletiva. 2002;7(4):813-24. https://doi.org/10.1590/S1413-81232002000400015.
11. Cazelli CM, Brito JS, Sá PK, Ornelli CB. Análise das desigualdades regionais na oferta de serviços e saúde no Brasil: pesquisa da assistência médico-sanitária, 1992 e 1999. Saude
Debate. 2002;26(61):198-209.
13. Barros AJD, Victora CG, Cesar JA, Neumann NA, Bertoldi AD. Brazil: are health and nutrition programs reaching the neediest? Washington (DC): The World Bank; 2005. (HNP Discussion Paper, 9).
14. Louvison MCP, Lebrão ML, Duarte YAO, Santos JLF, Malik AM, Almeida ES. Desigualdades no uso e acesso aos serviços de saúde entre idosos do município de São Paulo. Rev Saude Publica. 2008;42(4):733-40. https://doi.org/10.1590/S0034-89102008000400021.
15. Viacava F, Bellido JG. Condições de saúde, acesso a serviços e fontes de pagamento, segundo inquéritos domiciliares. Cienc Saude Coletiva. 2016;21(2):351-70.
https://doi.org/10.1590/1413-81232015212.19422015.
16. Barros MBA, Francisco PMSB, Zanchetta LM, César CLG. Tendências das desigualdades sociais e demográficas na prevalência de doenças crônicas no Brasil, PNAD: 2003-2008. Cienc Saude
Coletiva. 2011;16(9):3755-68. https://doi.org/10.1590/S1413-81232011001000012.
17. Viacava F. Acesso e uso de serviços de saúde pelos brasileiros. RevRadis. 2010;(96):12-9.
18. Malta DC, Bernal RTI. Comparação dos fatores de risco e proteção de doenças crônicas na população com e sem planos de saúde nas capitais brasileiras, 2011. Rev Bras Epidemiol. 2014;17 Supl 1:241-55. https://doi.org/10.1590/1809-4503201400050019.
19. Viacava F, Porto S, Laguardia J, Moreira RS, Ugá MAD. Diferenças regionais no acesso a cirurgia cardiovascular no Brasil, 2002-2010. Cienc Saude Coletiva. 2012;17(11):2963-9. https://doi.org/10.1590/S1413-81232012001100013.
20. Pucca Junior GA, Costa JFR, Chagas LD, Silvestre RM. Oral health policies in Brazil. Braz Oral Res. 2009;23 Suppl 1:9-16. https://doi.org/10.1590/S1806-83242009000500003.
21. Barbato PR, Nagano HCM, Zanchet FN, Boing AF, Peres MA. Perdas dentárias e fatores sociais, demográficos e de serviços associados em adultos brasileiros: uma análise dos dados do Estudo Epidemiológico Nacional (Projeto SB Brasil 2002-2003). Cad Saude Publica. 2007;23(8):1803-14. https://doi.org/10.1590/S0102-311X2007000800007.
22. Aziz MM, Calvo MC, Schneider IJC, Xavier AJ, d’Orsi E. Prevalência e fatores associados ao acesso a medicamentos pela população idosa em uma capital do sul do Brasil: um estudo de base populacional. Cad Saude Publica. 2011;27(10):1939-50. https://doi.org/10.1590/S0102-311X2011001000007.
23. Costa KS, Francisco PMSB, Barros MBA. Conhecimento e utilização do Programa Farmácia Popular do Brasil: estudo de base populacional no município de Campinas-SP. Epidemiol Serv
Saude. 2014;23(3):397-408. https://doi.org/10.5123/S1679-49742014000300003.
24. Mengue SS, Tavares NUL, Costa KS, Malta DC, Silva Júnior JB. Fontes de obtenção de medicamentos para tratamento de hipertensão arterial no Brasil: análise da Pesquisa Nacional de Saúde, 2013. Rev Bras Epidemiol. 2015;18 Supl 2:192-203. https://doi.org/10.1590/1980-5497201500060017.
25. Jardim R, Barreto SM, Giatti L. Confiabilidade das informações obtidas de informante secundário em inquéritos de saúde. Cad Saude Publica. 2010;26(8):1537-48. https://doi.org/10.1590/S0102-311X2010000800008.
Funding: Agreement between Núcleo de Pesquisas Epidemiológicas em Nutrição e Saúde (Center for Epidemiological Research in Nutrition and Health – FSP-USP) and Secretaria de Vigilância em Saúde do Ministério da Saúde (Health
Surveillance Secretariat of the Brazilian Ministry of Health – SVS-MS), protocol number BR/LOA/1500052.001.
Authors’ Contribution: Study design and planning: SRS, DCM, CLS. Data analysis and interpretation: SRS, CNM, DCM. Manuscript preparation and drafting: SRS, CNM, DCM, CLS, MG, CLGC. Critical review of manuscript: SRS, CNM, DCM, CLS, MG, CLGC. Final approval: SRS, CNM, DCM, CLS, MG, CLGC.