Prevalence and factors associated
with sedentary behavior in
adolescents
ABSTRACT
OBJECTIVE: To analyze the prevalence of sedentary behavior and associated factors in adolescents.
METHODS: A cross-sectional study with adolescents aged 10 to 17 years, of both sexes, belonging to a 1994-1999 birth cohort in the city of Cuiabá, MT, Central Western Brazil. Data were collected using a questionnaire containing sociodemographic, economic, lifestyle and anthropometric variables. Sedentary behavior was determined as using television and/ or computer/video games for a time greater than or equal to 4 hours/day. Associations with sedentary behavior were evaluated using body mass index in childhood and adolescence and sociodemographic and behavioral variables using hierarchical logistic regression.
RESULTS: The overall prevalence of sedentary behavior was 58.1%. Of the 1,716 adolescents evaluated, 50.7% (n = 870) were male. In multivariate analysis, after adjustment for confounding factors, the variables that remained associated with sedentary behavior were: age (14 and over) (OR = 3.51, 95%CI 2.19;5.60); higher socioeconomic class (OR = 3.83, 95%CI 2.10;7.01), higher level of maternal education (OR = 1.81, 95%CI 1.09;3.01); living in the country (OR = 0.49, 95%CI 0.30;0.81); insuficient physical activity (OR = 1.25, 95%CI 1.02;1.53); experimentation with alcoholic beverages (OR = 1.34, 95%CI 1.08;1.66) and being overweight in adolescence (OR = 1.33, 95%CI 1.06;1.68).
CONCLUSIONS: The high proportion of adolescents in sedentary activities and the lack of association with being overweight in childhood, indicates the need for educational initiatives to reduce multiple risk behaviors. Encouraging physical activity in young people as a way of reducing sedentary behavior and, consequently, being overweight is fundamental.
DESCRIPTORS: Adolescent. Sedentary Lifestyle. Life Style. Socioeconomic Factors.
I Programa de Pós-graduação em
Biociências. Universidade Federal de Mato Grosso. Cuiabá, MT, Brasil
II Instituto de Saúde Coletiva. Departamento
de Saúde Coletiva. Universidade Federal de Mato Grosso. Cuiabá, MT, Brasil
III Departamento de Epidemiologia. Instituto
de Medicina Social. Universidade do Estado do Rio de Janeiro. Rio de Janeiro, RJ, Brasil
Correspondence:
Paula Jaudy Pedroso Dias
Rua Alfenas, 355 Casa 1 Residencial Alfenas 78040-600 Cuiabá, MT, Brasil
E-mail: [email protected]
Received: 11/12/2012 Approved: 2/3/2014
Article available from: www.scielo.br/rsp Paula Jaudy Pedroso DiasI
Isabela Prado DomingosI
Márcia Gonçalves FerreiraI
Ana Paula MuraroII
Rosely SichieriIII
In low and medium income countries, the prevalence of being overweight in childhood and adolescence has increased, largely driven by economic growth and rapid urbanization.14 The process of urbanization, often
accom-panied by increased levels of violence, can be associated with limitations to doing activities outside of the home, leading children and adolescents to substitute outdoor games and playing in the street with sedentary activi-ties.5 Moreover, technological advances and facilities
resulting from modernization seem to favor modiica -tions to individuals’ habits, especially concerning the adoption of a sedentary lifestyle.22
Sedentary behavior involves low intensity activities with reduced energy expenditure, such as watching televi-sion, playing video games or using the computer.17 This
type of behavior has also been associated with other habits damaging to child and adolescent health, such as experimentation with alcohol and smoking.20 Moreover,
the habit of watching television may inluence adoles -cents’ food choices, as the majority of foods appearing in the media are of high energy density, contributing to increased obesity among adolescents.2
Studies have shown a strong association between incre-ased sedentary behavior and being overweight in ado-lescents.21,22 However, it is not clear whether children
who are overweight in childhood have a greater chance of presenting sedentary behavior in adolescence.
Regular physical activity is one of the factors which may be inversely associated with time spent doing seden-tary activities.14 However, some authors have reported
sedentary activities irrespective of doing physical acti-vity, with a decline in one not encouraging an increased level of the other.7,12
Thus, the aim of this study was to analyze the preva-lence of factors associated with sedentary behavior in adolescents.
METHODS
Cross-sectional study with adolescents from a birth cohort born between 1994 and 1999, aged from 10 to 17 years, of both sexes, attending public and private elementary and high schools. The baseline study was conducted between August 1999 and January 2000, in health care centers around the city of Cuiabá, MT, Central Western Brazil, and 2,405 children under 5 years were assessed, as described by Gonçalves-Silva et al.8 To conduct the current study, these children,
now adolescents, were located using the EducaCenso, between 2009 and 2011, in public and private schools
INTRODUCTION
in Cuiabá and other cities in the interior of the state of Mato Grosso, as well as in another ive Brazilian state capitals (Brasília, Sao Paulo, Rio de Janeiro, Goiânia and Campo Grande). A total of 1,716 adolescents were interviewed, representing a follow up rate of 71.4%. Details on the strategies used to ind these adolescents can be found in Gonçalves-Silva et al9 (2012).
The data for this second stage were collected using a questionnaire on sociodemographic, economic and lifestyle data, and the adolescents’ weight and height were measured. The questionnaire had been previously tested with 114 adolescents randomly selected from a public and private school in Cuiabá, with the aim of correcting possible errors and to standardize the data collection instrument. The interviews and anthropometry were conducted in the schools by trained interviewers.
The anthropometric assessment was conducted accor-ding to the techniques standardized by Gordon et al10
(1988). Height was measured twice, with a maximum variation of 0.5 cm permitted between the two measu-rements, with the procedure repeated if this variation was exceeded, and the mean of the two measurements was considered as the value for analysis. These measu-rements were taken barefoot and using light clothing, in a standing position with the head positioned respec-ting the Frankfurt plan.
Self-reported skin color was classiied into ive catego -ries: white, black, mixed race, Asiatic and Indigenous. For data analysis purposes, Asiatic and Indigenous were grouped into the category “other” due to their low frequency. The adolescents’ age was deined in years, categorized into: 10, 11, 12, 13 and ≥ 14. The 14 and over age group was formed due to the low frequency of individuals in the 15, 16 and 17 years old category.
The classification recommended by the Brazilian Association of Research Companies,a based on the
accu-mulation of consumer goods in the household, living conditions, number of domestic employees and head of household’s level of schooling was used to analyze the families’ socioeconomic levels. The categories vary from A (the highest) to E (the lowest). Only one individual was classed as belonging to class E, thus, for purposes of data analysis, categories D and E were combined.
Parents’ level of schooling was deined using the number of completed years of study, which were classiied into four categories: 0 to 4, 5 to 8, 9 to 11 and 12 or more years. Among other variables, type of school (public or private) and place of residence, categorized as state capital (which included Cuiabá and Várzea Grande – a city geographically and economically integrated with
a Associação Brasileira de Empresas de Pesquisa. Códigos e guias: CCEB – Critério de Classificação Econômica Brasil. São Paulo: ABEP; 2008
Cuiabá – as well as the other ive state capitals inclu -ded in the study) or interior, were evaluated.
BMI in childhood (zero to ive years old) and in adoles -cence was assessed according to sex and age, expressed as a z score on the World Health Organization (WHO) reference curve.25,26 They were classiied according to
WHO recommendations,30 with individuals with BMI/
age < -2 z-scores classed as having low BMI, overwei-ght individuals those with BMI/age between > +1 and ≤ +2 z-scores and obese individuals those with BMI/ age > +2 z-scores. For the multiple analysis, individu-als were classiied into two categories: not overweight (low and appropriate BMI for age) and overweight (overweight and obese).
The adolescents’ physical activity was assessed using questions covering travelling to school, leisure activities and school PE classes, quantiied according to duration and frequency of the activity.6 For purposes of
analy-sis, the individuals were classiied as active (those who did 300 min or more of moderate to vigorous physical activity per week) or insuficiently active (those who did less than 300 min of moderate to vigorous physical activity per week).
Regarding alcoholic drinks, adolescents who reported having ever drunk at least a mouthful of any alcoholic drink were classed as having tried alcohol. Adolescents who reported having smoked a cigarette at least once in their life were classed as having tried smoking.
To assess eating patterns, a score adapted from Estima et al7 (2009) was calculated, in which adolescents
sco-red points according to the frequency with which they consumed breakfast, lunch and dinner, in the following way: 0 points (ive times a week to daily), one point (three or four times a week), two points (once or twice a week) and three points (never or almost never). This variable was categorized as satisfactory (total points of one or less) and unsatisfactory (total points grea-ter than one).
Regarding sedentary behavior (hours per day watching television, playing video games or using the compu-ter), the adolescents responded to two objective ques-tions: “On a normal weekday, how many hours do you spend watching television?” and “On a normal weekday, how many hours do you spend on the com-puter or playing video games?”. The World Health organization recommends that children and adoles-cents do not spend more than two hours/day in front of the television or a video game.7 However, in this
study, sedentary behavior was deined as four hours or more/day spent watching television and/or on the computer/video games as the high frequency of ado-lescents in the two hours or more/day of sedentary behavior category meant there was no power to dis-criminate the outcome.23
In the bivariate analysis, the prevalence and prevalence ratio of sedentary behavior (dependent variable) were calculated with their respective 95% conidence inter -vals, according to the independent variables. The Chi-square test was used to test differences between pro-portions. Linearity of associations was assessed using the Chi-square test. The variables which had p-values ≤ 0.20 in the bivariate analysis were then selected for the hierarchized multiple logistic regression analysis.24
In this way, the variables were included in blocks, with more distal factors (sociodemographic and economic – level one) being the irst to be included in the analysis, followed by those related to lifestyle (level two) and, in the most proximal level, the variable BMI for age in childhood and adolescence (level three). The varia-bles in the distal level were kept in the model and were included in the adjustment for the next level. The same procedure was used for level two, i.e., variables intro-duced at this level were kept in level three. All varia-bles with a level of signiicance less than or equal to 5% for the categories remained in the model, with the exception of BMI in childhood, which was kept in the model as it was deemed important for the it.
The statistical analyses were performed using Statistical Package for the Social Sciences (SPSS) software, ver-sion 17.0 for Windows (SPSS Inc., Chicago, IL, EUA) and EpiInfo™ 7 version 7.0.9.3.4.
The project was approved by the Ethics Committee of the Hospital Universitário Júlio Muller of the Universidade Federal de Mato Grosso (Protocol 651/CEPHUJM/2009). Parents or guardians consented to the adolescents’ par-ticipation in the research and signed an informed con-sent form.
RESULTS
Of the 1,716 adolescents studied, 50.7% were male. Overall prevalence of sedentary behavior was 58.1% (n = 997), with a higher proportion in those belonging to economic class “A” (68.6%), those attending private schools (65.9%), living in a state capital (58.7%) and those whose mothers had 12 or more years of schooling (63.7%). The prevalence of sedentary behavior incre-ased with age. No statistically signiicant difference in sedentary behavior according to sex, skin color or fathers’ level of schooling was found (Table 1).
Table 1. Prevalence (%), Prevalence ratio (PR) and 95% confidence interval (95%CI) of sedentary behavior according to sociodemographic, economic, lifestyle and body mass index (BMI) variables of adolescents aged from 10 to 17, 2009 to 2011.
Variables n Sedentary behavior (≥ 4 hours/day)
% PR 95%CI
Sex
Male 870 56.8 1
Female 846 59.5 1.04 0.96;1.13
Agea
10 105 40.0 1
11 603 52.6 1.31 1.02;1.68
12 443 59.8 1.49 1.17;1.91
13 236 63.6 1.59 1.23;2.04
≥ 14 329 67.8 1.69 1.32;2.16
Skin color
White 371 56.6 1
Black 259 57.9 1.02 0.89;1.17
Mixed race 1,005 59.0 1.04 0.94;1.15
Other 81 54.3 0.96 0.77;1.19
Economic classa,b
A 86 68.6 2.33 1.57;3.46
B 603 62.5 2.12 1.46;3.08
C 959 56.4 1.92 1.32;2.78
D and E 68 29.4 1
Type of school
Public 1,357 56.1 1
Private 358 65.9 1.17 1.07;1.28
Maternal schooling (years)a,c
0 to 4 103 43.7 1
5 to 8 460 56.3 1.29 1.02;1.62
9 to 11 841 59.2 1.35 1.08;1.70
≥ 12 259 63.7 1.46 1.15;1.85
Paternal schooling (years)d
0 to 4 128 57.8 1
5 to 8 490 60.2 1.04 0.88;1.22
9 to 11 665 57.4 0.99 0.84;1.17
≥ 12 226 61.5 1.06 0.88;1.27
Place of residence
State Capital 1,641 58.7 1
Interior 75 45.3 0.77 0.60;0.99
Physical activity
< 300 min/week 852 61.9 1.13 1.05;1.23
≥ 300 min/week 864 54.4 1
Eating pattern
Unsatisfactory 586 61.6 1.09 1.01;1.19
Satisfactory 1,130 56.3 1
Tried alcohol
Yes 668 63.3 1.15 1.07;1.25
No 1,048 54.8 1
Tried smoking
Yes 65 69.2 1.20 1.01;1.42
No 1,651 57.7 1
classiication, regarding being overweight, there was a statistically signiicant association with sedentary beha -vior in both childhood and adolescence.
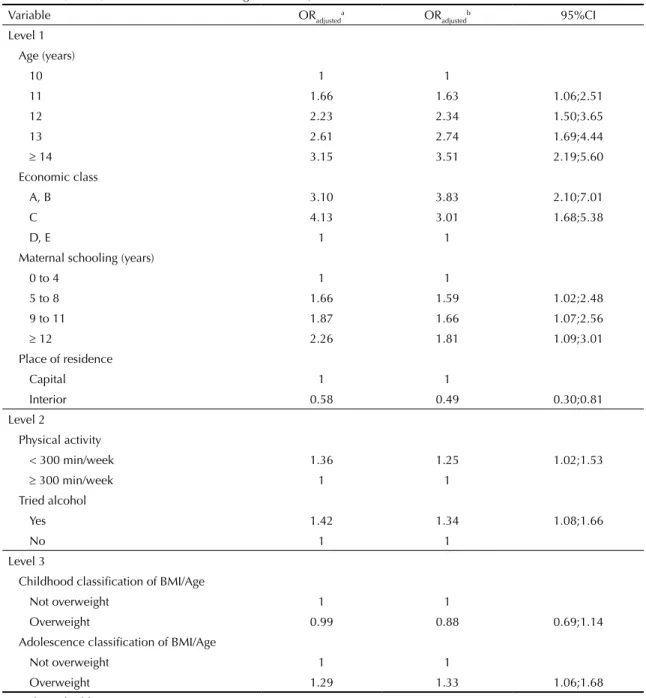
In the inal model obtained by hierarchized logistic regression, the sociodemographic and economic varia-bles which remained associated with the outcome were age, economic class, maternal schooling and place of residence. Of the lifestyle variables, it was observed that those adolescents who did less physical activity had a 25.0% greater chance of demonstrating sedentary behavior compared with those who were more active (OR = 1.25; 95%CI 1.02;1.53). In the same way, the trying alcohol variable remained associated with seden-tary behavior, showing that adolescents who had tried alcoholic drinks had a higher chance of demonstrating sedentary behavior than those who had not. However, eating patterns and trying smoking ceased to be asso-ciated with sedentary behavior (Table 1).
Having tried smoking or alcohol were co-related varia-bles, with 84.6% of adolescents having tried both, which could explain the lack of association with having tried smoking in the inal model. However, additional analysis, excluding trying alcohol and including trying smoking did not show a statistically signiicant association either (p = 0.14). Similar analysis was performed for BMI as adolescents who were overweight were probably more frequently overweight in childhood, this being veriied in the study value of 44.3%. Thus, analysis which only included being overweight in childhood was not statis-tically signiicant either (p = 0.67).
DISCUSSION
Being older, belonging to a higher economic class, not doing physical activity and being overweight all had an independent effect on sedentary behavior in adolescents. Living in the interior had a protective effect on this beha-vior. The prevalence of sedentary behavior observed
(58.1%) was higher than that observed by Silva et al23
(2009), in students aged 15 to 19 in the state of Santa Catarina, Southern Brazil. Adolescents from higher eco-nomic classes, as well as those at private schools, had a higher chance of sedentary behavior, which corrobora-tes the results found by Oliveira et al18 (2010). It is
pro-bable that adolescents attending private schools have more access to technology, especially those related to computers and video games. In the same way, parents with higher levels of schooling have higher purchasing power and, therefore, more facility in acquiring electro-nic apparatus for their children, thus increasing the pre-valence of sedentary behavior among them.21
Adolescents living in the interior were shown to be protected from sedentary behavior compared with their peers in the state capitals. Young big city residents pro-bably have greater access to electronic devices, whereas children and adolescents living in the interior may have more chances to participate in activities which expend energy, such as riding a bicycle and playing in the stre-ets. A similar result was found by Silva et al23 (2009),
with the prevalence of sedentary behavior being more frequent in adolescents living in urban areas.
As regards the adolescents’ age groups, the older ones showed a higher prevalence of sedentary behavior. It can be speculated that older adolescents are not very attracted to other activities, including doing physical exercise, deeming them unimportant for their expec-tations and substituting them for sedentary behavior. According to Mathews et al16 (2008), older adolescents
spend approximately 60% of their free time in sedentary activities, compared with younger adolescents. Oliveira et al18 (2010) state that younger adolescents spend less
time doing sedentary activities.
Some authors have shown that the relationship between sedentary activities and doing physical activity is inde-pendent,1,5 as an individual may do sedentary activities
yet still follow recommendations for physical activity.
Continuation
Childhood BMI/Age classification
Low BMI 41 68.3 1.18 0.95;1.46
Appropriate BMI 1,325 57.8 1
Overweight 270 54.8 0.94 0.84;1.06
Obese 80 68.8 1.19 1.02;1.39
Adolescence BMI/Age classification
Low BMI 56 48.2 0.85 0.64;1.12
Appropriate BMI 1,185 56.8 1
Overweight 315 65.1 1.14 1.04;1.26
Obese 160 57.5 1.01 0.88;1.16
ap of linear trend < 0.01.
bClassification according to Brazilian Association of Research Companies (ABEP, 2008). cData for 53 individuals missing.
However, this study showed that insuficiently active adolescents had a higher chance of sedentary behavior compared with active ones. Such divergences may occur due to the dificulty and variability in measuring and clas -sifying both parameters. However, the decreased amount of time spent on sedentary activities seems to be a stra-tegy for reducing physical inactivity.13 Different studies
have shown that low levels of physical activity in children and adolescents has been attributed to more time spent in front of the television, computer or video games3,15
which would also explain the association between level of physical activity and increased obesity.3
Overweight adolescents have a greater chance of seden-tary behavior, a inding in agreement with various epi -demiological surveys.3,5,12 It is probable that time spent
on sedentary activities may affect both level of physi-cal activity and eating habits of the individual, possi-bly increasing the prevalence of being overweight.2,3
One of the aims of this research was to verify whether BMI in childhood was associated with sedentary beha-vior in adolescence, in other words, whether a young person who was overweight in childhood had a higher chance of acquiring sedentary behavior in adolescence.
Table 2. Hierarchized multiple logistic regression for sociodemographic and economic (level 1), lifestyle (level 2) and body
mass index (level 3) variables for adolescents aged 10 to 17, 2009 to 2011.
Variable ORadjusteda OR
adjusted
b 95%CI
Level 1 Age (years)
10 1 1
11 1.66 1.63 1.06;2.51
12 2.23 2.34 1.50;3.65
13 2.61 2.74 1.69;4.44
≥ 14 3.15 3.51 2.19;5.60
Economic class
A, B 3.10 3.83 2.10;7.01
C 4.13 3.01 1.68;5.38
D, E 1 1
Maternal schooling (years)
0 to 4 1 1
5 to 8 1.66 1.59 1.02;2.48
9 to 11 1.87 1.66 1.07;2.56
≥ 12 2.26 1.81 1.09;3.01
Place of residence
Capital 1 1
Interior 0.58 0.49 0.30;0.81
Level 2
Physical activity
< 300 min/week 1.36 1.25 1.02;1.53
≥ 300 min/week 1 1
Tried alcohol
Yes 1.42 1.34 1.08;1.66
No 1 1
Level 3
Childhood classification of BMI/Age
Not overweight 1 1
Overweight 0.99 0.88 0.69;1.14
Adolescence classification of BMI/Age
Not overweight 1 1
Overweight 1.29 1.33 1.06;1.68
a Unadjusted odds ratio.
The results of the bivariate analysis show that there was an association between sedentary behavior and obesity in childhood, although, after adjusting for confounding fac-tors in the multiple analysis, they ceased to be associated.
Sedentary behavior was associated with other behavior deemed to be risky such as trying alcohol and smoking, and unsatisfactory eating patterns. However, after adjus-ting for sociodemographic and economic variables, only having tried alcohol remained associated. It was veriied that adolescents who reported having tried alcohol had a higher chance of sedentary behavior compared with those who reported not having tried alcohol. Among other fac-tors, alcoholic drinks are frequently shown in the media through advertising, ilms, soap operas and music,19
mea-ning that adolescents who spend more time in sedentary activities are more encouraged to consume alcoholic drinks.
This research originated from a cohort study, which allo-wed variables from early childhood to be evaluated with the variables from adolescence, which was a positive point of this study. However, as it is a cross-sectional
study, a limitation is that causality cannot be inferred in the association between sedentary behavior and the variables investigated, as risk factors and outcomes are seen at one single moment. Moreover, the data on risk factors evaluated, such as trying alcohol or smoking and doing physical activity were obtained through a questionnaire and there may have been errors in classi-ication from the adolescents’ statements, which tend to omit experiences with alcohol and other drugs as well as dificulties in remembering their activities.
To conclude, a high proportion of adolescents with sedentary behavior was observed, especially among older adolescents and those with a higher socioecono-mic level. The inverse association of sedentary activi-ties and physical activity suggests the need for inter-vention strategies for this population, with educational actions, through the family, schools and health care professionals. These interventions, especially concer-ning encouraging doing activities which burn energy, should reduce sedentary behavior and, consequently, excess weight among young people.
1. Al-Hazzaa HM, Abahussain NA, Al-Sobayel HI, Qahwaji DM, Musaiger AO. Physical activity, sedentary behaviors and dietary habits among Saudi adolescents relative to age, gender and region. Int J Behav Nutr Phys Act. 2011;8:140. DOI:10.1186/1479-5868-8-140
2. Almeida SS, Nascimento PCBD, Quaioti TCB. Quantidade e qualidade de produtos alimentícios anunciados na televisão brasileira.
Rev Saude Publica. 2002;36(3):353-5. DOI:10.1590/S0034-89102002000300016
3. Boulos R, Vikre EK, Oppenheimer S, Chang H, Kanarek RB. ObesiTV: how television is influencing the obesity epidemic. Physiol Behav. 2012;107(1):146-53. DOI:10.1016/j.physbeh.2012.05.022
4. Caroli M, Argentieri L, Cardonei M, Masi A. Role of television in childhood obesity prevention. Int J Obes Relat Metab Disord. 2004;28(Suppl 3):S104-8. DOI:10.1038/sj.ijo.0802802
5. Craemer M, Decker E, Bourdeaudhuiji I, Vereecken C, Deforche B, Manios Y, et al. Correlates of energy balance-related behaviours in preschool children: a systematic review. Obes Rev. 2012;13(Suppl 1):13-28. DOI:10.1111/j.1467-789X.2011.00941.x
6. Currie C, Roberts C, Morgan A, Smith R, Settertobulte W, Samdal O, et al, editors. Young people’s health in context: Health Behaviour in Schoolaged Children (HBSC) study: international report from the 2001/2002 survey. Copenhagen: WHO; 2004. p.237. (Health Policy for Children and Adolescents, 4).
7. Estima CCP, Costa RS, Sichieri R, Pereira RA, Veiga GV. Meal consumption patterns and anthropometric measurements in adolescents from a low
socioeconomic neighborhood in the metropolitan area of Rio de Janeiro, Brazil. Appetite. 2009;52(3):735-9. DOI:10.1016/j.appet.2009.03.017
8. Gonçalves-Silva RMV, Valente JG, Lemos-Santos MGF, Sichieri R. Tabagismo domiciliar em famílias com crianças menores de 5 anos no Brasil.
Rev Panam Salud Publica. 2005;17(3):163-9. DOI:10.1590/S1020-49892005000300003
9. Gonçalves-Silva RMV, Sichieri R, Ferreira MG, Pereira RA, Muraro AP, Moreira NF, et al. O censo escolar como estratégia de busca de crianças e adolescentes em estudos epidemiológicos.
Cad Saude Publica. 2012;28(2):400-4. DOI:10.1590/S0102-311X2012000200019
10. Gordon CC, Chumlea WC, Roche AF. Stature, recumbent length, and weight. In: Lohman TG, Roche AF, Martorell R. Anthropometric standardization reference manual. Champaign:(Ill): Human Kinetics Books;1988. p.3-8.
11. Hancox RJ, Poulton R. Watching television is associated with childhood obesity: but is it clinically important? Int J Obes (Lond). 2006;30(1):171-5. DOI:10.1038/sj.ijo.0803071
12. Horst KVD, Paw MJCA, Twisk JWR, Mechelen W. A brief review on correlates of physical activity and sedentariness in youth. Med Sci Sports Exerc. 2007;39(8):1241-50. DOI:10.1249/mss.0b013e318059bf35
13. Koekuza N, Koo M, Alisson KR, Adlaf EM, Dwyer JJM, Faulkner G, et al. The relationship between sedentary activities and physical inactivity among adolescents: results from the Canadian Community Health Survey. J Adolesc Health. 2006;39(4):515-22. DOI:10.1016/j.jadohealth.2006.02.005
14. Malik VS, Willett WC, Hu FB. Global obesity: trends, risk factors and policy implications.
15. Malta DC, Sardinha LMV, Mendes I, Barreto SM, Giatti L, Castro IRR, et al. Prevalência de fatores de risco e proteção de doenças crônicas não
transmissíveis em adolescentes: resultados da Pesquisa Nacional de Saúde do Escolar (PeNSE), Brasil, 2009.
Cienc Saude Coletiva. 2010;15(Supl 2):3009-19. DOI:10.1590/S1413-81232010000800002
16. Matthews CE, Chen KY, Freedson PS, Buchowski MS, Beech BM, Pate RR, et al. Amount of time spent in sedentary behaviors in the United States, 2003-2004. Am J Epidemiol. 2008;167(7):875-81. DOI:10.1093/aje/kwm390
17. Mello ED, Luft VC, Meyer, F. Obesidade infantil: como podemos ser eficazes? J Pediatr (Rio J).
2004;80(3):173-82. DOI:10.2223/JPED.1180
18. Oliveira TC, Silva AAM, Santos CJN, Silva JS, Conceição SIO. Atividade física e sedentarismo em escolares da rede pública e privada de ensino em São Luís. Rev Saude Publica. 2010;44(6):996-1004. DOI:10.1590/S0034-89102010000600003
19. Pedrosa AAS, Camacho LAB, Passos SRL, Oliveira RVC. Consumo de álcool entre estudantes universitários.
Cad Saude Publica. 2011;27(8):1611-21. DOI:10.1590/S0102-311X2011000800016
20. Saffer H. Alcohol advertising and youth. J Stud Alcohol. 2002;(Suppl 14):173-81.
21. Sallis JF, Glanz K. The role of built environments in physical activity, eating, and obesity in childhood.
Future Child. 2006;16(1):89-108.
22. Silva KS, Lopes AS, Silva FM. Comportamentos sedentários associados ao excesso de peso corporal.
Rev Bras Educ Fis Esp. 2007;21(2):135-41. 23. Silva KS, Nahas MV, Peres KG, Lopes AS. Fatores
associados à atividade física, comportamento sedentário e participação na Educação Física em estudantes do Ensino Médio em Santa Catarina, Brasil. Cad Saude Publica. 2009;25(10):2187-200. DOI:10.1590/S0102-311X2009001000010 24. Victora CG, Huttly SR, Fuchs SC, Olinto
MTA. The role of conceptual frameworks in epidemiological analysis: a hierarchical approach. Int J Epidemiol.1997;26(1):224-7. DOI:10.1093/ije/26.1.224
25. World Health Organization, Multicentre Growth Reference Study Group. WHO child growth standards: length/height-for-age, age, weight-for-length, weight-for-height and body mass index-for-age: methods and development. Geneva; 2006.
26. World Health Organization. Growth reference data for 5-19 years: body mass index-for-age, length/height-for-age and weight-for-height. Geneva; 2007.
27. World Health Organization. Physical status: the use and interpretation of anthropometry. Geneva; 1995. (WHO Technical Report Series, 854).
This study was supported by the Fundação de Amparo à Pesquisa do Estado do Mato Grosso (FAPEMAT – Process