Alessandro Gonçalves CampolinaI
Fernando AdamiII
Jair Licio Ferreira SantosIII
Maria Lucia LebrãoIV
I Programa de Pós-Graduação em Epidemiologia. Faculdade de Saúde Pública. Universidade de São Paulo. São Paulo, SP, Brasil
II Departamento de Saúde da Coletividade. Faculdade de Medicina do ABC. Santo André, SP, Brasil
III Departamento de Medicina Social. Faculdade de Medicina de Ribeirão Preto. Universidade de São Paulo. São Paulo, SP, Brasil
IV Departamento de Epidemiologia. Faculdade de Saúde Pública. Universidade de São Paulo. São Paulo, SP, Brasil
Correspondence:
Alessandro Gonçalves Campolina Rua Cincinato Braga, 463/21 Bela Vista 01333-011 São Paulo, SP, Brasil E-mail: [email protected] Received: 9/23/2012
Approved: 4/25/2013
Article available from: www.scielo.br/rsp
Effect of eliminating chronic
diseases among elderly
individuals
Efeito da eliminação de doenças
crônicas em indivíduos idosos
ABSTRACT
OBJECTIVE: To determine whether the elimination of certain chronic diseases is capable of leading to the compression of morbidity among elderly individuals.
METHODS: A population-based, cross-sectional study was carried out with offi cial data for the city of Sao Paulo, Southeastern Brazil in 2000 and data from the SABE (Health, Wellbeing and Ageing) study. Sullivan’s method was used to calculate disability-free life expectancy. Cause-deleted life tables were used to calculate the probabilities of death and disabilities with the elimination of health conditions.
RESULTS: The largest gains in disability-free life expectancy, with the elimination of chronic illness, occurred in the female gender. Among individuals of a more advanced age, gains in disability-free life expectancy occurred as result of a relative compression of morbidity. Among men aged 75 years, all conditions studied, except heart disease and systemic arterial pressure, led to an absolute expansion of morbidity and, at the same time, to a relative compression of morbidity upon being eliminated.
CONCLUSIONS: The elimination of chronic diseases in the elderly could lead to the compression of morbidity in elderly men and women.
Non-transmittable chronic diseases account for 50% of the total number of diseases in developing countries, with a large portion of deaths related to cardiovascular disease, chronic pulmonary disease and diabetes. It is estimated that a 2% reduction in the mortality rate due to chronic diseases would avoid 36 million deaths in these countries between 2005 and 2015.33 In Brazil,
these conditions are the main source of burden of disease and has become the top priority in health care.32
With the increase in the prevalence of chronic diseases associated with the ageing of the population three theories have been formulated to address the effect of changes in morbidity-mortality patterns on the health status of populations.28,27 The fi rst is known as the
“compression of morbidity” and suggests that the life expectancy of adults has arrived at biological limits. As a result, if the incidence of debilitating diseases could be delayed, morbidity would then be compressed into a shorter period of life.9 The second theory proposes
that the decline in the mortality rate results from a reduction in disease lethality rates and not the reduction in incidence or progression; consequently, the decline in the mortality rate is accompanied by an increase in
RESUMO
OBJETIVO: Avaliar se a eliminação de determinadas doenças crônicas é capaz de levar à compressão da morbidade em indivíduos idosos.
MÉTODOS: Estudo transversal analítico de base populacional realizado com dados ofi ciais secundários para o Município de São Paulo, em 2000, e dados obtidos a partir do estudo SABE: Saúde, Bem-Estar e Envelhecimento. Foi utilizado o método de Sullivan para o cálculo de expectativas de vida livre de incapacidade. Tábuas de vida de eliminação de causas foram utilizadas para calcular as probabilidades de morte e incapacidade com a eliminação de doenças.
RESULTADOS: Os maiores ganhos em expectativa de vida livre de incapacidade, com a eliminação de doenças crônicas, ocorreram no sexo feminino. Nos indivíduos de idade mais avançada, os ganhos dessa expectativa de vida ocorreram em função de um processo de compressão relativa da morbidade. Nos homens com idade de 75 anos, todas as doenças estudadas, com exceção da doença cardíaca e da hipertensão arterial sistêmica, levaram a um processo de expansão absoluta da morbidade, mas simultaneamente a um processo de compressão relativa da morbidade ao serem eliminadas.
CONCLUSÕES: A eliminação de doenças crônicas na população idosa pode levar a uma compressão da morbidade em homens e mulheres idosos.
DESCRITORES: Idoso. Doença Crônica. Perfi l de Impacto da Doença. Expectativa de Vida Ativa. Tábuas de Vida. Anos Potenciais de Vida Perdidos.
INTRODUCTION
the number of individuals with chronic diseases and disability.17 The third theory states that the decline in
the mortality rate is partially due to the drop in lethality rates, but, at the same time, the incidence and progres-sion of chronic disease must be diminishing, leading to a dynamic balance. According to this hypothesis, the years with severe or debilitating health conditions remain relatively constant, as medical interventions and changes in lifestyle reduce the progression rate of chronic diseases.19
Summary measures of population health that combine morbidity and mortality data are commonly used to estimate the impact of particular conditions and diseases, enabling the analysis of expected gains with the reduction or elimination of such conditions.23 Thus,
life expectancy and disability-free life expectancy may be used to assess the occurrence of the compression of morbidity in a population.26 In developing countries,
diseases, with the aim of establishing whether the control of these diseases would contribute toward a compression of morbidity.
The aim of the present study was to determine whether the elimination of certain chronic diseases is capable of leading to the compression of morbidity among elderly individuals.
METHODS
An analytical, population-based, cross-sectional study was carried out with data from the Saúde, Bem-Estar e Envelhecimento (SABE) [Health, Wellbeing and Ageing] study, which was a population-based survey aimed at evaluating the living conditions of elderly individuals in seven cities in Latin American and the Caribbean (Argentina, Barbados, Brazil, Chile, Cuba, Mexico and Uruguay).18In Brazil, the SABE study was
carried out in the year 2000 in the city of Sao Paulo, involving 2,143 male and female elderly individuals aged 60 or older. Sampling was probabilistic and representative of the elderly population of the city in 1996, which was 836,223 individuals.a The sample was
initially made up of 1,568 individuals and increased to 2,143 individuals in order to complement the number of elderly individuals aged 75 or older and the male gender due to the greater mortality rates in this age group and gender.b
To obtain the desired number of elderly individuals, a minimum number of 5,882 domiciles to be selected was defi ned by the expression [d = (1500×10/3)/0.85], in which d is the number of domiciles to be randomly selected by lots, 1,500 is the minimum number of elderly individuals needed to enable the desired analyses, 10/3 refers to three elderly individuals for every ten domiciles and 0.85 is the expected success rate regarding the interviews at the selected domiciles.b
Two-stage conglomerate sampling was used for the selection of domiciles, chosen based on the propor-tional-to-size criterion:
First stage: A total of 72 census tracts were randomly selected by lots using the permanent registry obtained from the Brazilian National Household Survey.b The
sampling fraction was calculated by the expression f1 = (72×Di)/D, in which f1 is the sampling fraction in this stage, Di is the number of domiciles in each tract and D is the total number of domiciles in the city of Sao Paulo in 1998.
Second stage: The number of domiciles to be selected randomly by lots was calculated based on the number of census tracts (5,882/72 = 81.69, rounded up to 90).
The sampling fraction was calculated by the expres-sion f2 = 90/Di, in which f2 is the sampling fraction in this stage and Di is the number of domiciles in each tract.
The probability of a domicile pertaining to the selected sample was defi ned by f = f1×f2. Among the selected domiciles, 1,852 eligible elderly individuals were iden-tifi ed, of whom 1,568 agreed to participate in the study (84.67%). The complementation of the sample with age ≥ 75 and the male gender was performed through the localization of residences near the selected tracts or, at most, within the limits of the districts containing the selected tracts.
The data were collected using a questionnaire drafted by a regional committee made up of the main researchers in each participating country or specialists on specifi c topics of the study. The questionnaire was made up of 11 sections addressing aspects of the lives of elderly individuals: personal data, cognitive assessment, health status, functional state, medications, use of and access to services, family and social support network, labor history, housing characteristics, anthropometry, fl ex-ibility and mobility. The interviews were carried out at the individuals’ homes between January 2000 and March 2001, 88% of which were carried out with the elderly individuals themselves.1
The following socio-demographic characteristics were considered based on the pertinent scientifi c literature: age, gender, living arrangement, marital status, skin color, labor status and schooling.13 Age was
catego-rized in 60 to 74 years old and 75 and older. Living arrangement was dichotomized as living alone or accompanied. Schooling was categorized as no formal education, elementary education, high school educa-tion and university educaeduca-tion (including postgraduate education). Marital status was categorized as single, married/stable relationship, widowed and divorced/ separated. Labor status was dichotomized as currently working or not working.
Chronic diseases were recorded based on affi rmative responses (self-reports) to the presence of nine chronic diseases: systemic arterial hypertension, diabetes mellitus, heart disease, lung disease, cancer, joint disease, cerebrovascular disease, falls in the previous year and nervous or psychiatric problem. The diseases used in this study were based on the International Classifi cation of Diseases – 10th revision (ICD-10).
Functional incapacity was defined as difficulty in performing one or more activities of daily living: dressing, eating, bathing, toileting, ambulation, fecal incontinence and urinary incontinence.8
a Instituto Brasileiro de Geografi a e Estatística. Censo demográfi co: 2000. Rio de Janeiro: IBGE; 2001.
In addition to self-reports, certain conditions were only considered in the present study when under current treatment (e.g., diabetes) and when a previous medical diagnosis had been established (e.g., cerebro-vascular disease).
Summary life tables beginning at 60 years of age for the year 2000 were calculated based on mortality and health condition information12,34 following the steps
described in demographics manuals.15 The elderly
population estimated for the year 2000 was obtained from the 2000 demographic censusa,c and information
on deaths among the elderly population was obtained from the Sao Paulo State Data Analysis Foundation.c,d
The approach proposed by Nusselder et al (1996) was used to analyze the effect of the elimination of a chronic disease on LE (life expectancy) and DFLE (disability-free life expectancy).25 According to the authors, if
a disease were eliminated, individuals would not be affected by disability or death stemming from the disease in question. Assuming independence between the causes of death and disability, the elimination of a disease would lead to a decline in the specifi c prob-abilities of death for age and the specifi c prevalence of disability for age.
Multiple logistic regression controlled for age was used to estimate the probability of disability with the elimina-tion of a chronic disease. Disability was the dependent variable (1 = present; 0 = absent) and the independent variables were age and the nine diseases (1 = present; 0 = absent). The probability of an individual having one or more disabilities was computed substituting the regression coeffi cients and scores of the respondents in the independent variables of the regression equation:
in which P is the probability of an individual having at
least one disability, exp is the basis of the logarithm and
βx = α + β1x1 + β2x2 +... + βpxp is a vector of regression coeffi cients (α, β) and data (x) included in the model as independent variables (age and the nine diseases). The effect of the elimination of a disease on the prevalence of disability was simulated by deleting the disease from the regression equation. The difference between the prevalence of disability with and without disease could then be attributed to the deleted disease.25
With the elimination of a disease, the probabilities of death were estimated using cause-deleted life tables. The estimated probabilities of death with the deletion of a specifi c disease and the prevalence of disability estimated with the deletion of the disease from the
logistic regression model were combined in total LE and DFLE’ using Sullivan’s method.34 In analyses
involving inferences based on the sample of informa-tion from each individual, correcinforma-tions for stratifi cation and non-responses were weighed by the inverse of the sampling fraction.
Relative frequencies (%) were used for the prevalence analysis and the Rao-Scott test was used to determine associations.30 The analyses were performed using either
Microsoft Excel® 2007 or Stata® 11.1. With the latter, the
weight of the sample was taken into consideration (svy command). Weights arising from sample design – i.e., the inverse of the sampling fractions, are adjusted to represent the population of the municipality by post-stratifi cation. The weight of each individual indicates how many inhabitants of the municipality he represents, and thus the estimates of means and proportions are weighted to represent population estimates. Details on the methodology of the study are described elsewhere.1,18
A total of 2,143 elderly individuals were evaluated, 1,256 of whom were women (58.6%). The response rates reached 84.6% and the main reason for nonpar-ticipation were refusal (7.5%) and address changes (2.0%). A greater percentage of women (24.2%) were aged 75 or more in comparison to men (19.2%). No statistically signifi cant differences were found with regard to the distribution of skin color (p = 0.9535). Regarding schooling, 8.9% and 8.3% of the men had a complete high school and university educa-tion, respectively; for women, these fi gures were 6.8% and 3.7%, respectively. A greater percentage of women were widowed (43.2%) in comparison to men (14.5%) and a greater percentage of women were single (52.4%) in comparison to men (4.4%). A greater percentage of men were employed at the time of the study (40.5%) in comparison to women (19.1%). A greater percentage of women lived alone (17.1%) in comparison to men (7.7%).
The original SABE study complies with the principles laid down in the Declaration of Helsinki and received approval from the respective ethics committees of the countries involved. In Brazil, the study received approval from the Human Research Ethics Committee of the Faculdade de Saúde Pública da Universidade de São Paulo and the National Research Ethics Committee (COEP 83/06, March 14, 2006.)
RESULTS
The prevalence of disability regarding activities of daily living was greater among the individuals aged 75 or older for both genders. Diffi culty dressing and
c Ministério da Saúde, DATASUS. Informações em saúde: mortalidade – Brasil [cited 2010 Mar 22]. Available from: http://tabnet.datasus.gov. br/cgi/deftohtm.exe?sim/cnv/obt10uf.def
urinary incontinence were the most prevalent, regard-less of gender or age.
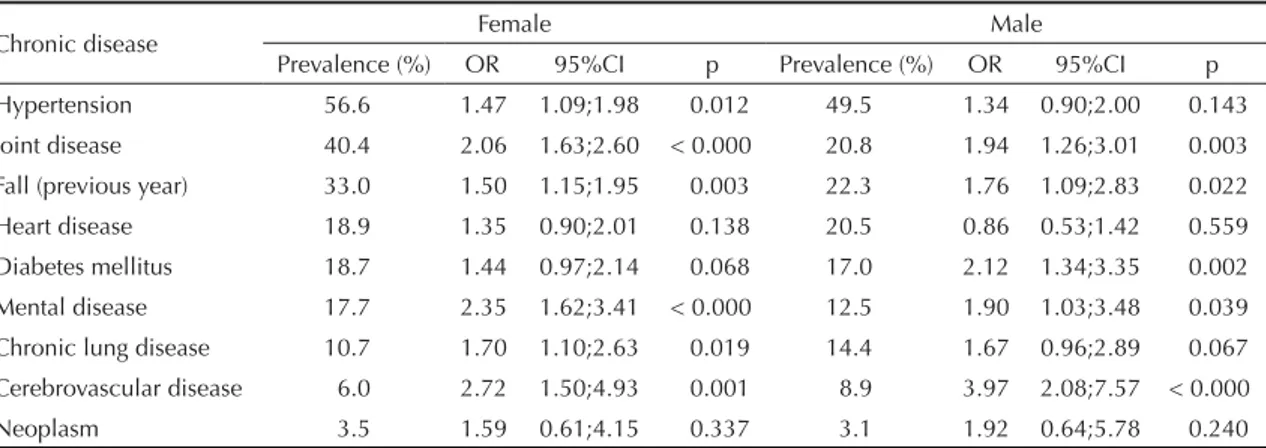
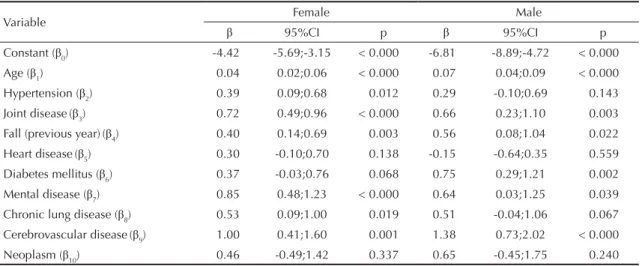
Table 1 displays the prevalence of chronic diseases and disability. For both genders, the most prevalent diseases, in decreasing order, were hypertension, joint disease, falls and heart disease, with higher values among the women. Among women, the most debili-tating diseases were cerebrovascular disease, mental illness and joint disease, with odd ratios ranging from 2 to 3. Among men, these diseases were also among the most debilitating and the highest odd ratios were for cerebrovascular disease (3.97) and diabetes (2.12). The coeffi cients estimated by the logistic regression (βs) for disability on at least one basic activity of daily living are displayed according to gender in Table 2. These parameters represent the disabling impact of each disease in the elimination analysis. Cerebrovascular disease was the most disabling one for both genders (Table 2). However, the effect of eliminating a disease on the disability prevalence depended not only on the disabling impact but also on its prevalence (Table 1).
Tables 3 and 4 display the changes in health expec-tancy values with the elimination of chronic diseases among women and men, respectively. In absolute terms, the gains in LE and DFLE were larger in the younger age group (60 to 74 years old) in both genders. In relative terms (%DFLE in LE), the gains were higher among those aged 75 or older. For women in both age groups, the eliminated conditions that would generate the greater proportion of years lived free of disabilities were heart disease, diabetes mellitus and hypertension (Table 3). For men at age 60, these conditions were heart disease, hypertension and falls (Table 4). Among men aged 75 or older, the eliminated conditions that would generate the greater proportion of years lived free of disabilities were heart disease, hypertension and chronic pulmonary disease (Table 4).
DISCUSSION
The results show that the elimination of chronic diseases would lead to gains in disability-free life expectancy between the ages of 60 and 74. Although not of the same magnitude, the elimination of chronic disease beginning at 75 years of age would contribute to converting years of disability into years free of disability.
Regarding women in both age groups, the elimina-tion of chronic diseases would lead to a reducelimina-tion in life expectancy with disability (LE-D), signifying an absolute compression of morbidity and consequent gain in years to be lived without disability. The magnitude of this fi nding was greater in the younger age group (60 to 74 years). The data on DFLE in LE for women exhibited inverse behavior: for both age groups, the elimination of chronic diseases would increase the percentage of DFLE in LE, signifying a relative compression of morbidity, which would be greater in the older age group (Table 3).
Using heart disease as an example (Table 3), its elimi-nation at age 60 would imply a gain of 2.72 years in life expectancy among women. Moreover, these years gained would simultaneously correspond to a gain of 8.55 years of DFLE and a reduction of 5.83 years in LE-D. The greater gain in DFLE in relation to the gain in LE signifi es a compression of morbidity. Among men (Table 4), changes in LE and DFLE in both age groups would vary depending on the disease eliminated. At the age of 60, all diseases eliminated would lead to an increase in LE-D, which signifi es an absolute expansion of morbidity, although these values are lower than the corresponding values for women. On the other hand, as the elimination of chronic diseases would lead to an increase in the percentage of DFLE in LE, a relative compression of morbidity would be expected (also at percentages far below those found among women). One may therefore say that the gains in LE would be greater among men than women, but at the cost of an
Table 1. Prevalence of chronic diseases and odds ratios for disability on basic activities of daily living according to gender. Sao Paulo, Southeastern Brazil, 2000.
Chronic disease Female Male
Prevalence (%) OR 95%CI p Prevalence (%) OR 95%CI p
Hypertension 56.6 1.47 1.09;1.98 0.012 49.5 1.34 0.90;2.00 0.143
Joint disease 40.4 2.06 1.63;2.60 < 0.000 20.8 1.94 1.26;3.01 0.003 Fall (previous year) 33.0 1.50 1.15;1.95 0.003 22.3 1.76 1.09;2.83 0.022
Heart disease 18.9 1.35 0.90;2.01 0.138 20.5 0.86 0.53;1.42 0.559
Diabetes mellitus 18.7 1.44 0.97;2.14 0.068 17.0 2.12 1.34;3.35 0.002 Mental disease 17.7 2.35 1.62;3.41 < 0.000 12.5 1.90 1.03;3.48 0.039 Chronic lung disease 10.7 1.70 1.10;2.63 0.019 14.4 1.67 0.96;2.89 0.067 Cerebrovascular disease 6.0 2.72 1.50;4.93 0.001 8.9 3.97 2.08;7.57 < 0.000
absolute expansion in morbidity and a smaller conver-sion of years with disability into years without disability (relative compression of morbidity).
At 75 or older, a reduction in LE-D would occur among men with the elimination of systemic arterial hyperten-sion and heart disease, which indicates an absolute compression of morbidity, although these values would be small. As the other chronic diseases increased LE-D upon being eliminated, there would 'be an absolute expansion of morbidity. However, as all disease elimi-nated would lead to an increase in the percentage of DFLE in LE, there would be a relative compression of morbidity for all conditions. As with the female gender, the relative compression of morbidity among men would be greater in the more advanced age group. The diseases that would lead to an absolute compression of morbidity (arterial hypertension and heart disease) are those that would also lead to a greater relative compression upon being eliminated. However, the absolute gains and losses
are small and relative compression appears to be more signifi cant in this age group.
Analyzing studies carried out in other countries, the elim-ination of chronic diseases would lead to the compression of morbidity in some situations.29 Data from Australia
indicate that the elimination of circulatory disease from the elderly population would lead to greater gains in years of healthy living in both men and women, followed by the elimination of neoplasms in men and musculoskeletal disease in women.22 Similar results are found in a study
carried out in the United Kingdom, with the exception of gains obtained from the elimination of accidents and poisoning in both genders.33
In the Netherlands, the elimination of heart disease, arthritis and lower back pain would lead to greater gains in DFLE. Arranging the diseases in terms of impact, differences were noted between genders. The elimination of heart disease would have the greatest
Table 2. Parameters (βs) estimated by multiple logistic regression for disability on basic activities of daily living among elderly individuals according to gender. Sao Paulo, Southeastern Brazil, 2000.
Variable Female Male
β 95%CI p β 95%CI p
Constant (β0) -4.42 -5.69;-3.15 < 0.000 -6.81 -8.89;-4.72 < 0.000
Age (β1) 0.04 0.02;0.06 < 0.000 0.07 0.04;0.09 < 0.000
Hypertension (β2) 0.39 0.09;0.68 0.012 0.29 -0.10;0.69 0.143
Joint disease(β3) 0.72 0.49;0.96 < 0.000 0.66 0.23;1.10 0.003 Fall (previous year)(β4) 0.40 0.14;0.69 0.003 0.56 0.08;1.04 0.022
Heart disease(β5) 0.30 -0.10;0.70 0.138 -0.15 -0.64;0.35 0.559
Diabetes mellitus (β6) 0.37 -0.03;0.76 0.068 0.75 0.29;1.21 0.002 Mental disease (β7) 0.85 0.48;1.23 < 0.000 0.64 0.03;1.25 0.039 Chronic lung disease (β8) 0.53 0.09;1.00 0.019 0.51 -0.04;1.06 0.067 Cerebrovascular disease(β9) 1.00 0.41;1.60 0.001 1.38 0.73;2.02 < 0.000
Neoplasm (β10) 0.46 -0.49;1.42 0.337 0.65 -0.45;1.75 0.240
Table 3. Life expectancy, disability-free life expectancy, life expectancy with disability, and proportion (%) of years lived free of disability resulting from elimination of chronic diseases among female elderly individuals according to age group. Sao Paulo, Southeastern Brazil, 2000.
Chronic disease
Women at age 60 years Women 75 + years
LE DFLE LE-D DFLE
in LE (%) LE DFLE LE-D
DFLE in LE (%)
Hypertension 2.15 7.90 -5.75 27.05 1.04 4.72 -3.68 32.33
Joint disease 2.00 7.09 -5.09 24.27 0.99 4.19 -3.20 28.56
Fall (previous year) 1.99 7.75 -5.76 27.00 0.99 4.67 -3.68 32.22
Heart disease 2.72 8.55 -5.83 27.70 1.20 4.98 -3.78 33.32
Diabetes mellitus 2.26 8.03 -5.77 27.20 1.07 4.78 -3.71 32.55
Mental disease 2.04 6.85 -4.81 23.15 1.01 4.01 -3.00 27.08
Chronic lung disease 2.16 7.61 -5.45 25.86 1.05 4.52 -3.47 30.74
Cerebrovascular disease 2.44 6.83 -4.39 21.19 1.15 3.89 -2.74 25.37
Neoplasm 3.04 8.46 -5.42 26.29 1.24 4.77 -3.53 31.51
impact among men, whereas the elimination of arthritis and lower back pain would have the greatest impact among women. Similar results were found in this population for individuals aged 65 or older, with the exception of the fi nding regarding heart disease, the elimination of which did not imply either a relative expansion or compression of morbidity.25 In Denmark,
a study involving an elderly population found that the elimination of fatal diseases (such as cardiovascular disease) would lead to a relative compression of morbidity, whereas an absolute compression would be achieved with the elimination of non-fatal diseases, such as osteoarticular diseases.5 In the USA, the
elimi-nation of deaths due to heart disease would result in greater gains in life expectancy (three years for men and four years for women at 70 years of age); most gains in DFLE occurred at 70 years of age, while this trend changed with the advance in years, as the elimination of heart disease among very elderly indi-viduals would lead to the addition of more years with disability than without disability.14,24
In Brazil, research on life expectancy has demon-strated the negative impact of disability on the health of older adults and its differential effects on women as evidenced by their higher disabled life expectancy.2,6
One limitation of the present study is the presupposition of independence in causes of death. However, informa-tion on multiple causes of death is not widely available and this limitation will continue to be diffi cult to over-come until greater knowledge is acquired regarding the relationship of dependence among different causes of death in Brazil.11,31 Furthermore, the presupposition of
independence may have led to an overestimation of the reduction in mortality at more advanced ages, when the coexistence of several diseases becomes more frequent. The fact that some diseases are risk factors for others could lead to the underestimation of the fi nal cause of
death. Moreover, as groups of diseases were considered (e.g., joint diseases), no consideration was given to the fact that different diseases have different impacts in terms of disability depending on the age group.
It is important to emphasize that the study of mortality of elderly persons according to underlying causes of death may be adversely affected by the high propor-tion of ill-defi ned causes. However, a study using the System of Information on Mortality of the Ministry of Health showed that there was a 35% decrease in the occurrence of these causes in the elderly population between 1996 and 2005.16
Another limitation concerns the fact that the probability of death was not related to disability in the regression analysis. Moreover, the fact that disability can predis-pose an individual to fatal disease was not taken into account (e.g., disability stemming from cerebrovascular disease can lead to pneumonia, with a consequent increase in the mortality rate).
Self-reported information can lead to biases in the results. However, previous studies on the elimination of diseases have involved self-reported diagnoses.24,25
Studies carried out in Brazil show the validity of self-reported information in detecting health conditions. Cardiovascular disease and diabetes appear to be adequately reported by individuals due to the universal coverage of the Brazilian public health system.4,20
Another aspect to consider concerns the non-inclusion of institutionalized elderly individuals, which may have led to the overestimation of the effect of eliminating chronic disease for this population, as such individuals could be living in institutions for reasons other than chronic diseases and their consequences.
The lack of longitudinal data and the use of prevalence rates based on Sullivan’s method have disadvantages
Table 4. Life expectancy, disability-free life expectancy, life expectancy with disability, and proportion (%) of years lived free of disability resulting from elimination of chronic diseases among male elderly individuals according to age group. Sao Paulo, Southeastern Brazil, 2000.
Chronic disease
Men at age 60 years Men 75 + years
LE DFLE LE-D in LE (%)DFLE LE DFLE LE-D in LE (%)DFLE
Hypertension 6.95 6.71 0.24 6.02 3.61 3.67 -0.06 11.14
Joint disease 6.79 6.38 0.41 5.18 3.57 3.47 0.10 9.83
Fall (previous year) 6.80 6.44 0.36 5.40 3.57 3.52 0.05 10.16
Heart disease 7.86 7.74 0.12 7.14 3.78 4.06 -0.28 13.12
Diabetes mellitus 7.02 6.50 0.52 4.91 3.63 3.47 0.16 9.52
Mental disease 6.84 6.43 0.41 5.21 3.58 3.49 0.09 9.89
Chronic lung disease 7.13 6.70 0.43 5.38 3.67 3.60 0.07 10.26
Cerebrovascular disease 7.33 6.47 0.86 3.81 3.71 3.33 0.38 8.04
Neoplasm 8.12 7.32 0.80 4.69 3.86 3.66 0.20 9.66
when considering changes in mortality and disability among the elderly population over time.3 However,
when disease-related mortality and disability are eliminated simultaneously, the dynamic effects of these transformations in a particular population no longer exist. Moreover, due to their simplicity, life tables in a number of studies have been calculated using Sullivan’s method, which is the most widely used technique in different countries, thereby facili-tating future comparisons.21
Future studies should employ a longitudinal design, which would permit a better understanding of the relationships between different chronic diseases and transitions in health status, especially with regard to functional capacity.2 Moreover, studies addressing the
multi-causality of deaths and relationships between multi-morbidity and functional capacity could contribute toward the understanding of the compression of morbidity in this population.11,31
Based on the fi ndings of the present study, the elimina-tion of chronic diseases from the elderly populaelimina-tion could lead to a compression of morbidity in men and women at both 60 years of age and 75 years of age or older. Greater gains in disability-free life expectancy
would occur in the female gender, leading to an absolute compression of morbidity. Among those aged 75 or older, gains in disability-free life expectancy could occur due to a relative compression of morbidity.
The health strategies necessary to attain morbidity compression, it was conjectured, would be based largely on postponement of ill-health by prevention of chronic disease. Proof of its possibility comes from studies that have identifi ed solid approaches toward a plan to accomplish morbidity compression.7,10 A strategy
should have goals of (1) never smoking, no obesity, never sedentary (primordial prevention); (2) increasing exercise, reducing smoking, reducing obesity and also moderating other health risks (primary prevention); (3) within the medical model, goals must include reduction in cholesterol, hypertension, diabetes, time to fi rst heart attack (secondary prevention); (4) morbidity-reducing intervention, such as total knee replacements, cataract extraction, and many others (tertiary prevention).10
The Compression of Morbidity paradigm is a base to assess health gains and losses and may assist in plan-ning prevention programs. Moreover, this is a necessary precedent for healthier aging, which in turn completes a vision of improved heath throughout the life cycle.
1. Albala C, Lebrão ML, León Díaz EM, Ham-Chande R, Hennis AJ, Palloni A, et al. Encuesta Salud, Bienestar y Envejecimiento (SABE): metodología de la encuesta y perfi l de la población estudiada.
Rev Panam Salud Publica. 2005;17(5-6):307-22.
DOI:10.1590/S1020-49892005000500003
2. Andrade FCD, Guevara PE, Lebrão ML, Duarte YAO, Santos JLF. Gender differences in life expectancy and disability-free life expectancy among older adults in São Paulo, Brazil. Womens Health Issues. 2011;21(1):64-70. DOI:10.1016/j.whi.2010.08.007
3. Barendregt JJ. Incidence and prevalence-based SMPH: making the Twain Meet. In: Murray CJL, Salomon JA, Mathers CD, Lopez AD, editors. Summary measures of population health: concepts, ethics, measurement and applications. Geneva: World Health Organization; 2002. p.221-31.
4. Barreto SM, Figueiredo RC. Chronic diseases, self-perceived health status and health risk behaviors: gender differences.
Rev Saude Publica. 2009;43(Suppl 2):1-9.
DOI:10.1590/S0034-89102009000900006
5. Brønnum-Hansen H, Juel K, Davidsen M. The burden of selected diseases among older people in Denmark. J Aging Health. 2006;18(4):491-506. DOI:10.1177/0898264305286074
6. Camargos MCS, Rodrigues RN, Machado CJ. Expectativa de vida saudável para idosos brasileiros, 2003. Cienc Saude Coletiva. 2009;14(5):1903-9. DOI:10.1590/S1413-81232009000500032
7. Crimmins EM, Beltrán-Sánchez H. Mortality and morbidity trends: is there compression of morbidity?
J Gerontol B Psychol Sci Soc Sci. 2011;66(1):75-86. DOI:10.1093/geronb/gbq088
8. Deeg DJH, Verbrugge LM, Jagger C. Disability measurement. In: Robine JM, Jagger C, Mathers CD, Crimins EM, Suzman RM, editors. Determining health expectancies. Chichester: John Wiley & Sons; 2003. p.203-19.
9. Fries JF. Aging, natural death and the compression of morbidity. N Engl J Med. 1980;303(3):130-5. 10. Fries JF, Bruce B, Chakravarty E. Compression of
morbidity 1980-2011: a focused review of paradigms and progress. J Aging Res. 2011;2011:261702. DOI:10.4061/2011/261702
11. Furukawa TS, Santo AH, Mathias TAF. Multiple causes of death related to cerebrovascular diseases in the State of Paraná, Brazil. Rev Bras
Epidemiol. 2011;14(2):231-9.
DOI:10.1590/S1415-790X2011000200005.
12. Gotlieb SLD. Mortalidade diferencial por causa, São Paulo, Brasil, 1970: tábuas de vida de múltiplo decremento. Rev Saude Publica. 1981;15(4):401-17. DOI:10.1590/S0034-89101981000400006
13. Gutiérrez-Fisac JL, Gispert R, Solà J. Factors explaining the geographical differences in Disability Free Life Expectancy in Spain. J Epidemiol Community Health. 2000;54(6):451-5. DOI:10.1136/jech.54.6.451 14. Hayward MD, Crimmins EM, Saito Y. Cause of death
and active life expectancy in the older population of
Article based on the doctoral thesis of Alessandro Gonçalves Campolina, presented the Faculdade de Saúde Pública da
Universidade de São Paulo, 2012.
The authors declare that there are no confl icts of interest. the United States. J Aging Health. 1998;10(2):192-213. DOI:10.1177/089826439801000205 15. Jagger C, Cox B, Le Roy S, Robine JM, Van Oyen
H, Cambois E, et al. Health expectancy calculation by the Sullivan method: a practical guide. 3.ed. Montpellier: EHEMU; 2007. (EHEMU Technical Report, 2006 -3).
16. Jorge MHPM, Laurenti R, Lima-Costa MF, Gotilieb SLD, Chiavegatto Filho ADP. A mortalidade de idosos no Brasil: a questão das causas mal defi nidas. Epidemiol Serv Saude. 2008;17(4):271-81. DOI:10.5123/S1679-49742008000400004
17. Kramer M. The rising pandemic of mental disorders and associated chronic diseases and disabilities.
Acta Psychiatr Scand. 1980;62(S285):382-97.
DOI:10.1111/j.1600-0447.1980.tb07714.x 18. Lebrão ML, Laurenti R. Saúde, bem-estar e
envelhecimento: o estudo SABE no município de São Paulo. Rev Bras Epidemiol. 2005;8(2):127-41. DOI:10.1590/S1415-790X2005000200005 19. Manton KG. Changing concepts of morbidity and
mortality in the elderly population. Milbank Mem Q
Health Soc. 1982;60(2):183-244.
20. Marcopito LF, Rodrigues SSF, Pacheco MA, Shirassu MM, Goldfeder AJ, Moraes MA. Prevalence of a set of risk factors for chronic diseases in the city of São Paulo, Brazil. Rev Saude Publica. 2005;39(5):738-45. DOI:10.1590/S0034-89102005000500007
21. Mathers CD, Robine JM. How good is Sullivan’s method for monitoring changes in population health expectancies? J Epidemiol Community Health. 1997;51(1):80-6.
22. Mathers CD. Gain in health expectancy from the elimination of diseases among older people. Disabil
Rehabil. 1999;21(5-6):211-21.
23. Mathers CD, Ezzati M, Lopez AD, Murray CJL, Rodgers A. Causal decomposition of summary measures of population health. In: Murray CJL, Salomon JA, Mathers CD, Lopez AD, editors. Summary measures of population health: concepts, ethics, measurement and applications. Geneva: World Health Organization; 2002. p.273-90. 24. Mathers CD. Cause-deleted health expectancies.
In: Robine JM, Jagger C, Mathers CD, Crimmins
EM, Suzman RM, editors. Determining health expectancies. Chichester: John Wiley & Sons; 2003. p.149-74.
25. Nusselder WJ, Van der Velden K, Van Sonsbeek JLA, Lenior ME, Van den Bos GAM. The elimination of selected chronic diseases in a population: the compression and expansion of morbidity. Am J Public
Health. 1996;86(2):187-94.
26. Nusselder WJ. Compression of morbidity. In: Robine JM, Jagger C, Mathers CD, Crimmins EM, Suzman RM, editors. Determining health expectancies. Chichester: John Wiley & Sons; 2003. p.35-58.
27. Omran AR. The epidemiologic transition: a theory of the epidemiology of population change. Milbank Mem
Fund Q. 1971;49(4):509-38.
28. Omran AR. The epidemiologic transition theory: a preliminary update. J Trop Pediatr. 1983;29(6):305-16. DOI:10.1093/tropej/29.6.305
29. Perenboom RJM, Van Oyen H, Mutafova M. Health expectancies in European countries. In: Robine JM, Jagger C, Mathers CD, Crimins EM, Suzman RM, editors. Determining health expectancies. Chichester: John Wiley & Sons; 2003. p.359-76.
30. Rao JNK, Scott AJ. On Chi - squared tests for multiway contingency tables with cell proportions estimated from survey data. Ann Stat. 1984;12(1):46-60.
31. Rezende EM, Sampaio IBM, Ishitani LH, Martins EF, Vilella LCM. Mortalidade de idosos com desnutrição em Belo Horizonte, Minas Gerais, Brasil: uma análise multidimensional sob o enfoque de causas múltiplas de morte. Cad Saude Publica. 2010;26(6):1109-21. DOI:10.1590/S0102-311X2010000600005
32. Schmidt MI, Duncan BB, Azevedo e Silva G, Menezes AM, Monteiro CA, Barreto SM, et al. Saúde no Brasil 4. Doenças crônicas não transmissíveis no Brasil: carga e desafi os atuais. Lancet. 2011:61-4. DOI:10,1016/S0140-6736(11)60135-9.
33. Strong K, Mathers C, Leeder S, Beaglehole R. Preventing chronic diseases: how many lives can we save? Lancet. 2005;366(9496):1578-82. DOI:1016/S0140-6736(05)67341-2
34. Sullivan DF. A single index of mortality and morbidity.