EIullPa~r Am Health Organ 13(3). 1979.
LIFE EXPECTANCY TRENDS IN COSTA RICA’
Hugo Villegas2 and Carlos A. Valverde3
This article presents an analysis of lzye expectancy trends in Costa Rica from the early 1970s to 1976. The methodology employed was developed with the help of the Latin American Center for Demography (CELADE). The findings obtained re- veal that the average Costa Rican life span grew very rapidly in this period-a time when major efforts were being made to extend health sel-vices to underserved population groups.
One goal of Costa Rica’s 1971-1980 Na-
tional Health Plan was “to increase life
expectancy at birth between 2.87 and 2.92
years by 1980, which would yield a life
expectancy between 71.02 and 71.07 years
for those born in that year” (I).
For the purpose of working toward this
goal, an exhaustive analysis of mortality
trends, by age group, and the possibilities
for reducing them in the specified time was
carried out in 1973 with the help of the
Latin American Center for Demography
(CELADE). The study gave due considera-
tion to the development of health service
programs and to the level and structure of
mortality in 1972 (2). On this basis, from
among a total of 21 initial alternatives for
reducing mortality, a selection was made of
intermediate objectives deemed feasible
within the context of the National Health
Plan. These were:
1) To reduce mortality among infants
(subjects under 1 year of age) by 30 per
cent.
2) To reduce mortality among children
1 to 4 years of age between 50 and 55 per
cent.
3) To reduce mortality among children
over 5 years of age and among adults in
‘Also appearing in Spanish in the R&tin de la Oficina Sanitaria Panamericana, 1979.
2PAHO/WH0 Consultant in Health Services De- velopment, Costa Rica.
SAssistant Director of Rural Health, Ministry of Health, Costa Rica.
accord with the reductions possible under
“normal” conditions as set forth in model
United Nations tables (2, 3).
General mortality declined markedly in
Costa Rica from 1950 to 1973. Over this
23-year period life expectancy at birth for
both sexes rose from 55.7 to 68.3 years,
registering an average annual gain of
slightly more than half a year of life ex-
pectancy for each calendar year.
On the basis of the life tables constructed for 1950, 1963, and 1973, life expectancy
estimates were drawn up for the period
1950-2000. These estimates singled out
1970-1975 as the five-year period of greatest
estimated gain -this gain corresponding to
2.77 years overall or an average increase of
0.55 years in each calendar year. Estimated
gains for subsequent periods were progres-
sively smaller, because of the progressively
higher base levels of life expectancy
achieved. The various estimated gains and
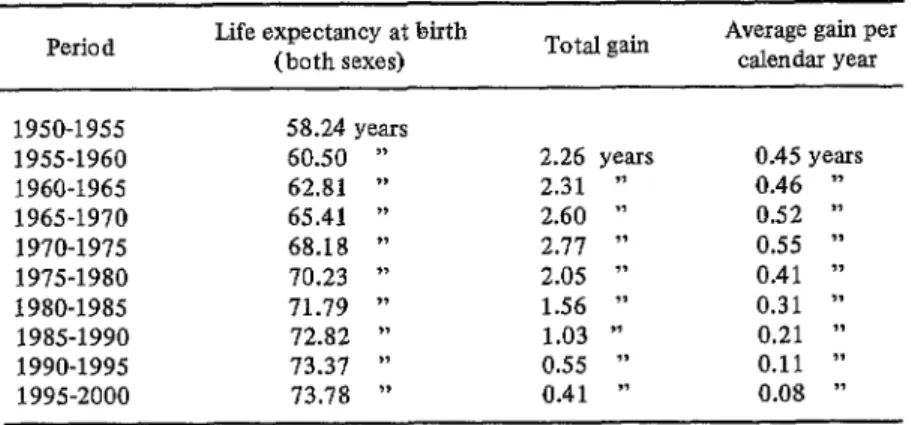
base levels are shown in Table 1 (4-6).
In order to evaluate the extent to which
National Health Plan activities were har-
monizing with the aim of raising life ex-
pectancy, and also to assess the effectiveness
of the plan’s principal strategy (extension
of health service coverage to rural commu-
nities), comparisons were drawn between
mortality data for 1970-1972 (before the
rural health program began) and 1974-1976
(when the program was in full swing). The
activities of the rural health program in-
cluded control of communicable diseases
254
PAHO BULLETIN l vol.13, no. 3, 1979
Table 1. Past and projected Costa Rican life expectancy at birth, 1950-2000. Period Life expectancy (both sexes) at birth Total gain Average gain per calendar year
1950-1955 58.24 years
1955-1960 60.50 ”
1960-1965 62.81 ”
1965-1970 65.41 ”
1970-1975 68.18 ”
1975-1980 70.23 ”
1980-1985 71.79 ”
1985-1990 72.82 ”
1990-1995 73.37 ‘)
1995-2000 73.78 ”
2.26 years 2.31 ” 2.60 ” 2.77 ” 2.05 ” 1.56 ” 1.03 ” 0.55 ” 0.41 ”
0.45 years 0.46 ” 0.52 ” 0.55 ” 0.41 ” 0.31 ” 0.21 ”
0.11 ”
0.08 ”
Sources: References (5) and (6).
(malaria, intestinal parasitic diseases, and
diseases preventable by vaccination), basic
environmental sanitation, and timely ma-
ternal and child care (encompassing nutri-
tion work, periodic monitoring, first aid,
and health education).
This CELADE-Ministry of Health study
(7) revealed significant changes. The ex-
tent of these changes, in turn, was found
to vary in accord with two factors: the
degree of health coverage in individual
communities and the time elapsed since
these coverage activities began. Tables de-
rived from these data showed life expect-
ancy at birth for each respective period to
be 67.71 and 71.15 years. In other words,
there had been an apparent gain of 3.44
years overall, equivalent to 0.86 years in
each calendar year. This increase is re-
markable-not only because of the unpre-
cedented size of the average yearly gain,
but also because life expectancy in Costa
Rica was high to begin with, and so the
possibilities for gain were relatively small.
Pursuing the matter further, 20 life
tables were constructed. These included:
l Two tables for the country as a whole
(1970-1972 and 1974-1976).
l Ten tables for groups of cantons4 clas-
4The geographic subdivision below the province level. (Costa Rica is organized successively into pro-
vinces, cantons, and districts.)
sified according to the degree of coverage
afforded the population by the rural
health program. (For each period, five
groups of cantons were considered-those
not covered by the program; those receiv-
ing less than 25 per cent coverage; and
those receiving coverages of 25 to 50 per
cent, 51 to 75 per cent, and over 75 per cent.)
l Eight tables for groups of cantons clas-
sified according to the time elapsed since
the start of the rural health program. (For
each period, the four groups of cantons
considered were those where the program
was in its first, second, third, and fourth
years.)
The calculations made were based on un-
corrected registered deaths in order to fa-
cilitate comparability. This was considered
reasonable in view of the relative complete-
ness of death statistics in Costa Rica (under-
registration was less than 8 per cent in the
period 1963-1973) (4). The results showed
that the gains made were associated with
both the degree of coverage provided and
the time elapsed since the rural health pro-
gram began. Particularly marked gains
were seen where coverage exceeded 50 per
cent and also where the program had been
underway for three or more years. When
either of these conditions applied, average
Villegas and Valverde
l LIFE EXPECTANCY TRENDS IN COSTA RICA 255posted sharp gains averaging over one year groups in the 10 to 29 age range. (One
of increased life expectancy per calendar principal reason for this exception, at least
year. Table 2 provides a sampling of the in the upper part of the age range, was that
observed gains. traffic accident rates rose in this period.)
Comparing the 1980 target established by
the National Health Plan with these re-
sults-obtained five years after initiation
of the health service extension program at
the national levels -supports the conclu-
sion that the 1980 target has been surpassed
and that the country has broken through
the ‘IO-year life expectancy barrier. This
event had not been expected until about
the end of the decade.
All in all, the data (see Table 3) show
that as of 1976 the following progress had
been made toward the reduced mortality
goalssetin 1973-intermediategoalsdeemed
essential, in terms of available alternatives
and estimates, for achieving the increased
life expectancy desired.
In general, these results closely follow
the pattern of the three alternatives selected
when the 1980 life expectancy target was
established in 1972. This indicates that the
methodology employed is a useful one, and
that making periodic estimates (with such
adjustments as the annual data may sug-
gest) could prove a valuable tool in setting
goals for health service programs designed
to reduce mortality and alter its composi-
tion.
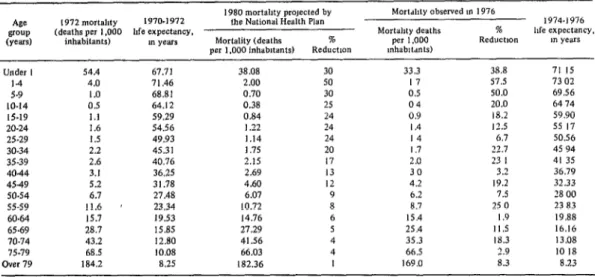
1) Infant mortality fell 38.8 per cent be-
tween 1972 and 1976.
2) Mortality among children 1 to 4 years
of age declined by 57.5 per cent.
3) Mortality among people over 5 years
of age was reduced by more than the pro-
jected amounts in most cases-except for
‘Activities at the local level began in 1973.
The results also confirmed an assumption
used in the rural health program. This
assumption was that the greatest changes
would occur in places where the program
had been active for two years, in areas
where coverage was provided to at least 50
per cent of the population, and in areas
where the full range of program activities
were underway. A prime reason for
making the assumption was that in these
areas community participation occurs with-
in a framework of concerted activity di-
rected at overall development, thereby pro-
viding the driving force behind the health
improvement effort.
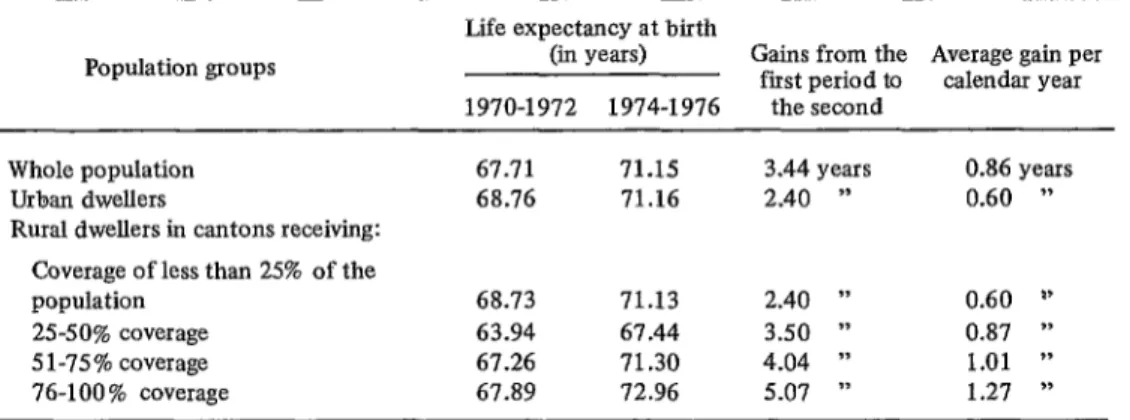
Table 2. Gains in life expectancy at birth in the cantons of Costa Rica, grouped by degrees of coverage
of the rural health program,* in the years 1970-1972 and 1974-1976.
Population groups
Life expectancy at birth
(in years) Gains from the Average gain per first period to calendar year 1970-1972 1974-1976 the second
Whole population Urban dwellers
Rural dwellers in cantons receiving:
67.71 71.15 3.44 years 0.86 years
68.76 71.16 2.40 ” 0.60 ”
Coverage of less than 25% of the population
2%50% coverage 5 l-75% coverage
76-100 % coverage
68.73 71.13 2.40 ” 0.60 I’
63.94 67.44 3.50 ” 0.87 ”
67.26 71.30 4.04 ” 1.01 ”
67.89 72.96 5.07 ” 1.27 ”
Source: Reference (7)
256
PAHO BULLETIN.
vol. 13, no. 3, 1979
Table 3. Costa Rican mortality and life expectancy, by age group. in 1972:reduciions in mortality projected for 1980,and reduction observed in 1976.
A@ !3OUP (Years)
Under I 14 5-P IO-14 15.19 20.24 25.29 30.34 35-39 4044 4.549 50.54 55.59 60.64 65.69 70.74 75-79 Over 79
1980 m~rtabty prowted by Mortdhty observed I” I976
1972 mortabty 1970.1972 the National Health Plan ~ 1974.1976
(deaths per 1,000 bfe expectancy, Mart&y deaths % hfe expectancy.
inhabitants) m years Mortality (deaths % per 1,000 Reduction m years
per 1,000 inhabltanls) Reduction mhah&mts)
54.4 67.71 38.08 30 33.3 38.8 71 15
4.0 71.46 2.00 50 17 57.5 73 02
1.0 68.81 0.70 30 0.5 50.0 69.56
0.5 64.12 0.38 25 04 20.0 64 74
1.1 59.29 0.84 24 0.9 18.2 59.90
1.6 54.56 I .22 24 I .4 12.5 55 17
1.5 49.93 1.14 24 I4 6.7 50.56
2.2 45.31 1.75 20 I .7 22.7 45 94
2.6 40.76 2.15 I7 2.0 23 I 41 35
3.1 36.25 2.69 I3 30 3.2 36.79
5.2 31.78 4.60 I2 4.2 19.2 32.33
6.7 27.48 6.07 9 6.2 7.5 28 00
11.6 ’ 23.34 10.72 8 8.7 25 0 23 83
15.7 19.53 14.76 6 15.4 I.9 19.88
28.7 IS.85 27.29 5 25.4 I I.5 16.16
43.2 12.80 41.56 4 35.3 IS.3 13.08
68.5 10.08 66.03 4 66.5 2.9 IO I8
184.2 8.25 182.36 I 169.0 8.3 8.23
Sources. Direccdn General de Estadlstica. Estodistrco vrml, 1972. 1976,and CELADE, Esradm sobrr esperonro dc vrdo en Cosro Rue, 1972.
SUMMARY
A fundamental goal of Costa Rica’s 1971-1980 National Health Plan was to boost average life expectancy at birth by roughly six months in each calendar year, so as to push average life expectancy above 71 years in 1980. This was to be accomplished principally through special programs for extending health services to underserved parts of the population.
To help assess the effectiveness of this health coverage effort, the Latin American Center for Demography and Costa Rica’s Ministry of
Health conducted a joint study comparing mor- tality data for 1970-1972 and 1974-1976. Among other things, the study indicated that life ex- pectancy at birth rose from 67.71 years in 1970-1972 to 71.15 years in 1974-1976. More- over, the gains made in particular regions tended to rise as health coverage became com- plete and after the coverage program had been underway for some time. The study thus re- vealed achievement of greater gains than those expected.
REFERENCES (I) Ministerio de Salud de Costa Rica. Plan National de Salud, 1971-1980. San Jose, 1970. pp. 1-17.
(2) S%enz J., L. Formulation of goals for life expectancy at birth in Costa Rica (report of one experience). BuEE Pan Am Health Organ 9:3_45- 352, 1975,
(3) United Nations. Age and Sex Patterns of Mortality: Model Life-Tables for Under-Devel- oped Countries. Document ST/SOA/Series A/ 22, New York, 1955.
(4) Centro Latinoamericano de Demografia (CELADE) y Direction General de Estadis-
tica y Censos de Costa Rica. Eualuacidn de1 censo de 1973 y proyeccidn de la poblacio’n par sexo y grupos de edad, 1950-2000. San Jose, 1976.
(5) CELADE. Boletin Demogrdfico 9(18), 1976.
(6) CELADE y Direction General de Estadis- tica y Censos de Costa Rica. Tablas de vidu de Costa Rica, 1972-1974. San Jose, 1976.