www.atmos-chem-phys.net/13/4997/2013/ doi:10.5194/acp-13-4997-2013
© Author(s) 2013. CC Attribution 3.0 License.
Atmospheric
Chemistry
and Physics
Geoscientiic
Geoscientiic
Geoscientiic
Geoscientiic
Characterization of urban aerosol in Cork city (Ireland) using
aerosol mass spectrometry
M. Dall’Osto1,*, J. Ovadnevaite1, D. Ceburnis1, D. Martin1, R. M. Healy2, I. P. O’Connor2, I. Kourtchev2,**, J. R. Sodeau2, J. C. Wenger2, and C. O’Dowd1
1School of Physics and Centre for Climate and Air Pollution Studies, Ryan Institute, National University of Ireland Galway,
Galway, Ireland
2Department of Chemistry and Environmental Research Institute, University College Cork, Cork, Ireland *now at: Institute for Environmental Assessment and Water Research (IDAEA-CSIC), Barcelona, Spain **now at: Department of Chemistry, University of Cambridge, Lensfield Road, Cambridge, UK
Correspondence to:M. Dall’Osto (manuel.dallosto@gmail.com)
Received: 31 July 2012 – Published in Atmos. Chem. Phys. Discuss.: 19 November 2012 Revised: 17 April 2013 – Accepted: 18 April 2013 – Published: 15 May 2013
Abstract.Ambient wintertime background urban aerosol in Cork city, Ireland, was characterized using aerosol mass spectrometry. During the three-week measurement study in 2009, 93 % of the ca. 1 350 000 single particles charac-terized by an Aerosol Time-of-Flight Mass Spectrometer (TSI ATOFMS) were classified into five organic-rich par-ticle types, internally mixed to different proportions with elemental carbon (EC), sulphate and nitrate, while the re-maining 7 % was predominantly inorganic in nature. Non-refractory PM1aerosol was characterized using a High
Res-olution Time-of-Flight Aerosol Mass Spectrometer (Aero-dyne HR-ToF-AMS) and was also found to comprise organic aerosol as the most abundant species (62 %), followed by ni-trate (15 %), sulphate (9 %) and ammonium (9 %), and chlo-ride (5 %).
Positive matrix factorization (PMF) was applied to the HR-ToF-AMS organic matrix, and a five-factor solution was found to describe the variance in the data well. Specifically, “hydrocarbon-like” organic aerosol (HOA) comprised 20 % of the mass, “low-volatility” oxygenated organic aerosol (LV-OOA) comprised 18 %, “biomass burning” organic aerosol (BBOA) comprised 23 %, non-wood solid-fuel com-bustion “peat and coal” organic aerosol (PCOA) comprised 21 %, and finally a species type characterized by primary
m/zpeaks at 41 and 55, similar to previously reported “cook-ing” organic aerosol (COA), but possessing different diurnal variations to what would be expected for cooking activities, contributed 18 %.
Correlations between the different particle types obtained by the two aerosol mass spectrometers are also discussed. Despite wood, coal and peat being minor fuel types used for domestic space heating in urban areas, their relatively low combustion efficiencies result in a significant contribution to PM1aerosol mass (44 % and 28 % of the total organic aerosol
mass and non-refractory total PM1, respectively).
1 Introduction
A substantial number of studies have shown a strong rela-tionship between levels of particulate air pollution and a va-riety of adverse health indicators (Pope and Dockery, 2006; Dockery et al., 1993; Fenger, 1999). Current air quality stan-dards (WHO, 2005) for particulate matter (PM) are based on total mass in a specific size range (PM10 or PM2.5),
al-though exposures to particles from different sources may po-tentially elicit different health effects or exposure–response relationships (Harrison et al., 2000). PM is known to com-prise a variety of different chemical components, each with their own sources, behaviours and impacts (Pio et al., 2007). The formulation of cost-effective abatement strategies for at-mospheric pollution strongly depends on knowledge of the contributions of individual source categories.
Within the European Union (EU), wide variations in PM10
Southern Europe, and the contribution of sea salt to PM10
is largest in Northwestern Europe, while the ratio total car-bon / PM10is generally largest in Central Europe (Putaud et
al., 2010). In the air quality directive (2008/EC/50), the Eu-ropean Commission has set two limit values for PM10mass
concentration for the protection of human health: the daily mean value may not exceed 50 µg m−3more than 35 times in a year and the annual mean value may not exceed 40 µg m−3. In Ireland during 2009, all monitoring stations were compli-ant with this legislation (EPA, 2010). For example, in Cork, a city of about 120 000 inhabitants, the average PM10 mass
concentration was 18±10 µg m−3 and the daily limit was exceeded only six times. The average PM2.5 concentration
at the same monitoring location (Old Station Road, Cork) for the year 2009 was 8 µg m−3, but during winter months was found much higher (up to 80 µg m−3). Previous work revealed that in urban Irish areas, the major components con-tributing to fine particle mass were, in order of the largest contributions, organic carbon (OC), elemental carbon (EC), and ammonium sulphate/ammonium nitrate (Yin et al., 2005; Ceburnis et al., 2006). More recently, Hellebust et al. (2010) identified shipping, sea salt, crustal material and secondary inorganic aerosols as sources of PM2.5in Cork city. In a more
detailed study, Healy et al. (2010) reported six predominant PM sources: traffic (23 %), marine (13 %), long-range trans-port (13 %), general combustion (11 %), domestic combus-tion (4.5 %) and shipping (1.5 %); but this study was con-ducted in August where domestic solid fuel (DSF) burning was at a minimum. By contrast, Kourtchev et al. (2011) re-ported that DSF burning contributed up to 74.9 % of the mea-sured OC mass concentration during the winter season.
The objective of this study is to characterize the fine PM component detected at an urban background site in Cork using an array of on-line and off-line aerosol techniques in order to improve the source identification of aerosol at very high time resolution in the atmosphere. Two different state-of-the-art on-line aerosol mass spectrometers were de-ployed: ATOFMS (Aerosol Time-of-Flight Mass Spectrom-eter) and HR-ToF-AMS (High Resolution Time-of-Flight Aerosol Mass Spectrometer). The ATOFMS provides sin-gle particle information on the abundance of different types of aerosol particles as a function of particle size with high time resolution, whereas the AMS quantitatively measures mass concentrations of the non-refractory aerosol compo-nents as well as species-resolved size distributions. Whilst the ATOFMS does not have clear source apportionment capa-bilities due to the difficulties in quantification of its outputs, the AMS has proven itself to be a powerful tool for this pur-pose (Canagaratna et al., 2007). Additionally, we also used data from off-line filter-based techniques to support the par-ticle types obtained from the statistical analysis of the aerosol mass spectrometry datasets.
2 Experimental
2.1 Location
The campaign took place from 1–22 February 2009 (all times in this study are in local time – LT) at the Tivoli Industrial Estate and Docks, Cork, Ireland (51◦54′5 N, 8◦24′38 W, see Fig. S1 in the Supplement). A detailed description of the site is given elsewhere (Healy et al., 2009; Hellebust et al., 2010). Briefly, the site is located in the Port of Cork, approximately 3 km east of Cork city centre. Shipping berths are located 400–600 m to the southwest, while the main road carrying traffic east out of the city and towards Dublin lies 200 m to the north of the site. Residential areas immediately surround the site on all sides except the north and northeast. Air qual-ity data from the monitoring station in the cqual-ity centre (Old Station Road, 3 km from the monitoring site) were also used in order to compare them with the data obtained in this study.
2.2 Off-line aerosol techniques
PM2.5 aerosol samples were collected on Pallflex Tissue
quartz fibre filters (150 mm diameter, pre-fired for 24 h at 580◦C) using a high-volume (Digitel) sampler with a flow rate of 500 L min−1. The sampling was conducted from 2 to 22 February 2009 at 6 h resolution. The filters were extracted and analysed by gas chromatography/mass spec-trometry (GC/MS) as described in Kourtchev et al. (2011). Briefly, a part of the quartz fibre filter, 6–12 cm2 depend-ing on the OC loaddepend-ing, was spiked with 0.5 µg of the inter-nal recovery standard methyl-β-D-xylanopyranoside (MXP) and left to dry for 30 min before being extracted three times with 20 mL of dichloromethane-methanol (80 : 20, v / v) under ultrasonic agitation for 30 min. The filtrates were combined, reduced to approximately 1 mL with ro-tary evaporation at 35◦C and filtered through a Teflon fil-ter (0.45 µm). The filtrate was transferred to a 2 mL glass vial and evaporated to dryness under a gentle stream of ni-trogen. The residue was derivatized by the addition of 50 µL of N,O-bis(trimethylsilyl)trifluoroacetamide containing 1 % trimethylchlorosilane (BSTFA+1 % TMCS) and 30 µL pyri-dine, and heated at 70◦C for 1 h. After cooling to room tem-perature, an aliquot of 1 µL was analysed by GC/MS in elec-tron ionization (EI) mode.
The employed GC/MS method was optimized for determi-nation of polar organic compounds that are markers for fun-gal spores, isoprene, α-, β-pinene oxidation products, and biomass burning. During the winter period, only biomass burning compounds, i.e. levoglucosan, galactosan and man-nosan, were detected and quantified. The concentrations, time trends and contribution of these polar compounds to the OC are reported in Kourtchev et al. (2011). Furthermore, PM2.5 aerosol samples were also chemically characterized
(Dionex ICS-2000) providing concentrations for fluoride, chloride, bromide, nitrate and sulphate.
2.3 On-line aerosol techniques
A TEOM (tapered element oscillating microbalance, Thermo Electron model 1400a) was deployed on-site for the measure-ment of PM2.5 mass concentrations. The TEOM data were
scaled with collocated gravimetric measurements during the field study. PM2.5 and PM10 data were also available from
the monitoring station at Old Station Road in Cork city cen-tre (EPA, 2009). EC and OC mass concentrations were mea-sured using a thermal-optical carbon aerosol analysis instru-ment (Sunset Laboratory Inc., field model 3rd generation) fit-ted with a PM2.5cyclone. The system uses a modified version
of the National Institute for Occupational Safety and Health (NIOSH) 5040 thermal-optical protocol during analysis, to provide time-resolved OC/EC splits on a semi-real-time ba-sis.
The ATOFMS (Model 3800-100, TSI, Inc.) was used to measure bipolar mass spectra of individual aerosol particles (Gard et al., 1997). Ambient aerosol is focused into a narrow particle beam in the aerodynamic lens. Using a 2-laser ve-locimeter, particle sizes are determined from particle velocity after acceleration into the vacuum, providing – with appro-priate ATOFMS size calibration – a size range of 0.1 to 3 mi-crometers (Gard et al., 1997). In addition, the light scattered by the particles is used to trigger a pulsed high-power desorp-tion and ionizadesorp-tion laser (λ= 266 nm,≈1 mJ pulse−1) which evaporates and ionizes the particle in the centre of the ion source of a bipolar reflectron ToF-MS (m/1m 600). Thus, a positive and negative ion mass spectrum are obtained for each single particle.
The HR-ToF-AMS focuses particles in the size range 50– 600 nm onto a hot surface (about 600◦C) using an aerody-namic lens assembly (De Carlo et al., 2006). Non-refractory particle components flash-evaporate on the hot surface; the evolving vapour is electron impact (70 eV) ionized, and the ions are transported into an orthogonal extraction ToF-MS for high-resolution mass analysis. The HR-ToF-AToF-MS was deployed in the standard configuration, taking both mass spectrum (MS) and particle time-of-flight (pToF) data. The instrument was alternatively run in “V-mode” (with a mass resolution of up to 3000 m/1m) and “W-mode” by us-ing a second reflectron, which increases resolution to 6000 m/1m but decreases sensitivity by approximately one or-der of magnitude. Standard ionization efficiency and size calibrations were performed during the campaign, includ-ing particle time-of-flight calibration to convert the particle flight times into particle diameters and to determine the in-strument background parameters by measurements through a high-efficiency particulate air filter (HEPA filter) during the campaign (De Carlo et al., 2006). The mass spectrometers utilized the same sample inlet fitted with a PM2.5 cyclone,
situated on the roof of the trailer containing the instruments,
at a height of about 4 m above ground. A quarter-inch internal diameter stainless steel tube led inside the trailer to a mani-fold. From there the sample air was dried before arriving to the instruments, efficiently sampling particles at sizes below the cyclone PM2.5cut-offs.
2.3.1 Mass spectrometers’ data processing
ATOFMS
The ATOFMS collected about 1 350 000 single particle pos-itive and negative mass spectra. The TSI ATOFMS dataset was imported into YAADA (Yet Another ATOFMS Data An-alyzer) and single particle mass spectra were clustered with Adaptive resonance theory neural network, ART-2a (Song et al., 1999). The parameters used for ART-2a were learn-ing rate 0.05, vigilance factor 0.85, and iterations 20. Sim-ilar clusters obtained by ART-2a were manually merged (Dall’Osto and Harrison, 2006) so that the total number of clusters describing the whole dataset was reduced to ten. HR-ToF-AMS
Mass concentrations and size distributions of the aerosol species measured with the HR-ToF-AMS were calculated using the methods outlined by DeCarlo et al. (2006). Stan-dard ToF-AMS data analysis software packages (SQUIR-REL v1.49 and PIKA v1.08) were used. For mass concentra-tion calculaconcentra-tions, an empirical particle collecconcentra-tion efficiency (CE) factor of 0.5 was used, already widely found to be rep-resentative for ambient particles in many AMS studies (Jayne et al., 2000; Canagaratna et al., 2007), and the value of 0.5 was further validated by good inter-comparison with off-line ion mass concentration measurements obtained in this study (see Sect. 3.4.1). The HR-ToF-AMS organic matrix was anal-ysed by positive matrix factorization (PMF), a bilinear un-mixing model that identifies factors which serve to approx-imately reconstruct the measured organic mass spectra for each point in time (Ulbrich et al., 2009). Each factor is com-prised of a (constant) mass spectrum and a time series of mass concentration, and all values in the factors are con-strained to be positive. The model is solved by minimizing the sum of the weighed squared residuals of the fit (known as Q). The PMF model was solved with the PMF2.exe al-gorithm v.4.2 using as inputs the high-resolution OA mass spectral matrix and associated error matrix (Paatero and Tap-per, 1994).
2.4 Other techniques
A suite of real-time gas analysers was located at the site for the duration of the campaign: SO2, NO/NOxand O3 were
Meteorological data were also obtained from the monitoring stations in the city centre, Port of Cork and Cork Airport. The meteorological data overall compared well, but the most complete and reliable set of measurements were found to be from Cork Airport and were used in this study.
2.5 Peat and coal burning experiment
In order to facilitate the quantification of the relative con-tribution of different domestic fuel sources to ambient PM1
levels, a series of controlled experiments were undertaken to obtain mass spectra of peat and coal combustion. A con-trolled combustion experiment for each of the fuel types was performed, with each fuel burned for approximately 40 min in an outdoor grate and with fresh combustion particles intro-duced into the HR-ToF-AMS. The grate was open to ambient air without temperature control. The ambient conditions rep-resented very clean air masses, as indicated by the following mass concentrations (in µg m−3) observed by AMS: organic aerosol∼0.3, NO−3 ∼0.02, SO2−4 ∼0.8 and NH+4 ∼0.3. The coal used was smokeless coal, which is a legal prerequisite for burning coal in Cork city as it is a designated smoke-less fuel zone. Emissions were diluted to∼30 µg m−3 with filtered ambient air. Peat, which is used extensively in Ire-land for domestic space heating, was obtained locally, and concentrations were repeated twice with very similar results; therefore, the mass spectra maintained∼100 µg m−3. All ex-periments were presented in this study represent them/z av-erages over the both experiments.
3 Results
3.1 Meteorology
The air mass back trajectories were calculated using HYS-PLIT (Draxler and Rolph, 2003) analysis. The results are pre-sented in Table S1, where the sampling days were classified as continental-marine Polar (cmP, 6 days), continental Po-lar (cP, 2 days), marine Arctic (mA, 4 days) and marine Po-lar (mP,10 days). Taking the approach of Rimetz-Planchon (2008) – investigating PM10 pollution episodes associated
with meteorological situations in an urban and industrialized coastal site of the southern part of the North Sea – and by considering both air mass back trajectories and local me-teorology, two different scenarios of seven days each were identified: stagnant air mass conditions (days 1–3 and 16–19 February, named “stagnant” period, Period S.) and cold ma-rine air mass (consecutive days: 5–11 February, named “ma-rine” period, Period M.). It should be noted that the temporal trend of sea spray ATOFMS particle type (see Sect. 3.3) was also used to validate the two different scenarios. It should be noted that air arriving from the Atlantic Ocean will in many cases have traversed part of Ireland and therefore collected pollution to some degree before reaching the site. However, the main significance ofmPair masses is that they are faster
moving and therefore cause enhanced dilution of local pol-lutants. Period M. is characterized by colder Atlantic air masses (2.7±2◦C) and stronger winds (4.9±2 m s−1)
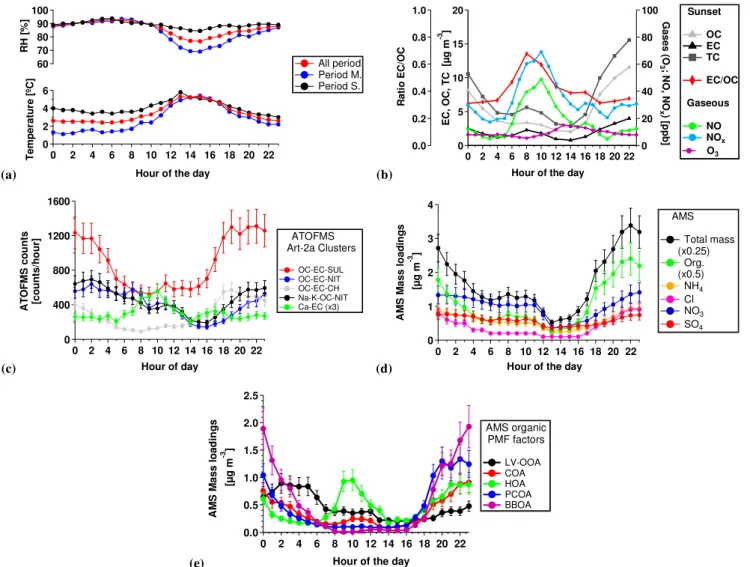
rel-ative to Period S. (4.9±3◦C and 3.7±2 m s−1, respectively, Fig. S3 and Table 1a). Figure 1a shows the diurnal profiles for the relative humidity (RH) and temperature (T). The Period M. scenario presents a stronger day–night variation period (4.3◦C) relative to Period S. (1.9◦C).
3.2 Air quality parameters: PM and gaseous concentrations
PM10mass concentration limit values were not exceeded in
the city of Cork during the field study, with a daily aver-age mean value PM10 of 24±10 µg m−3 (Table 1c).
Dur-ing Period S., levels of PM (both PM2.5 and PM10) and
nitrogen gaseous pollutants were higher than during Period M., likely due to the low average wind speed (Table 1b, c). The mass concentration of PM2.5 at the port was on
aver-age 4.1 µg m−3lower than at the city centre site. However, Fig. S2 shows higher PM2.5values at the port on 4, 6, 11, and
18 February, due to enhanced specific local emissions (see Sect. 3.3). Gaseous concentrations for NO and NO2 were
19±6 µg m−3 and 18±6 µg m−3 and presented maximum values, as well as the ratio EC / OC (0.37±0.2 µg m−3), dur-ing traffic rush hours (see Fig. 1b, data are averages for the entire study period). Ozone values (average for all field study, 9±5 µg m−3) were found to moderately increase between 11:00 and 16:00 (local time), due to the limited photochem-ical activity encountered during colder months in the North-ern European latitudes. SO2 concentrations were generally
low (1.74±0.4 µg m−3). However, seven spikes of elevated SO2concentrations (hourly values of 3–6 µg m−3) were
de-tected during the field study, which were associated with a specific particle type detected with the aerosol mass spec-trometers and thus attributed to local ship emissions as dis-cussed in Sect. 4.2.
3.3 Single particle mass spectrometry analysis
(a) 6 4 2 0 T e m p e ra tu re [º C ] 22 20 18 16 14 12 10 8 6 4 2 0
Hour of the day 100 90 80 70 60 R H [ % ] All period Period M. Period S. (b) 20 15 10 5 0 E C , O C , T C [µ g m -3 ] 22 20 18 16 14 12 10 8 6 4 2 0
Hour of the day 1.0 0.8 0.6 0.4 0.2 0.0 R a ti o E C /O C 100 80 60 40 20 0 G a s e s (O 3; N O , N O x) [p p b ] Sunset OC EC TC EC/OC Gaseous NO NOx O3 (c) 1600 1200 800 400 0 A T O F M S c o u n ts [c o u n ts /h o u r] 22 20 18 16 14 12 10 8 6 4 2 0
Hour of day
ATOFMS Art-2a Clusters OC-EC-SUL OC-EC-NIT OC-EC-CH Na-K-OC-NIT Ca-EC (x3) (d) 4 3 2 1 0 A M S M a s s l o a d in g s [µ g m -3 ] 22 20 18 16 14 12 10 8 6 4 2 0
Hour of the day
AMS Total mass (x0.25) Org. (x0.5) NH4 Cl NO3 SO4 (e) 2.5 2.0 1.5 1.0 0.5 0.0 A M S M a s s l o a d in g s [µ g m -3 ] 22 20 18 16 14 12 10 8 6 4 2 0
Hour of the day
AMS organic PMF factors LV-OOA COA HOA PCOA BBOA
Fig. 1.Diurnal profiles of(a)temperature and RH,(b)sunset and gaseous measurements,(c)ATOFMS main particle types,(d)AMS mass loadings and(e)AMS PMF factors.
– OC-EC-SUL (organic carbon - elemental carbon - sul-phate; 37.8 %). Figure 2a shows an average positive mass spectrum with peaks due to OC (m/z27, 37, 43, 50) and EC (m/z 12, 36, 48, 60) and negative spec-tra dominated by sulphate (m/z −97) (Dall’Osto and Harrison, 2006). This cluster was found to comprise the strongest sulphate signature, with a size distribution centred at 250 nm diameter and a diurnal trend (Fig. 1c) peaking during the evening (19:00–23:00), pointing to-wards a domestic combustion source.
– OC-EC-NIT (organic carbon – elemental carbon – ni-trate; 9.4 %). Figure 2b shows a positive mass spectrum similar to OC-EC-SUL, but a stronger signal due to ni-trate (m/z −46 and −62) is observed in the negative spectrum. This particle type presented a larger size dis-tribution occurring at 400 nm and, in contrast with the OC-EC-SUL temporal trend, exhibits a later nighttime peak (Fig. 1c). This particle type can be attributed to the
condensation of nitrate on existing aerosols caused by nighttime boundary layer dynamics.
– OC-EC-CH (organic carbon - elemental carbon - hy-drocarbon rich; 22.6 %). This particle type, internally mixed with both nitrate and sulphate, contained a unique feature in terms of high CxHypeaks withm/z37
([C3H]+) representing the strongest base peak (Fig. 2c).
The negative spectrum also displays characteristic peaks of primary hydrocarbon species (m/z peaks in-cluding −24, −25 and −26; [CxHy]−). Additionally,
Table 1.Averages (±1 standard deviation) for entire field study and for the two selected temporal periods (S. and M.) of (a) meteorological parameters, (b) gaseous concentrations, (c) particulate mass, (d) Sunset instrument, (e) AMS aerosol mass loadings, (f) AMS PMF organic factors and (g) ATOFMS ART-2a particle types.
Class Parameters ALL Period S. (Stagnant) Period M. (Marine) Ratio periods S/M
(a) Meteorological Temp (◦C) 4±3 4.9±3 2.7±2 1.5
parameters RH (%) 87±9 89±8 83±10 1.1
WS (m s−1) 4±2 3.7±2 4.9±2 0.7
Pressure (bar) 1015±15 1018±15 1003±9 1
Rain (mm) 0.025±0.2 0.06±0.2 0.03±0.1 2
(b) Gaseous SO2 1.74±0.4 1.94±0.4 1.60±0.3 1.2
concentrations NO 19±6 20±27 13±25 1.4
(µg m−3) NO2 18±6 19±10 12±25 1.4
O3 9±5 8±5 11±6 0.7
(c) Particulate PM2.5port 13±7 14±7 12±6 1.2
mass PM2.5city 16±8 18±6 14±5 1.2
(µg m−3) PM10city 24±14 27±9 22±6 1.2
(d) Sunset EC 1.99±1 1.9±1 1.7±1 1.1
OC&EC mass OC 5.3±2 5.1±2 4±2 1.2
loadings TC 7.3±3 7.0±3 5.7±1 1.1
(µg m−3) EC/OC 0.37±0.2 0.37±0.2 0.43±0.25 0.8
(e) AMS AMS org. 4.3±2 (62 %) 4.7±2 (57 %) 3.4±2 (70 %) 1.4
mass AMS nit. 1.0±0.5 (15 %) 1.2±0.5 (15 %) 0.6± 0.3 (12 %) 1.9
loadings AMS sul. 0.6±0.2 (9 %) 1.0±0.3 (12 %) 0.3±0.3 (7 %) 3.5
(µg m−3) AMS amm. 0.6±0.3(9 %) 0.8±0.3 (10 %) 0.3±0.2 (7 %) 2.4
AMS chl. 0.4±0.2 (5 %) 0.5±0.1 (6 %) 0.2±0.1 (6 %) 2.0
(f) AMS PMF LV-OOA 0.78±0.4 (18 %) 1.12±0.3 (23 %) 0.38±0.3 (11 %) 2.9
organic COA 0.76±0.3 (18 %) 0.87±0.5 (18 %) 0.50±0.3 (15 %) 1.7
factor HOA 0.84±0.4 (20 %) 0.97±0.3 (20 %) 0.77±0.3 (23 %) 1.2
(µg m−3) PCOA 0.92±0.3 (21 %) 0.77±0.5 (16 %) 1.09±0.4 (32 %) 0.7 BBOA 0.98±0.4 (23 %) 1.13±0.5 (23 %) 0.63±0.3 (19 %) 1.8
(g) ATOFMS OC-EC-SUL 1009±394 849±300 1154±343 0.7
ART-2a OC-EC-NIT 432±231 414±230 349±138 1.2
particle OC-EC-CH 611±269 364±124 1007±265 0.4
types V-NIT 18±7 31±21 6±3 5.3
(count/hour) Na-K-OC-EC 316±88 310±129 245±187 1.3
Ca-EC 124±56 112±87 126±67 0.9
NaCl 81±41 43±32 138±87 0.3
– Ca-EC (calcium – elemental carbon; 4.8 %) The posi-tive ion mass spectrum of Fig. 2d shows a strong peak atm/z40 ([Ca]+), and EC peaks (m/z12, 24, 36, 48, 60) are also observed in both positive and negative mass spectra. This particle type was only detected in the lower size range of the ATOFMS (ca. 150 nm), was found to spike during morning rush hour times (Fig. 1c) and is attributed to lubricating oil from traffic emissions (Spencer et al., 2006; Drewnick et al., 2008).
– NaKOCNIT (sodium potassium organic carbon -nitrate; 17.9 %). This particle type (Fig. 2e) was found internally mixed with both inorganic species, such as sodium (m/z 23) and potassium (m/z 39), and OC
(m/z 12, 27, 36, 37, 43, 50). It contains less intense EC peaks relative to the other ATOFMS particle types (Fig. 2a, b, c) and a size distribution peak centred at about 400 nm. The diurnal profile of this particle type is very similar to the other nitrate-rich particle type pre-sented (OC-EC-NIT), and is strongly enhanced during nighttime hours (Fig. 1c). It is likely these two parti-cle types are nitrate-containing partiparti-cles with different inorganic–organic mixing state.
– NaCl (sodium chloride; 3.0 %). Figure 2f shows peaks at m/z 23 ([Na]+), m/z 81 ([Na2Cl]+) and nitrate
Table 2.ATOFMS particle types.
General ATOFMS ATOFMS cluster Possible source attribution N particle %
Organic
OC-EC-SUL Domestic fuel combusion 505 096 37.8
OC-EC-CH Domestic fuel combusion (peat) 302 445 22.6
OC-EC-NIT Secondary aerosol internally mixed with EC 132 985 9.4 Na-K-OC-NIT Secondary aerosol internally mixed with EC 155 202 17.9
Ca-EC Traffic 64 681 4.8
Inorganic
NaCl Sea salt 40 445 3.0
V-NIT Shipping 9228 0.7
V-K-SUL Shipping 2411 0.2
Spikes Ca-dust Road dust 1984 0.1
EC-POS Local combustion 607 0.04
Nitrate-chloride Negative spectrum only Unknown 36 538 2.7
Unclassified Unclassified Unclassified 84 322 6.3
TOTAL 1 335 944 100.0
particles internally mixed with nitrate (Dall’Osto et al., 2004), and these particles exhibit the largest size mode of all the ATOFMS particle types (>1 µm).
– Ca-Dust (calcium-dust; 0.1 %). Figure 2g shows peaks due to Na (m/z 23), Ca (m/z 40), Fe (m/z 56), Cl (m/z−35) and nitrate (m/z−62). This particle type also exhibits a coarse mode (>1 mum), was observed during short events on 4, 9, 11 and 18 February, mainly during morning times, and is likely to be due to resuspension of dust (Guazzotti et al., 2003).
– EC-POS (elemental carbon - phosphate; 0.1 %). Fig-ure 2h shows EC signals (m/z12, 36, 60) in the pos-itive mass spectrum and a strong peak atm/z 79 due to phosphate ([PO3]−) in the negative spectrum. This
particle type presented a size distribution mode in the finest ATOFMS fraction at about 200 nm, and has pre-viously been attributed to lubricating oil from vehicles (Spencer et al., 2006). It was found to spike on 10, 14 and 20 February, mainly during morning times, and is attributed to highly localized vehicle emissions. Whilst cluster Ca-EC was found to be associated with traffic emissions in this study (see diurnal profile on Fig. 1c), the EC-POS type was found to be more localized, likely due to a nearby anthropogenic combustion source, e.g. a generator or passing truck.
– V-NIT (vanadium-nitrate; 0.7 %). Figure 2i shows the positive mass spectrum with a strong vanadium signa-ture (m/z51 [V]+and 67 [VO]+) and minor peaks due to carbon (m/z12), K (m/z 39) and Fe (m/z56). The negative mass spectrum shows mainly nitrate (m/z−46 and−62), and, to a lesser extent, sulphate (m/z−97). This particle type was found mainly during Period S. and with a size distribution peak at about 400 nm. We at-tribute this particle type to aged ship emissions/oil
com-bustion particles (Pastor et al., 2003; Dall’Osto and Har-rison, 2006).
– V-K-SUL (vanadium-potassium-sulphate; 0.2 %). Fig-ure 2j shows a vanadium-rich particle type internally mixed with potassium (m/z39) and sulphate (m/z−97). Relative to the other V-rich particle type (V-NIT), it presents a much smaller characteristic size range (250 nm), and its correlation with SO2spikes points to
fresh ship emissions. A more in-depth discussion of V-rich particles can be found in Sect. 4.2.1.
Whilst the AMS has a well-proven capability to quantify generic source-related categories of non-refractory aerosol, the ATOFMS gives mass spectral information for individ-ual particles. Even after clustering particles with similar size distribution and mass spectral characteristics, the ATOFMS presents information which can be very difficult to interpret in relation to sources or atmospheric processing (Dall’Osto and Harrison, 2012). The ATOFMS cannot provide quan-titative aerosol mass loading concentrations, but its unique strength lies in the fact that it can monitor, in real time, variations in the single particle composition (see the tem-poral trends presented in Fig. 3). Only some of the cor-relations between the ATOFMS particle types detected in this study and other measurements (HR-ToF-AMS, off-line techniques, gas measurements) were found to be statistically valid. As expected, Ca-EC correlated with NO (R2= 0.7) and NOx(R2= 0.65), Na-NIT correlated with nitrate (R2= 0.55)
and sulphate (R2= 0.50), while the only particle type that correlated with levoglucosan was EC-OC-SUL (R2= 0.45). Further correlations between ATOFMS particle types and organic particle types obtained by PMF analysis of the HR-ToF-AMS data are discussed in Sect. 4.4.
m/z A T O F M S i n te n s it y ( A rb . u n it s )
0 10 20 30 40 50 60 70 80 90
1 0 0 1 1 0 1 2 0 1 3 0 1 4 0 1 5 0
OC - EC - SUL
12 36
39
97
62 18 27 50 60
m/z A T O F M S i n te n s it y ( A rb . u n it s )
0 10 20 30 40 50 60 70 80 90
1 0 0 1 1 0 1 2 0 1 3 0 1 4 0 1 5 0
OC - EC - NIT
12 36 39
97 62 18 27 50 60
46
(a)
(b)
m/z A T O F M S i n te n s it y ( A rb . u n it s ) 0 1 0 2 0 3 0 4 0 5 0 6 0 7 0 8 0 9 0 1 0 0 1 1 0 1 2 0 1 3 0 1 4 0 1 5 0
OC - EC - CH
12 36 39 97 62 50 60 27 26 36 48 74 37 61 24 60 m/z A T O F M S i n te n s it y ( A rb . u n it s ) 0 1 0 2 0 3 0 4 0 5 0 6 0 7 0 8 0 9 0 1 0 0 1 1 0 1 2 0 1 3 0 1 4 0 1 5 0 Ca-EC 62 40 23 46 24 36 36 48 48 60 12
(c)
(d)
m/z A T O F M S i n te n s it y ( A rb . u n it s )
0 10 20 30 40 50 60 70 80 90
1 0 0 1 1 0 1 2 0 1 3 0 1 4 0 1 5 0 Na-K-OC-NIT 12 36 39 97 62 23 46 50 60 m/z A T O F M S i n te n s it y ( A rb . u n it s )
0 10 20 30 40 50 60 70 80 90
1 0 0 1 1 0 1 2 0 1 3 0 1 4 0 1 5 0 NaCl 23 81 46 62 39
(e)
(f)
m/z A T O F M S i n te n s it y ( A rb . u n it s )
0 10 20 30 40 50 60 70 80 90
1 0 0 1 1 0 1 2 0 1 3 0 1 4 0 1 5 0 Dust-Ca 46 35 40 56 23 16 m/z A T O F M S i n te n s it y ( A rb . u n it s )
0 10 20 30 40 50 60 70 80 90
1 0 0 1 1 0 1 2 0 1 3 0 1 4 0 1 5 0 EC-POS 12 27 60 36 39 62 63 79 97 48
(g)
(h)
m/z A T O F M S i n te n s it y ( A rb . u n it s ) 0 1 0 2 0 3 0 4 0 5 0 6 0 7 0 8 0 9 0 1 0 0 1 1 0 1 2 0 1 3 0 1 4 0 1 5 0 V-NIT 46 62 67 97 51 39 56 12 m/z A T O F M S i n te n s it y ( A rb . u n it s ) 0 1 0 2 0 3 0 4 0 5 0 6 0 7 0 8 0 9 0 1 0 0 1 1 0 1 2 0 1 3 0 1 4 0 1 5 0 V-K-SUL 46 62 67 97 51 39 56 12
(i)
(j)
Fig. 2. (a–j): ATOFMS ART-2a results for the ten particle types (absolute values).
vehicular traffic emissions, respectively. By contrast, it is more difficult to attribute the ATOFMS particle types to spe-cific space heating aerosol sources. A number of ATOFMS studies have previously reported biomass burning particles in ambient air (Pastor et al., 2003; Moffet et al., 2008). Healy et al. (2010) also reported ATOFMS average mass spectral signatures for coal, peat and wood combustion by
measur-ing fresh combustion particles emitted from an outdoor stove. Broadly, peat particles were rich in sodium and hydrocarbon-like species; coal particles were found to have the strongest sulphate signature and the lowest metallic content; and wood positive ATOFMS ion mass spectra were found to be domi-nated by potassium ions (m/z39 [K]+andm/z113 [K2Cl]+).
6
4
2
0
A
M
S
P
M
F
2
/2
3
/2
4
/2
5
/2
6
/2
7
/2
8
/2
9
/2
1
0
/2
1
1
/2
1
2
/2
1
3
/2
1
4
/2
1
5
/2
1
6
/2
1
7
/2
1
8
/2
1
9
/2
2
0
/2
2
1
/2
2
2
/2
Time
5 4 3 2 1 0
A
M
S
m
a
s
s
l
o
a
d
in
g
s
3000
2000
1000
0
A
T
O
F
M
S
c
o
u
n
ts P. Marine
P. Stagnant
ATOFMS Art-2a Clusters OC-EC-SUL OC-EC-NIT OC-EC-CH Na-K-OC-EC Ca-EC AMS PMF Factors
OOA COA HOA PCOA BBOA AMS mass loadings
Nitrate Sulphate Ammonium Chloride
Fig. 3.ATOFMS (counts/hour) and AMS (µg m−3) time series.
C+
n), peaks atm/z37 andm/z55 are often identified as key
features of ATOFMS positive ion mass spectra (Dall’Osto and Harrison, 2006, 2012). The ATOFMS dataset was also queried (threshold value absolute peak area higher than 50) for signals at m/z 213, due to another common ATOFMS biomass marker [K3SO4]+ (Guazzotti et al., 2003), but not
many single particle mass spectra were found containing this ion peak (<0.1 %). However, a number of particles were found containing peaks atm/z113 (1 %),m/z37 (11 %) and
m/z55 (7 %). Table S2 shows the correlations of these three key peaks (m/z 37, m/z 55 and m/z 113) associated with the five main organic ATOFMS particle types. Interestingly, these three peaks do not appear to correlate with traffic emis-sions (Ca-EC) or with nitrate-rich secondary organic parti-cle types (OC-EC-NIT and Na-K-OC-NIT). In contrast, clus-ter OC-EC-CH seems more correlated with potassium chlo-ride ion markers, whilst OC-EC-SUL is more associated with strong hydrocarbon-like species atm/z37 andm/z55.
The temporal nature of the OC-EC-CH particle type sug-gests a combustion source. Additionally, the strongest corre-lation with biomass indicators (m/z 113, [K2Cl]+) as well
as the high similarity with the laboratory spectra obtained by Healy et al. (2010) also suggest a domestic peat com-bustion source. Cluster OC-EC-SUL shows a similarity to ATOFMS mass spectra obtained from burning coal, but the mass spectra do not contain unique marker ions and thus could also be assigned to other sources, possibly including fresh and aged different types of domestic combustion parti-cles. Based on their temporal nature and comparison with the standard spectra reported in the literature, we assign the par-ticles types OC-EC-CH and OC-EC-SUL to domestic fuel combustion sources, with the former being more associated with peat combustion. These particle types contributed up to 60.4 % of the total particles classified, pointing to domestic fuel combustion as the major aerosol source in this study.
3.4 HR-ToF-AMS
3.4.1 Aerosol mass loading and basic analysis
The AMS CE used was 0.5 (Middlebrook et al., 2012). An inter-comparison of chemical species measured by the AMS and those derived from other techniques gave very good correlations with R2 between 0.78 and 0.96 (Fig. S4) and quantitative agreements within 20 %. These comparisons are consistent with previous observations at other urban sites (Takegawa et al., 2005; Salcedo et al., 2006; Sun et al., 2010). Note that the 1:1 correlation of chloride suggests all of it is non-refractory (i.e. in the form of NH4Cl). Overall, 62 % of
the aerosol mass loadings detected by the AMS is organic aerosol, with nitrate contributing 15 %, sulphate and ammo-nium 9 %, and chloride 5 %.
Within the organic fraction, 68 % of the ion signal was due to the [CxH+y]category, followed by [CxHyO1]
+(27 %),
[CxHyO2]+ (2.5 %) and others ([OH]+, [CxHyNzOp]+,
2.5 %). The average concentration found for organic aerosol was 4.3±2.6 µg m−3, nitrate was 1.0±0.7 µg m−3, sulphate was 0.6±0.4 µg m−3, ammonium was 0.6±0.4 µg m−3and chloride was 0.2±0.3 µg m−3. The relatively high amount of chloride relative to other inorganic species is likely to be due to domestic combustion sources during wintertime (Lanz et al., 2010). The diurnal profile of the total aerosol mass measured by the AMS (Fig. 1d) shows a morning peak be-tween 07:00 and 11:00, and an evening peak bebe-tween 18:00 and 23:00. The organic fraction shows a similar pattern, but only the morning peak correlates with that of EC and NO (Fig. 1b), which is primarily due to local traffic emissions.
0.20 0.15 0.10 0.05 0.00
120 110 100 90 80 70 60 50 40 30 20 10
m/z
60x10-3
40 20 0 0.10 0.08 0.06 0.04 0.02 0.00
60x10-3
40 20 0
F
ra
c
ti
o
n
o
f
s
ig
n
a
l
60x10-3
40 20 0
LV-OOA
COA
HOA
PCOA
BBOA
44 28
28 28
44 43
43
44 41 41 39
39 55
55 55
55 60
57
57 69
69
69
67
113 91
Ion family
CxHy+
CxHyNzOp+
CxHyO1+
CxHyO2+
HxOy+
41 41 31 27 15
43
Fig. 4.Mass spectra of the five-factor PMF solution. The ion families of the different factors are shown in ion family box.
contributing to this signal. By contrast, sulphate showed the smallest diurnal variation of all the aerosol species. Ammo-nium also showed lower concentrations in the afternoon, with a diurnal profile in-between nitrate and sulphate (Fig. 1d), likely due to the combined contributions of (NH4)2SO4,
NH4NO3 and NH4Cl. Chloride showed much lower
con-centrations in the afternoon, slowly increasing in concen-tration towards nighttime hours and peaking between 21:00 and 01:00 (Fig. 1d). This is due to a combination of the semi-volatile nature of NH4Cl, the dynamics of the
plane-tary boundary layer (PBL), and the increase in space heating emissions during nighttime (Alfarra et al., 2007).
3.4.2 PMF analysis on AMS organic aerosol (OA) matrix
The PMF analysis was performed for one to seven factors, and is described in detail in Supporting Information. It was found that the PMF solutions with factor numbers greater than five provided no new meaningful information and in-stead resulted in a splitting of the existing factors. The five-factor solution was thus chosen as the optimal solution fol-lowing a number of considerations, including correlations between the chosen AMS PMF solution and measurements taken using the other techniques.
Hydrocarbon-like OA (HOA)
The mass spectrum of HOA (Fig. 4) is dominated by organic fragments for saturated hydrocarbons [CnH2n+1]+ (m/z29,
43, 57, 71) and unsaturated hydrocarbons [CnH2n−1]+
(m/z 27, 41, 55, 69, 83). Table S3 shows this factor pos-sesses the strongest correlations among all factors with hy-drocarbon peaks atm/z43 ([C3H7]+),m/z55 ([C4H7]+) and
m/z57 ([C4H9]+). This factor is very similar to previously
re-ported reference spectra of primary organic aerosol emitted
Table 3.Fraction of OA components to four ion categories for the five AMS factors.
AMS factor
Family LV-OOA COA HOA PCOA BBOA
CxHy 0.02 0.71 0.87 0.78 0.68
CxHyO1 0.56 0.25 0.10 0.18 0.24
CxHyO2 0.35 0.03 0.00 0.01 0.06
HO 0.06 0.02 0.01 0.02 0.00
CxHyNzOp 0.01 0.00 0.00 0.01 0.01
Total 1.00 1.00 1.00 1.00 1.00
from gasoline and diesel combustion sources (Canagaratna et al., 2004) and the spectra of HOA components determined at other sites (Aiken et al., 2009; Mohr et al., 2012;R2= 0.8). In addition, HOA was the only factor to correlate with traf-fic tracers such as NOx(R2= 0.39) and the unique ATOFMS
traffic particle type Ca-EC (R2= 0.35) (Table S5). However, it was not well correlated with EC (R2= 0.32), implying ad-ditional sources of such species. Factor HOA presented a pronounced morning peak associated with traffic emissions (Fig. 1e). Table 3 illustrates that HOA has a dominant frac-tion of the organic mass spectra due to the [CxHy]+category
(87 %). HOA on average accounts for 20 % of the total OA mass for the whole campaign (Fig. S6), and it contributes 26 % of the [CxHy]+total signal, making it the largest
con-tributor.
Low-volatility oxygenated OA (LV-OOA)
The mass spectrum of LV-OOA (Fig. 4) illustrates a domi-nant peak atm/z44 ([CO2]+), similar to the more oxidized
2 % of the spectra associated with the [CxHy]+ ion
cate-gory and 56 % associated with [CxHyO1]+ (Table 3).
Ta-ble S3 confirms the strongest correlation between this fac-tor andm/z44 ([CO2]+,R2= 0.64) and the weakest
corre-lations with hydrocarbon [CxHy]+species. This is the most
oxygenated of all OA components and its mass spectra ap-pear to represent an end product of OA oxidation (Jimenez et al., 2009). Our results, consistent with previous studies at various sites (Zhang et al., 2005; Lanz et al., 2007; Ul-brich et al., 2009; Sun et al., 2010), show very good cor-relations between LV-OOA and secondary inorganic species (Table S5): nitrate (R2= 0.79), ammonium (R2= 0.77) and sulphate (R2= 0.75). Further support for this factor can be seen in the strongest correlation among all factors between LV-OOA and two ATOFMS organic-rich particle types inter-nally mixed with nitrate (OC-EC-NIT and Na-K-OC-NIT) often considered as markers of secondary or aged aerosols (Dall’Osto and Harrison, 2012). The LV-OOA factor presents the least-marked diurnal variation (Fig. 1e) of all factors, peaking mainly during nighttime and likely driven mainly by boundary layer dynamics and possibly chemical processing. LV-OOA, on average, accounts for 18 % of the total OA mass for the whole campaign, and it is the main contributor to the total signal of [CxHyO1]+(38 %) and [CxHyO2]+(45 %).
Biomass burning OA (BBOA)
The identification of a BBOA component is often driven by a prominent contribution ofm/z60 (Fig. 4), which is regarded as a tracer ion of biomass burning aerosols (Alfarra et al., 2007; Aiken et al., 2009) and not present in HOA. High-resolution analysis of the mass spectra obtained confirms that almost all the signal at this ion for ambient and source datasets is due to [CxHyO2]+ (Aiken et al., 2009; Mohr et
al., 2009). Table S3 shows high correlations between BBOA andm/z60 (R2= 0.99) in addition to correlations atm/z55 ([C3H3O]+,R2= 0.95) andm/z57 ([C3H5O]+,R2= 0.99). It
is important to note that the other ion peak usually associated with BBOA (m/z 73; Alfarra et al., 2007) was removed from this analysis due to excessively large residuals at thism/z.
Regarding the [CxHy]+ ion peaks, BBOA was found to
correlate best withm/z29 ([C2H5]+),m/z39 ([C3H3]+) and
m/z41 ([C3H5]+) (Table S3), while the peak at m/z43 is
mainly composed of the oxidized component [C3H2O]+.
In contrast to HOA, the peaks at m/z55 and m/z 57 con-tain both [CxHy]+([C4H7]+and [C4H9]+) and [CxHyO1]+
([C3H3O]+and [C3H5O]+) families (Fig. 4).
When the time series of the BBOA factor is compared to other on-line and off-line measurements (Table S5), BBOA presents an excellent correlation with chloride (R2= 0.87), and markers of biomass burning (levoglucosan,R2= 0.80; K,
R2= 0.65) supporting the assignment of the BBOA. The di-urnal variation of this factor prevailing during night also con-firms a domestic biomass burning source (Fig. 1e). BBOA was found to be the most abundant of all five AMS organic
factors (23 %), with a mass spectrum dominated by [CxHy]+
ions (68 %), followed by [CxHyO1]+(24 %) and [CxHyO2]+
(6 %). Overall, it was found to contribute to 20 %, 24 % and 14 % to the total ion signal of [CxHy]+, [CxHyO1]+ and
[CxHyO2]+, respectively. In summary, AMS BBOA marker
(m/z60) is consistent with previous results which indicate that, although it is not a completely conserved tracer, at least a fraction of it persists during aging and it remains a good marker for BBOA (De Carlo et al., 2010). Further discus-sions on this AMS PMF factor can be found in Sect. 4.
Peat and coal OA (PCOA)
The PCOA factor shows a similar sequence of peaks to HOA atm/z41, 43, 55 and 57, which suggests a combustion source (Fig. 4). However, while them/z43 is mainly attributed to the [CxHy]+ family (75 %), peaks due to [CxHyOz]+ are
seen atm/z28 and 44. Additionally, this factor presents an aromatic signature with strong peaks atm/z69, 77, 91 and 115 (McLafferty et al., 1993). Table S3 shows that factor PCOA presents the strongest correlation among all clusters, with the ion peak atm/z39 ([C3H3]+). Table S5 shows good
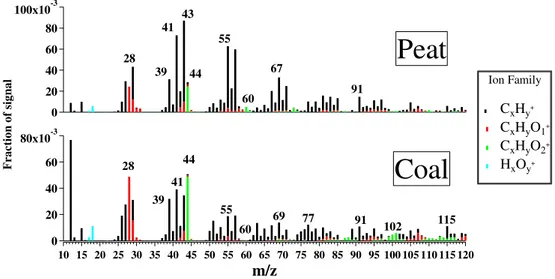
correlations with biomass markers (levoglucosan,R2= 0.84; K,R2= 0.50). However, while the BBOA factor correlates more with chloride, the PCOA factor correlates more with bromide (R2= 0.75, Table S5) and EC (R2= 0.80, Table S5). Furthermore, factor PCOA shows weak although unique cor-relations with two specific ATOFMS particle types (OC-EC-SULR2= 0.35 and OC-EC-CHR2= 0.29, Table S5). The di-urnal trends are slightly different to that observed for BBOA, peaking more during evening times (18:00–21:00) and then decreasing while BBOA concentrations continue to increase (Fig. 1e). This would imply that this factor is more dominant during earlier hours rather than during all night like BBOA. In summary, we attribute this factor to solid fuel combustion not associated with wood biomass burning. In order to further validate our domestic solid fuel source attribution, we com-pare the PCOA factor with the reference BBOA spectra (Ul-brich et al., 2012), and with AMS mass spectra obtained from the controlled experiments of peat and coal burning obtained in this study. Firstly, the standard AMS reference spectra for the BBOA factor (Ulbrich et al., 2012) was found to correlate only with BBOA (R2= 0.7) and not with PCOA (R2= 0.1). Secondly, the AMS spectra obtained during the combustion experiment (Fig. 5) were found to correlate only with am-bient PCOA (R2= 0.8 andR2= 0.65, respectively) and not with any of other four AMS-PMF factors. We therefore con-clude that the ambient PCOA factor is associated mainly with peat burning and to a lesser degree with coal burning. It is important to note that Fig. 5 mainly shows that peat burning presents a spectrum more similar to this factor PCOA, with a peculiar strong aromatic signature atm/z69, 91 and 115.
100x10-3 80
60
40
20
0
F
ra
c
ti
o
n
o
f
si
g
n
a
l
120 115 110 105 100 95 90 85 80 75 70 65 60 55 50 45 40 35 30 25 20 15 10
m/z
80x10-3 60
40
20
0
Coal
Peat
44
44 28
28
60
60 55
55 39
39 41 41
43
67
77 91 115
91
102 69
Ion Family
CxHy+
CxHyO1+ CxHyO2+ HxOy+
Fig. 5.Mass spectra of the peat and coal combustion laboratory experiment. The ion families of the different factors are shown in boxes.
2009). The transformation of peat organic matter by chemi-cal, biochemical and biological decay leads to the formation of a number of chemical substances among which humic and fulvic acids and their salts, cellulose, lignite, bitumens, pep-tides, enzymes and fats are the most common (Szajdak et al., 2007). The burned components of peat consist mainly of hydrocarbons, biomarkers, and aromatic components, quite similar to burning of contemporary biomass (Simoneit et al., 2002). A general correlation between Br and soil organic peat matter content has been reported (Keppler and Biester, 2003; Biester et al., 2004), consistent with our study (Table S5). Za-ccone et al. (2008) showed that more than 40 % of the total Br present in peat is stably retained in humic acid molecules especially in the upper central part of the profile.
The appreciable signal seen atm/z44 (Fig. 4), which im-plies a degree of oxygenation consistent with humic-like sub-stances (HULIS) produced by biomass burning (Dinar et al., 2006, Weimer et al., 2008), along with the strong correla-tion between PCOA and bromide, make this cluster a unique one. In summary, this factor attributed to peat and coal com-bustion represents 21 % of the total OA mass, and its mass spectra is dominated by [CxHy]+peaks (71 %), followed by
[CxHyO1]+(18 %) and [CxHyO2]+(1 %). Notably, this
fac-tor presented the highest amount (55 %) of total signal due to organonitrogen [CxHyNzOp] families, also making this
fac-tor distinct from the others.
Cooking OA (COA)
A factor thought to be COA (Fig. 4) presents the unique fea-ture among all five factors of havingm/zof 41 ([C3H5]+)
as a clear hydrocarbon peak. The second strongest [CxHy]+
peak can be seen at m/z 55 ([C4H7]+) as well as m/z 67
([C5H7]+). However, oxidized organic carbon peaks can also
be seen. Them/z43 is mainly composed of its oxidized
frac-tion ([C3H2O]+) as well as the presence of a strong signal at
m/z44 ([CO2]+). Relative to the other factors, whilst there is
an enhancement of signal for [CxHy]+peaks atm/z55 and
m/z67, other common [CxHy]+ peaks such asm/z57 and
m/z69 are reduced (Fig. 4). Table S3 shows that factor COA presents the strongest correlations with m/z 41 ([C3H5]+)
andm/z55 ([C3H3O]+), being two unique peaks attributed
mainly to this factor. COA was found to contribute 18 % to the total OA mass, and its mass spectra was mainly composed of [CxHy]+ peaks (71 %) followed by [CxHyO1]+ (25 %)
and [CxHyO1]+ (3 %). Several studies associate this factor
with cooking emissions. The first to report unit mass reso-lution (UMR) AMS factors featuring peaks at m/z 41 and
therefore cannot associate this factor only with cooking ac-tivities, and further discussion is provided in Sect. 4.
4 Discussion
4.1 Aerosol mixing state and single particle analysis
The results obtained by the ATOFMS show that the majority of the particles are internally mixed with both EC and OC. Additionally, two ATOFMS particle types distributed in the accumulation mode were found internally mixed with nitrate and organic species (OC-EC-NIT and Na-K-OC-EC) and are associated with secondary aerosol. In contrast, two main par-ticle types were found rich in sulphate (OC-EC-SUL) and hydrocarbon-like species (OC-EC-CH) and were attributed to space heating combustion sources. Finally, a specific tracer for traffic combustion particles (internal mixture of Ca and EC) was found (Spencer et al., 2006; Drewnick et al., 2008; Dall’Osto et al., 2009).
During this field campaign we were able to successfully detect four spikes of PM which were responsible for raising the PM2.5mass concentration at the port site to levels higher
than those recorded in the city (Figs. S2, 3). These spikes coincided with increases in counts for the ATOFMS parti-cle types Ca-dust and EC-POS and are attributed to localized emissions. NaCl was found to be a good tracer for separating different air mass types when air mass back trajectories were not entirely clear. The other ATOFMS particle types found were rich in vanadium, and associated with shipping emis-sions as discussed in the next section.
4.2 Aerosol source apportionment with tandem AMS-ATOFMS
4.2.1 Traffic and shipping emissions
We found specific markers for traffic emissions such as NO, AMS HOA and the ATOFMS particle type Ca-EC peculiar for this aerosol source.
As regards ship emissions, they represent one of the least-regulated forms of anthropogenic pollution due in large part to the challenges involved in establishing international poli-cies. Field observations have confirmed that ships produce significant amounts of soot, vanadium, nickel, and sulfate (Eatough et al., 1984; Xie et al., 2006; Pattanaik et al., 2007). Ships typically burn residual fuel oil, which produces higher concentrations of heavy metals and soot than distillate fuels such as gasoline and diesel. ATOFMS studies often report a very specific particle type containing vanadium (m/z51 [V]+ andm/z67 [VO]+) (Pastor et al., 2003; Dall’Osto and Har-rison, 2006; Healy et al., 2009). Recent field measurements also reported that single particles containing organic carbon, vanadium, and sulfate (OC-V-sulfate) resulted from residual fuel combustion (i.e. bunker fuel), whereas high quantities of fresh soot particles represented distinct markers for plumes
from distillate fuel combustion (i.e. diesel fuel) from ships as well as trucks in the port area (Ault et al., 2009, 2010).
During this field campaign the Port of Cork recorded 49 ship berthings, three of which were close enough to our mon-itoring site as their emissions were detected by the ATOFMS as being rich V-K-SUL particle types. Furthermore, it is im-portant to note that a second type of V-rich particle was de-tected (V-NIT), showing that aged V-rich particles are en-riched in nitrate. The AMS did not see a specific OA factor for ship emissions, but an enhancement of HOA was seen during fresh ship emissions spikes, as discussed in previous studies (Murphy et al., 2009; Lu et al., 2006). Several stud-ies (e.g. Lack et al., 2009) have noted the increase in sul-phate emissions associated with shipping emissions. During our study, we did not detect any increase in sulphate aerosol mass during the ship berthing, although elevated SO2
con-centrations (hourly values of 3–6 µg m−3) were recorded.
4.2.2 Domestic solid fuel combustion
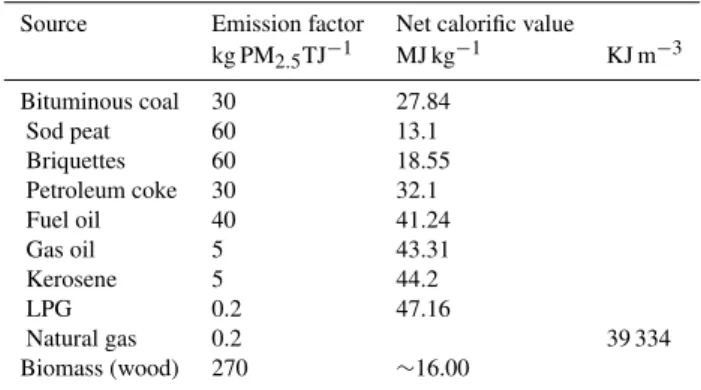
This AMS-ATOFMS study suggests that during wintertime domestic solid fuel combustion is the major source of OA in Cork. Such high OA concentrations are usually recorded in Alpine valleys in winter, attributed mostly to primary wood burning emissions (26–49 % of OA, Lanz et al., 2010). In small domestic combustion installations a wide variety of fu-els are used and several combustion technologies are applied. The majority of domestic heating in Ireland relies on electric-ity, oil and natural gas, but coal is still commonly used as a solid fuel, along with peat, peat briquettes and, to a lesser ex-tent, wood (IEA, 2007; COFORD, 2003). There is a ban on the use of bituminous coal in Cork city and other urban areas in Ireland, and smokeless coal is used instead. However, bi-tuminous coal is still widely used in areas not included in the ban. The emissions from combustion of solid fuel strongly depend on the fuel, combustion technologies as well as on operational practices and maintenance. Table 4 shows the emission factors from the CEPMEIP database (TNO, 2001), showing very high emission estimates for particulate matter for wood, peat and briquettes. Our results suggest that de-spite the fact that wood and peat are minor sources of fuel for domestic heating (COFORD, 2003), their poor combus-tion efficiencies are responsible for high PM emissions.
Table 4. Emission factors from the CEPMEIP database (TNO, 2001).
Source Emission factor Net calorific value
kg PM2.5TJ−1 MJ kg−1 KJ m−3
Bituminous coal 30 27.84
Sod peat 60 13.1
Briquettes 60 18.55
Petroleum coke 30 32.1
Fuel oil 40 41.24
Gas oil 5 43.31
Kerosene 5 44.2
LPG 0.2 47.16
Natural gas 0.2 39 334
Biomass (wood) 270 ∼16.00
4.2.3 Cooking organic aerosol
The UMR ions ofm/z43,m/z44,m/z57, andm/z60 have been used as tracers in MS of total OA, LV-OOA, HOA, and BBOA, respectively, because they typically correlate well with these OA components in statistical analysis of ambi-ent datasets (Zhang et al., 2005; Alfarra et al., 2007). Recambi-ent studies suggestm/z41 ([C3H5]+) andm/z55 ([C4H7]+and
[C3H3O]+) are peaks due to COA although the UMR ion of
m/z60, typically used as the tracer for biomass burning, is also observed for cooking aerosol (Allan et al., 2010; He et al., 2010). As a result, there is increasing evidence showing that peaks at m/z41, 55 and 60 may be distributed over a number of OA components, whereas the HOA and LV-OOA factors seem to be more well defined. Table S3 shows the correlation between the five factors and a number of selected peaks. COA and BBOA factors show similar patterns, both in CH and CHO ion families, although the specific peaks of [C2H4O2]+ (m/z60,R2= 0.99) and [C3H5O]+(m/z57, R2= 0.99) are more specific to BBOA.
Recent measurements attribute a major part of primary OA to cooking activities: 16 % in New York (Sun et al., 2010), 25 % in London (Allan et al., 2010), 16 % in Manch-ester (Allan et al., 2010), 24 % in Beijing (Huang et al., 2010) and 17 % in Barcelona (Mohr et al., 2012). The mass spectrum obtained in this study was found to be similar to other COA spectra (R2= 0.82 in Mohr et al., 2012, and
R2= 0.71 in Allan et al., 2010), pointing to cooking ac-tivities as the main source of this type of OA. Following the study of Mohr et al. (2012), COA was estimated from
m/z55. Good agreement was found between COA obtained from the PMF presented in this study and the estimated one (COA(estimated)= 0.6 COA(this study);R2= 0.84) although the
correlation was better during daytime (10–15 % difference) than during nighttime (40–50 % difference).
However, the temporal trend of COA in our study does not reflect the expected cooking activities in Cork, suggest-ing that other sources and/or processes may be contributsuggest-ing to this factor. Previous COA diurnal cycles were related to
peaks during midday (depending on lunch times of the differ-ent countries) and in the later evening. In Barcelona (Spain), Mohr et al. (2012) found that COA was shifted from ex-pected lunch and dinner times, and the reason was attributed to sea breeze and nocturnal boundary layer height dynam-ics affecting the COA emissions. During our study (Fig. 1e) we find a small peak at 10:00–12:00, shortly after the morn-ing rush hour and before typical Irish lunchtime activities (12:00–14:00). The large, broad nighttime peak is also not consistent with cooking activity. It is important to note these temporal trends can be seen not only in the PMF factors (Fig. 1e) but also in specific mass spectra peaks (Fig. S10,
m/z 55 [C3H3O]+ and m/z 57 [C3H5O]+). The wind
de-pendence for the COA factor differs from the other AMS PMF factors, showing a more southwesterly dependence (re-mote background region) rather than a localized urban source (Fig. S11). In summary, this OA factor is the least defined of all those identified in this study and is not solely attributable to cooking activities.
4.3 Case study: Marine versus Stagnant time period
Table 1 shows average values for different periods of the study (entire study, Period M. Period S., see also temporal trends in Fig. 3), as well as the ratio of S. versus M. aver-age values (ratio S / M) of the measurements collected. As expected, high PM values are seen for Period S. as a con-sequence of low dispersion conditions. In particular, high concentrations of secondary species such as sulphate (ra-tio S / M 3.5), LV-OOA (ra(ra-tio S / M 2.9) and ATOFMS aged V-rich particle types (ratio S/M 5.3) can be explained by ac-cumulation of secondary aerosol over time in Period S. By contrast, more NaCl is observed as expected during Period M. (ratio S/M 0.3). Primary particles such as AMS HOA and ATOFMS Ca-EC present a S / M ratio close to one, be-cause they are expected to be independent of air mass ori-gin and due to local traffic/ship emissions. An unexpected result is the different temporality of the two primary do-mestic heating sources BBOA and PCOA. Whilst BBOA is higher during stagnant conditions, the AMS factor PCOA was found to present higher concentrations during marine conditions. Given the fact that these two aerosol domestic heating sources are likely to be highly correlated (similar emission time), it is possible that there is a chemical (ag-ing) and/or physical process (evaporation, and consequent aerosol mass loss) affecting the lifetime of BBOA versus PCOA organic aerosols. The O3 and NOx concentrations
were very different during the stagnant and marine periods (Table 1), which likely reflects different oxidizing condi-tions for the organic aerosol. Low NOxand high O3