ACPD
12, 1493–1516, 2012Impact of aerosol composition
Q. Zhang et al.
Title Page
Abstract Introduction
Conclusions References
Tables Figures
◭ ◮
◭ ◮
Back Close
Full Screen / Esc
Printer-friendly Version Interactive Discussion
Discussion
P
a
per
|
Dis
cussion
P
a
per
|
Discussion
P
a
per
|
Discussio
n
P
a
per
|
Atmos. Chem. Phys. Discuss., 12, 1493–1516, 2012 www.atmos-chem-phys-discuss.net/12/1493/2012/ doi:10.5194/acpd-12-1493-2012
© Author(s) 2012. CC Attribution 3.0 License.
Atmospheric Chemistry and Physics Discussions
This discussion paper is/has been under review for the journal Atmospheric Chemistry and Physics (ACP). Please refer to the corresponding final paper in ACP if available.
Impact of aerosol composition on cloud
condensation nuclei activity
Q. Zhang1, J. Meng1, J. Quan1,2, Y. Gao1, D. Zhao1, P. Chen1, and H. He1
1
Beijing Weather Modification Office, Beijing, China
2
Institude of Urban Meteorology, CMA, Beijing, China
Received: 24 October 2011 – Accepted: 29 November 2011 – Published: 17 January 2012
Correspondence to: J. Quan ([email protected])
ACPD
12, 1493–1516, 2012Impact of aerosol composition
Q. Zhang et al.
Title Page
Abstract Introduction
Conclusions References
Tables Figures
◭ ◮
◭ ◮
Back Close
Full Screen / Esc
Printer-friendly Version Interactive Discussion
Discussion
P
a
per
|
Dis
cussion
P
a
per
|
Discussion
P
a
per
|
Discussio
n
P
a
per
|
Abstract
The impact of aerosol composition on cloud condensation nuclei (CCN) activity was analyzed in this study based on field experiments carried out at downtown Tianjin, China, in September 2010. In the experiments, the CCN measurements were per-formed at supersaturation (SS) of 0.1 %, 0.2 % and 0.4 % using a thermal-gradient
5
diffusion chamber (DMT CCNC), whereas the aerosol size distribution and composi-tion were simultaneously measured with a TSI SMPS and an Aerodyne Aerosol Mass Spectrometer (AMS), respectively. The results show that the influence of aerosol com-position on CCN activity is notable under low SS (0.1 %), and their influence decreased with increasing SS. For example, under SS of 0.1 %, the CCN activity increases from
10
4.5±2.6 % to 12.8±6.1 % when organics fraction decrease from 30–40 % to 10–20 %.
The rate of increase reaches up to 184 %. While under SS of 0.4 %, the CCN activity increases only from 35.7±19.0 % to 46.5±12.3 %, correspondingly. The calculated NCCNbased on the size-resolved activation ratio and aerosol number size distribution
correlates well with observedNCCN at high SS (0.4 %), but this correlation decreases
15
with the falling of SS. The slopes of linear fitted lines between calculated and observed NCCNare 0.708, 0.947, and 0.995 at SS of 0.1 %, 0.2 % and 0.4 %, respectively.
More-over, the standard deviation (SD) of calculatedNCCN increases with the decreasing of
SS. A case study of CCN closure analyses indicates that the calculated error ofNCCN
can reach up to 34 % at SS of 0.1 % if aerosol composition is not included, and the
20
calculated error decreases with the raising of SS. It decreases to 9 % at SS of 0.2 %, and further decreases to 4 % at SS of 0.4 %.
1 Introduction
Part of aerosol particles can act as cloud condensation nuclei (CCN), which will af-fect cloud formation (Ramanathan et al., 2001; Andreae et al., 2004), including cloud
25
ACPD
12, 1493–1516, 2012Impact of aerosol composition
Q. Zhang et al.
Title Page
Abstract Introduction
Conclusions References
Tables Figures
◭ ◮
◭ ◮
Back Close
Full Screen / Esc
Printer-friendly Version Interactive Discussion
Discussion
P
a
per
|
Dis
cussion
P
a
per
|
Discussion
P
a
per
|
Discussio
n
P
a
per
|
2008; Zhang et al., 2011). The complexities of aerosol particles make it rather diffi -cult to estimate their CCN activity (Cruz and Pandis, 1998; Hegg et al., 2001; Prenni et al., 2001; Brooks et al., 2003; Kumar et al., 2003; Raymond and Pandis, 2003; Broekhuizen et al., 2004; Marcolli et al., 2004; Henning et al., 2005), which means that the impact of aerosol on cloud and the cloud feedbacks are currently considered as the
5
largest uncertainties in climate system (IPCC, 2007).
The ability of an aerosol particle to become a droplet is primarily a function of its size and chemical composition (Seinfeld and Pandis, 2006). K ¨ohler theory describes the competing effects involved in cloud droplet activation. Two competing effects determine the equilibrium vapor pressure of water over an aqueous solution droplet: the solution
10
effect (Raoult’s law), which tends to decrease the equilibrium vapor pressure on the droplet; and the curvature (Kelvin’s law) effect, which tends to increase the equilibrium vapor pressure on the droplet. Compared with organics, the solution of inorganic salts are much higher, which makes the inorganic salts easier to be activated. For example, the critical supersaturation (Sc) needed to activate particles of ammonium sulfate and
15
adipic acid of size 100 nm are 0.15 % and 0.27 %, respectively (Hings et al., 2008). Moreover, the presence of slight soluble aerosol particles or soluble gases will further decrease the Sc (Kulmala et al., 1997). The work of Kulmala et al. (1997) reveals that stable cloud droplets of size 1–10 µm could exist in air with a relative humidity of less than 100 %. Therefore, the SS should be considered during an experiment that
20
studies the effect of aerosol composition on CCN activation. If the SS is set too high, the component properties of aerosol particles might be masked.
In this study, a field experiment was conducted in a heavy pollution area located in the North China Plain (NCP). During the experiment, the aerosol number size distribu-tion, composition (sulfate, nitrate, ammonium, chlorite, organics), and the size-resolved
25
ACPD
12, 1493–1516, 2012Impact of aerosol composition
Q. Zhang et al.
Title Page
Abstract Introduction
Conclusions References
Tables Figures
◭ ◮
◭ ◮
Back Close
Full Screen / Esc
Printer-friendly Version Interactive Discussion
Discussion
P
a
per
|
Dis
cussion
P
a
per
|
Discussion
P
a
per
|
Discussio
n
P
a
per
|
2 Experimental methods
2.1 Aerosol sampling site
The sampling site is situated in the northwest of the urban area of Tianjin, and the measurements were conducted continuously from 1 September to 26 September 2010. The monitoring instruments were deployed on a monitor station with no high buildings
5
around. A main road about 20 m away to the north passes by the monitor station, and no significant pollution sources exist near the sampling site.
During the campaign, sampling of aerosol was conducted from the top of the sam-pling room via a PM2.5 cyclone inlet which can remove coarse particles more than 2.5 µm. To minimize sampling losses, a stainless steel pipe, approximately 1/4 inch in
10
diameter, was used to introduce air stream into the room. During the campaign, the air-conditioned room temperature was∼21◦and the sampling air relative humidity (RH)
was maintaining below 30 % after passing through two diffusion dryers.
2.2 Instrument setup
Polydisperse dry aerosol was charge-neutralized using a Kr-85 neutralizer (TSI 3077A)
15
and introduced into a differential mobility analyzer (DMA, TSI 3081L) for classification by electrical mobility. The classified aerosol was then split into a condensation particle counter (CPC, TSI 3776) to measure the particle size distribution and the total aerosol concentration (condensation nuclei, CN), and into a DMT double-column continuous-flow CCN counter (CCN-200) (Roberts and Nenes, 2005; Lance et al., 2006) to obtain
20
the CCN activation properties. The particle size distribution was measured every 5 min, with an up-scan time of 280 s. The DMA was operated with 0.8 l min−1sample air flow rate, which was split into two parts with 0.5 l min−1for CCN counter and 0.3 l min−1 for CPC, and a closed-loop sheath air flow rate of 8 l min−1. The sheath flow rate was continuously regulated to a constant volumetric flow, using a mass flow controller with a
25
ACPD
12, 1493–1516, 2012Impact of aerosol composition
Q. Zhang et al.
Title Page
Abstract Introduction
Conclusions References
Tables Figures
◭ ◮
◭ ◮
Back Close
Full Screen / Esc
Printer-friendly Version Interactive Discussion
Discussion
P
a
per
|
Dis
cussion
P
a
per
|
Discussion
P
a
per
|
Discussio
n
P
a
per
|
were regularly checked and sizing accuracy was checked by employing Polystyrene latex (PSL) spheres with different diameters.
The CCN-200 has two columns to measure different samples at different supersatu-rations (SS) at the same time. In the field experiment, column A directly measured the dry polydisperse aerosol sample to obtain the bulk CCN concentration, while column
5
B was connected to the exit of DMA to measure the size-resolved particles activation properties. The CCN-200 was operated at a total flow rate of 1 l min−1with a sheath-to-aerosol flow ratio of 10. Both columns operated at the same SS at the same time. One measurement cycle included measurements at 5 different SS (0.07 %, 0.10 %, 0.20 %, 0.40 % and 0.80 %) of 20 min for 0.07 % and 10 min for each of the rest. Therefore, the
10
NCCN for five SS were available every hour. Here, 10 min per SS can ensure at least
two replicates per SS, as CCN temperature transients during SS changes may produce unreliable spectra if they occur during a voltage up-scan (Moore et al., 2010). When-ever the temperature gradient is changed, up to 2 min are required for the instrument profiles to stabilize.
15
The Dual CCN counter was calibrated regularly with size selected (by DMA) ammo-nium sulfate particles (Rose et al., 2008; Deng et al., 2011) before and after the cam-paign. The critical dry diameters (50 % of the particles activated) determined from the activation curves of ammonium sulfate under diffent tempetature gradients (TG) were converted to SS utilizing the K ¨ohler equation where several K ¨ohler theory parameter
20
employed (Cooper and Dooley, 1994; Seinfeld and Pandis, 2006; Young and Warren, 1992; Low, 1969). TG and SS were linearly fitted. The SS of CCN was calculated from the TG-SS linearly fitted function.
The aerosol chemical composition of the non-refractory submicron particles was measured by an Aerodyne Compact Time-of-Flight Aerosol Mass Spectrometer
(C-25
ACPD
12, 1493–1516, 2012Impact of aerosol composition
Q. Zhang et al.
Title Page
Abstract Introduction
Conclusions References
Tables Figures
◭ ◮
◭ ◮
Back Close
Full Screen / Esc
Printer-friendly Version Interactive Discussion
Discussion
P
a
per
|
Dis
cussion
P
a
per
|
Discussion
P
a
per
|
Discussio
n
P
a
per
|
Smaller and larger particles are also collected, but with lower efficiency. Particle size information was obtained by measuring particle velocity with a mechanical chopper wheel: The particles impact on an inverted conical tungsten vapour, where the non-refractory components are flash vapour. Then the resulting gas is ionised by electron ionization at 70 eV. The ions are subsequently extracted orthogonally and sampled
5
by the C-ToF-AMS (Tofwerk AG, Thun, Switzerland) for mass analysis. The instru-ment provides 2 min averaged quantitative mass loading information on non-refractory components using a well characterised series of calibrations and error estimations (Jimenez et al., 2003; Allan et al., 2003, 2004), as well as species resolved size dis-tributions. The C-ToF-AMS calibration, e.g. inlet flow, ionization efficiency (IE) and
10
particle sizing, was performed at the beginning, the middle and the end of the cam-paign as the standard protocols recommend (Jayne et al., 2000; Jimenez et al., 2003; Drewnick et al., 2005).
2.3 Date processiong
The CN and CCN time series distribution was obtained by using the TSI Aerosol
Instru-15
ment Manager (AIM) software (Wang and Flagan, 1989) and CCN acquiring software, respectively. AIM provided the raw CN counts reported by the CPC every 0.1 s during each scan cycle and CCN acquiring software recorded data every second. Here data collected during the voltage upscan was employed to inversion. The detail description of the application of Scanning Mobility CCN Analysis (SMCA) and the CCN activation
20
ratio calculation are introduced by Moore et al. (2010). Firstly, the time series distribu-tion of CN and CCN is aligned by matching the minimum in counts that occurs during the transition between upscan and downscan. Then the CN and CCN time series is converted to size space using the size-scan time relationship provided by the AIM software, the inverted size-resolved aerosol number distribution is obtained. Finally, a
25
ACPD
12, 1493–1516, 2012Impact of aerosol composition
Q. Zhang et al.
Title Page
Abstract Introduction
Conclusions References
Tables Figures
◭ ◮
◭ ◮
Back Close
Full Screen / Esc
Printer-friendly Version Interactive Discussion
Discussion
P
a
per
|
Dis
cussion
P
a
per
|
Discussion
P
a
per
|
Discussio
n
P
a
per
|
The C-ToF-AMS usually has two different operational modes: (i) the MS (Mass Spectrum) mode which is used to collect averaged mass spectra of the non-refractory aerosol and can provide mass concentrations for several species such as sulfate, ni-trate, ammonium, chloride and total non-refractory organics; and (ii) the P-ToF (Particle Time-of-Flight) mode which is used to collect averaged size distribution data for all
non-5
refractory aerosol and can calculate size distributions for each species independently. Therefore, the C-ToF-AMS can provide redundant as well as complementary informa-tion of chemistry and size distribuinforma-tion for the non-refractory aerosol. Details of the inversions are presented by Drewnick et al. (2005) and DeCarlo et al. (2006).
3 Results and discussion
10
3.1 Sampling data
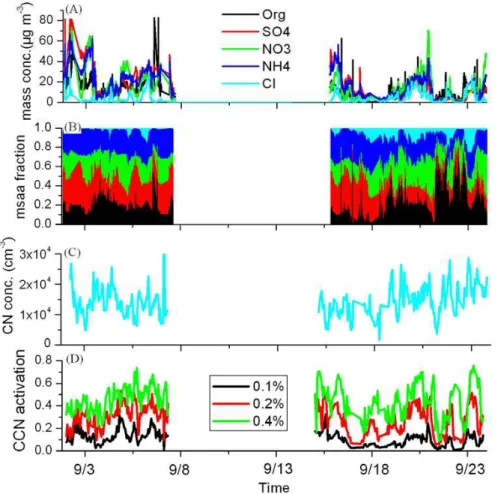
Figure 1 shows the sampling data at downtown Tianjin during 1–7 and 15–23 Septem-ber 2010. The hourly-averaged mass concentration of aerosol particles observed by AMS range from 4 to 251 µg cm−3, with averaged mass concentration of 66±50
µg cm−3. Large variation of aerosol composition was observed during this experiment.
15
Hourly-averaged organics fraction range from 1.1 % to 63.8 %, with 82 % data ranges from 10–60 %. The averaged mass component of aerosols during the experiment are: organics, 23.8 %; sulfate (SO4), 21.8 %; nitrite (NO3), 24.6 %; ammonia (NH4), 20.6 %; chlorine (Cl), 9.2 %. The number concentration of aerosol particles with size of 14.1–736.5 nm observed by SMPS range from 2416 to 32 396 cm−3 with an
aver-20
aged value of 13117±4797 cm−3. The averaged number concentrations of CCN under
SS of 0.1 %, 0.2 %, 0.4 % are 1489±982 cm−3, 4121±2725 cm−3, 6640±6791 cm−3,
respectively. Large variation of CCN/CN was also observed during this experiment. The CCN/CN under SS of 0.1 %, 0.2 %, 0.4 % range from 0.6 %-32.6 %, 5.2 %-55.6 %, 8.8 %-75.7 %, respectively.
ACPD
12, 1493–1516, 2012Impact of aerosol composition
Q. Zhang et al.
Title Page
Abstract Introduction
Conclusions References
Tables Figures
◭ ◮
◭ ◮
Back Close
Full Screen / Esc
Printer-friendly Version Interactive Discussion
Discussion
P
a
per
|
Dis
cussion
P
a
per
|
Discussion
P
a
per
|
Discussio
n
P
a
per
|
3.2 Effect of aerosol composition on CCN activity
CCN is the aerosol particles that can grow into cloud droplets (activate) under atmo-spheric SS. The SS needed to activate the particles is called critical supersaturation (Sc). Based on K ¨ohler theory, for particles of constant size, the Sc depends on its solution, which is a function of its composition (Dusek et al., 2006), including the
num-5
ber of potential solute molecules and the solution it contains. For example, the Sc needed to activate the particles of ammonium sulfate, adipic acid with size of 100 nm is 0.15 % and 0.27 %, respectively (Hings et al., 2008). With the increasing of SS, the CCN/CN will increase correspondingly. Therefore, the SS should also be considered in studying the CCN activation of environment aerosols. If the SS is set too high in the
10
experiment, the properties of aerosol particles might be masked. In the atmosphere, aerosol particles are most likely to be mixtures of organic and inorganic components. Based on K ¨ohler theory, the Sc needed for inorganic salts to activate to CCN is lower than organics for the same size of particles due to the high solution of inorganic salts, which makes particles with more inorganic salts easier to be activated under the same
15
condition. In this study, the organics fraction measured by AMS was used to analyze the effect of aerosol composition on CCN activity.
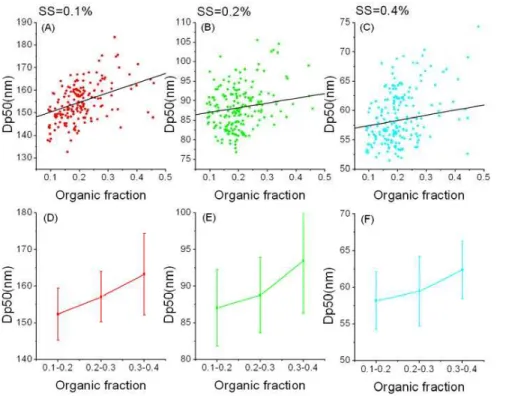
Figures 2 and 3 shows the relation of CCN/CN, and the diameter of particles at CCN/CN=0.5 (Dp50) with organics fraction under the three SS, respectively. Under a certain SS, the CCN/CN decreased with the raising of organics fraction. Moreover, the
20
decreasing trend is more effective under lower SS. For example, under SS of 0.1 %, the CCN/CN increased from 4.5±2.6 % to 12.8±6.1 % when organics fraction decreased
from 30–40 % to 10–20 %. The rate of increase reached up to 184 %. While under SS of 0.4 %, the CCN activity increased only from 35.7±19.0 % to 46.5±12.3 %,
corre-spondingly, and the rate of increasing decreased to 30.1 %. In Fig. 2, the size of
parti-25
ACPD
12, 1493–1516, 2012Impact of aerosol composition
Q. Zhang et al.
Title Page
Abstract Introduction
Conclusions References
Tables Figures
◭ ◮
◭ ◮
Back Close
Full Screen / Esc
Printer-friendly Version Interactive Discussion
Discussion
P
a
per
|
Dis
cussion
P
a
per
|
Discussion
P
a
per
|
Discussio
n
P
a
per
|
that less particles will be converted to CCN. For example, under SS of 0.1 %, the Dp50 increased from 152.3±7.1 nm to 163.4±11.1 nm when organics fraction raised from
10–20 % to 30–40 %. The extent of increase was 11.1 nm. While under SS of 0.2 %, the extent of increase declined to 6.5 nm, and further declined to 4.2 nm at SS of 0.4 %.
3.3 Size-resolved activation ratio
5
Based on the observations and methods introduced at Sect. 2, we first calculated the CCN activity (Fig. 4) and their standard deviation (SD) (Fig. 5) under the three SS with-out consideration of aerosol composition. The standard deviation (SD) of the spectrum regarding CCN activity is defined as follow:
SD=X(r−r¯)2/N1/2 (1)
10
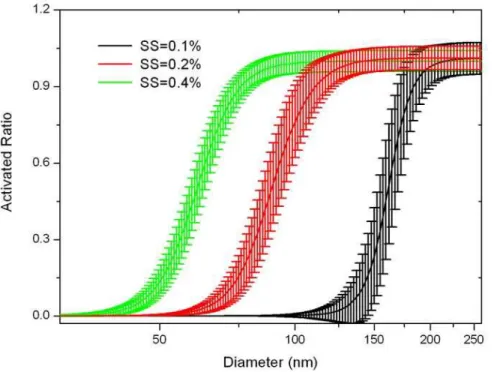
wherer is the ratio of CCN to CN, ¯r is averaged data, and N is sample number. Figure 4 shows that the CCN activity is highly sensitive to SS for particles with size of 50–200 nm, which is the dominant fraction of aerosol particles. For example, for particles with size of 100 nm, the CCN/CN is near to 0 at SS of 0.1 %, and increases to 0.75 at SS of 0.2 %, then further increases to near 1.0 at SS of 0.4 %. The SD in our
15
observation fluctuated with SS and particle size. It decreased with the increasing of particle size for a certain SS, while the SD decreases with the increasing of SS for all particles (Fig. 5). For example, under constant SS of 0.1 %, the SD was 4.2, 0.8, and 0.09 at size of 100 nm, 150 nm and 200 nm, respectively. While for particles with size of 100 nm, the SD was 0.04, 0.2, and 4.2 at SS of 0.4 %, 0.2 % and 0.1 %, respectively.
20
The high SD for small particles (50–200 nm) at low SS (0.1 %) might be caused by the variation of the aerosol composition since their effect on CCN activation was observed (Fig. 5), especially at low SS.
The CCN concentration (NCCN,Cal) can be calculated using the following equation:
NCCN,Cal=
Z
A logDp
n logDp
dlogDp (2)
ACPD
12, 1493–1516, 2012Impact of aerosol composition
Q. Zhang et al.
Title Page
Abstract Introduction
Conclusions References
Tables Figures
◭ ◮
◭ ◮
Back Close
Full Screen / Esc
Printer-friendly Version Interactive Discussion
Discussion
P
a
per
|
Dis
cussion
P
a
per
|
Discussion
P
a
per
|
Discussio
n
P
a
per
|
whereA logDp
is the size resolved activation ratio, and n logDp
is the function of the aerosol number size distribution.
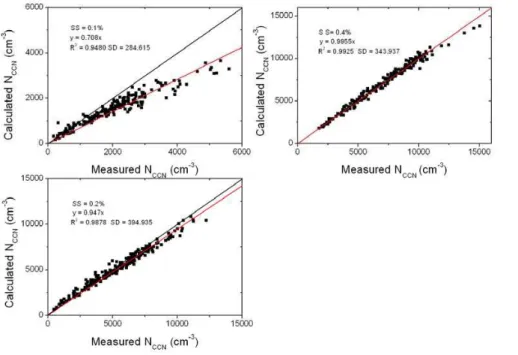
The calculated NCCN based on Eq. (2), the size-resolved activation ratios (Fig. 4)
and observed aerosol number size distribution is highly consistent with the measured NCCN (Fig. 6) at high SS (R
2
=0.9925 at SS of 0.4 %) and the consistent decreased
5
with decreasing of SS (R2=0.9480 at SS of 0.1 %). The linear fitted lines have slopes lower than 1 for each SS. The slopes are 0.708, 0.947, and 0.995 at SS of 0.1 %, 0.2 % and 0.4 %, respectively.
The above analysis indicates that the effect of aerosol composition on CCN cannot be ignored in estimating the CCN concentration, especially at low SS which is present
10
at natural environment. For example, the typical SS for stratiform clouds and fog are 0.05 % and 0.1 %, respectively (Seinfeld and Pandis, 2006). To estimate quantitatively the contribution of aerosol composition on CCN calculated error, two cases of CCN closure study were analyzed with organics fraction of 24 % and 55 %, as described in the next section.
15
3.4 Contribution of aerosol composition on CCN calculated error
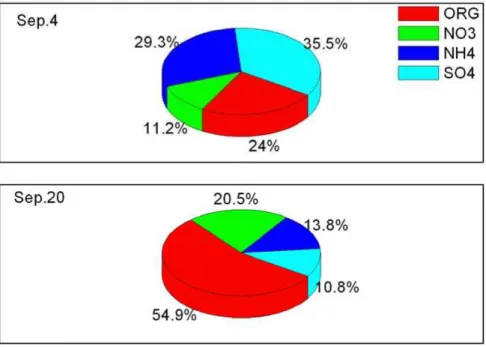
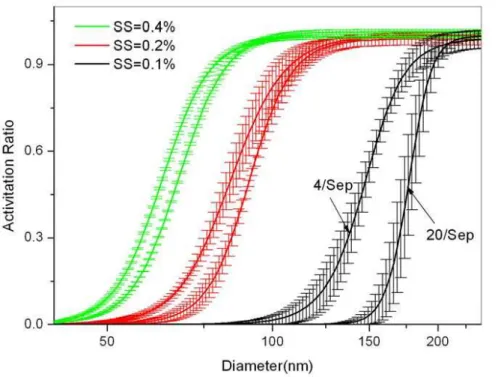
The selected two cases are for 4 and 20 September 2010. Figure 7 shows the daily averaged composition of the two days with sizes ranging from 50 to 200 nm. On 4 Sep, inorganic is the dominated component, which takes up 60–80 % in mass concentration, while on 20 Sep, organic is the dominated component, which takes up 40–70 % in mass
20
concentration. The size-resolved CCN activation of aerosol particles under different SS calculation using methods introduced in Sect. 3.3 for observations on 4 and 20 Sep are shown in Fig. 8. There are significant differences of CCN/CN for particle sizes of 100–200 nm between the two cases under low SS (0.1 %). Moreover, the differences go down with the increasing of SS. For example, for particles with size of 150 nm, the
25
ACPD
12, 1493–1516, 2012Impact of aerosol composition
Q. Zhang et al.
Title Page
Abstract Introduction
Conclusions References
Tables Figures
◭ ◮
◭ ◮
Back Close
Full Screen / Esc
Printer-friendly Version Interactive Discussion
Discussion
P
a
per
|
Dis
cussion
P
a
per
|
Discussion
P
a
per
|
Discussio
n
P
a
per
|
on the CCN activation ratio extracted from the two cases at the same time and compare their differences. The calculated error is 31 % at SS of 0.1 %, decreases to 9 % at SS of 0.2 %, and further decreases to 4 % at SS of 0.4 %. Above results indicate that the influence of aerosol composition on CCN activation cannot be neglected under low SS since their compositions display great regional and temporal differences (Zhang et al.,
5
2009).
4 Summaries
We conducted a field experiment carried out at downtown Tianjin during September 2010 to analyze the effect of aerosol composition on CCN activity. During this ex-periment, CCN concentration under SS of 0.1 %, 0.2 % and 0.4 %, together with the
10
aerosol size distribution and composition, were simultaneously measured. Using the size and composition information, detailed CCN closure analyses under different SS were performed. The results are summarized as the follows:
1. The effect of aerosol composition on CCN activity is significant at low SS, and this effect decreases with the raising of SS. In this study, the fraction of organic
15
component was used to represent character of aerosol composition in analyzing their influence on CCN activity. The observations indicate that the CCN activity decreases, and the Dp50 increases with the raising of organic fraction. More-over, the decreasing trend is more effective under lower SS. For example, under SS of 0.1 % the CCN activity increases from 4.5±2.6 % to 12.8±6.1 % when
or-20
ganic fraction decreases from 30–40 % to 10–20 %; the rate of increases reaches up to 184 %. While under SS of 0.4 %, the CCN activity increases only from 35.7±19.0 % to 46.5±12.3 %, correspondingly.
2. Regardless of aerosol composition, the calculated NCCN based on the aerosol
number size distribution and the size-resolved activation ratios are consistent with
25
ACPD
12, 1493–1516, 2012Impact of aerosol composition
Q. Zhang et al.
Title Page
Abstract Introduction
Conclusions References
Tables Figures
◭ ◮
◭ ◮
Back Close
Full Screen / Esc
Printer-friendly Version Interactive Discussion
Discussion
P
a
per
|
Dis
cussion
P
a
per
|
Discussion
P
a
per
|
Discussio
n
P
a
per
|
of SS. Moreover, the standard deviation (SD) of calculatedNCCN increases with
the decreasing of SS. The slopes of linear fitted lines between calculated NCCN
and observedNCCNare 0.708, 0.947, and 0.995 at SS of 0.1 %, 0.2 % and 0.4 %,
respectively.
3. The contribution of aerosol composition on CCN activity was estimated
quantita-5
tively based on CCN closure study of two cases with organic fraction of 24 % and 55 %. The calculated error is estimated on the difference of the calculated NCCN
based on size-resolved activation ratios extracted from the two cases. The result indicates that the calculated error ofNCCN could reach up to 34 % at SS of 0.1 %
and that the calculated error decreases with the raising of SS. It decreases to 9 %
10
at SS of 0.2 %, and further decreases to 4 % at SS of 0.4 %.
Acknowledgements. This research is partially supported by National Natural Science
Foun-dation of China (NSFC) under Grant No. 40905060 and No. 41175007; The National Basic Research Program of China (2011CB403401); The project of scientific and technological new star of Beijing under Grant No. 2010B029; China Meteorological Administration (CMA) under
15
Grant No GYHY200806001-4.
References
Allan, J. D., Jimenez, J. L., Coe, H., Bower, K. N., Williams, P. I., and Worsnop, D. R.: Quantitative sampling using an aerodyne aerosol mass spectrometer, Part 1: Tech-niques of data interpretation and error analysis, J. Geophys. Res. Atmos., 108, 4090,
20
doi:10.1029/2002JD002358, 2003.
Allan, J. D., Coe, H., Bower, K. N., Alfarra, M. R., Delia, A. E., Jimenez, J. L., Middlebrook, A. M., Drewnick, F., Onasch, T. B., Canagaratna, M. R., Jayne, J. T., and Worsnop, D. R.: Technical note: extraction of chemically resolved mass spectra from aerodyne aerosol mass spectrometer data, J. Aerosol Sci., 35, 909–922, 2004.
25
ACPD
12, 1493–1516, 2012Impact of aerosol composition
Q. Zhang et al.
Title Page
Abstract Introduction
Conclusions References
Tables Figures
◭ ◮
◭ ◮
Back Close
Full Screen / Esc
Printer-friendly Version Interactive Discussion
Discussion
P
a
per
|
Dis
cussion
P
a
per
|
Discussion
P
a
per
|
Discussio
n
P
a
per
|
Broekhuizen, K., Kumar, P. P., and Abbatt, J. P. D.: Partially soluble organics as cloud con-densation nuclei: Role of trace soluble and surface active species, Geophys. Res. Lett., 31, L01107, doi:10.1029/2003GL018203, 2004.
Brooks, S. D., Garland, R. M., Wise, M. E., Prenni, A. J., Cushing, M., Hewitt, E., and Tolbert, M. A.: Phase changes in internally mixed maleic acid/ammonium sulfate aerosols, J. Geophys.
5
Res., 108, 4487, doi:10.1029/2002JD003204, 2003.
Cooper, J. R. and Dooley, R. B.: IAPWS release on surface tension of ordinary water substance, available at: http://www.iapws.org/relguide/surf.pdf, 1994.
Cruz, C. N. and Pandis, S. N.: The effect of organic coatings on the cloud condensation nuclei activation of inorganic atmospheric aerosol, J. Geophys. Res., 103, 13111–13123, 1998.
10
DeCarlo, P. F., Kimmel, J. R., Trimborn, A., Northway, M. J., Jayne, J. T., Aiken, A. C., Go-nin, M., Fuhrer, K., Horvath, T., Docherty, K. S., Worsnop, D. R., and Jimenez, J. L.: Field-deployable, high-resolution, time-of-flight aerosol mass spectrometer, Anal. Chem., 78, 8281–8289, 2006.
Deng, Z. Z., Zhao, C. S., Ma, N., Liu, P. F., Ran, L., Xu, W. Y., Chen, J., Liang, Z., Liang,
15
S., Huang, M. Y., Ma, X. C., Zhang, Q., Quan, J. N., Yan, P., Henning, S., Mildenberger, K., Sommerhage, E., Sch ¨afer, M., Stratmann, F., and Wiedensohler, A.: Size-resolved and bulk activation properties of aerosols in the North China Plain, Atmos. Chem. Phys., 11, 3835–3846, doi:10.5194/acp-11-3835-2011, 2011.
Drewnick, F., Hings, S. S., DeCarlo, P., Jayne, J. T., Gonin, M., Fuhrer, K., Weimer, S., Jimenez,
20
J. L., Demerjian, K. L., Borrmann, S., Worsnop, D. R.: A new Time-of-Flight Aerosol Mass Spectrometer (TOF-AMS)– instrument description and first field deployment, Aerosol Sci. Technol., 39, 637–658, 2005.
Dusek, U., Frank, G. P., Hildebrandt, Curtius, J., Schneider, J., Walter, S., Chand, D., Drewnick, F., Hings, S., Jung, D., Borrmann, S., and Andreae, M. O.: Size matters more than chemistry
25
for cloud nucleating ability of aerosol particles, Science, 312, 1375–1378, 2006.
Hegg, D. A., Gao, S., Hoppel, W., Frick, G., Caffrey, P., Leaitch, W. R., Shantz, N., Ambrusko, J., and Albrechcinski, T.: Laboratory studies of the efficiency of selected organic aerosols as CCN, Atmos. Res., 58, 155–166, 2001.
Henning, S., Rosenrn, T., D’Anna, B., Gola, A. A., Svenningsson, B., and Bilde, M.: Cloud
30
droplet activation and surface tension of mixtures of slightly soluble organics and inorganic salt, Atmos. Chem. Phys., 5, 575–582, doi:10.5194/acp-5-575-2005, 2005.
ACPD
12, 1493–1516, 2012Impact of aerosol composition
Q. Zhang et al.
Title Page
Abstract Introduction
Conclusions References
Tables Figures
◭ ◮
◭ ◮
Back Close
Full Screen / Esc
Printer-friendly Version Interactive Discussion
Discussion
P
a
per
|
Dis
cussion
P
a
per
|
Discussion
P
a
per
|
Discussio
n
P
a
per
|
CCN activation experiments with adipic acid: effect of particle phase and adipic acid coatings on soluble and insoluble particles, Atmos. Chem. Phys., 8, 3735–3748, doi:10.5194/acp-8-3735-2008, 2008.
IPCC: Climate Change 2007: The Physical Science Basis, Cambridge University Press, Cam-bridge, United Kingdom and New York, NY, USA, 996 pp., 2007.
5
Jayne, J. T., Leard, D. C., Zhang, X., Davidovits, P., Smith, K. A.,Kolb, C. E., and Worsnop, D. R.: Development of an Aerosol Mass Spectrometer for Size and Composition, Analysis of Submicron Particles, Aerosol Sci. Technol., 33, 49–70, 2000.
Jin, M. and Shepherd, J. M.: Aerosol relationships to warm season clouds and rainfall at monthly scales over east China: Urban land versus ocean, J. Geophys. Res., 113, D24S90,
10
doi:10.1029/2008JD010276, 2008.
Jimenez, J. L., Jayne, J. T., Shi, Q., Kolb, C. E., Worsnop, D. R., Yourshaw, I., Seinfeld, J. H., Flagan, R. C., Zhang, X., Smith, K. A., Morris, J. W., and Davidovits, P.: Ambient aerosol sampling using the Aerodyne aerosol mass spectrometer, J. Geophys. Res., 108, 8425– 8437, 2003.
15
Kulmala, M., Laaksonen, A., Charlson, R. J., and Korhonen, P.: Clouds without supersaturation, Nature, 388, 336–337, 1997.
Pradeep Kumar, P., Broekhuizen, K., and Abbatt, J. P. D.: Organic acids as cloud condensation nuclei: Laboratory studies of highly soluble and insoluble species, Atmos. Chem. Phys., 3, 509–520, doi:10.5194/acp-3-509-2003, 2003.
20
Lance, S., Medina, J., Smith, J. N., and Nenes, A.: Mapping the operation of the dmt continuous flow CCN counter, Aerosol Sci. Technol., 40, 242–254, 2006.
Low, R. D. H.: A generalized equation for the solution effect in droplet 1 growth, J. Atmos. Sci., 26, 608–611, 1969.
Marcolli, C., Luo, B. P., and Peter, T.: Mixing of the organic aerosol fractions: Liquids as the
25
thermodynamically stable phases, J. Phys. Chem., 108, 2216–2224, 2004.
Moore, R. H., Nenes, A., and Medina, J.: Scanning mobility CCN analysis – a method for fast measurements of size-resolved CCN distributions and activation kinetics, Aerosol Sci. Tech., 44, 861–871, 2010.
Prenni, A. J., DeMott, P. J., Kreidenweis, S. M., Sherman, D. E., Russell, L. M., and Ming, Y.:
30
The effects of low molecular weight dicarboxylic acids on cloud formation, J. Phys. Chem., 105, 11240–11248, 2001.
ACPD
12, 1493–1516, 2012Impact of aerosol composition
Q. Zhang et al.
Title Page
Abstract Introduction
Conclusions References
Tables Figures
◭ ◮
◭ ◮
Back Close
Full Screen / Esc
Printer-friendly Version Interactive Discussion
Discussion
P
a
per
|
Dis
cussion
P
a
per
|
Discussion
P
a
per
|
Discussio
n
P
a
per
|
M. O., Cantrell, W., Cass, G. R., Chung, C. E., Clarke, A. D., Coakley, J. A., Collins, W. D., Conant, W. C., Dulac, F., Heintzenberg, J., Heymsfield, A. J., Holben, B., Howell, S., Hudson, J., Jayaraman, A., Kiehl, J. T., Krishnamurti, T. N., Lubin, D., McFarquhar, G., Novakov, T., Ogren, J. A., Podgorny, I. A., Prather, K., Priestley, K., Prospero, J. M., Quinn, P. K., Rajeev, K., Rasch, P., Rupert, S., Sadourny, R., Satheesh, S. K., Shaw, G. E., Sheridan P., and
5
Valero F. P. J.: Indian Ocean Experiment: An integrated analysis of the climate forcing and effects of the great Indo-Asian haze, J. Geophys. Res., 106, 28371–28399, 2001.
Raymond, T. M. and Pandis, S. N.: Formation of cloud droplets by multicomponent organic particles, J. Geophys. Res., 108, 4469, doi:10.1029/2003JD003503, 2003.
Roberts, G. C. and Nenes, A.: A continuous-flow streamwise thermal-gradient CCN chamber
10
for atmospheric measurements, Aerosol Sci. Tech., 39, 206–221, 2005.
Rose, D., Gunthe, S. S., Mikhailov, E., Frank, G. P., Dusek, U., Andreae, M. O., and P ¨oschl, U.: Calibration and measurement uncertainties of a continuous-flow cloud condensation nuclei counter (DMT-CCNC): CCN activation of ammonium sulfate and sodium chloride aerosol particles in theory and experiment, Atmos. Chem. Phys., 8, 1153–1179,
doi:10.5194/acp-8-15
1153-2008, 2008.
Rosenfeld, D., Lohmann, U., Raga, G.B., O’Dowd, C.D., Kulmala, M., Fuzzi, S., Reissell, A., and Andreae, M. O.: Flood or Drought: How Do Aerosols Affect Precipitation?, Science, 321, 1309–1313, 2008.
Seinfeld, J. H. and Pandis, S. N.: Atmospheric chemistry and physics: From air pollution to
20
climate change, 2 edn., John Wiley & Sons, Inc., 1225 pp., 2006.
Wang, S. and Flagan, R.: Scanning electrical mobility spectrometer, J. Aerosol Sci., 20, 1485– 1488, 1989.
Young, K. C. and Warren, A. J.: A reexamination of the derivation of the equilibrium supersatu-ration curve for soluble particles, J. Atmos. Sci., 49, 1138–1143, 1992.
25
Zhang, Q., Ma, X., Tie, X., Huang, M., and Zhao, C.: Vertical Distributions of Aerosols under Different Weather Conditions: Analysis of In-situ Aircraft Measurements in Beijing, China, Atmos. Environ., 43, 5526–5535, 2009.
Zhang, Q., Quan, J., Tie, X., Huang, M., and Ma, X.: Impact Aerosol Particles on Cloud For-mation: Aircraft Measurements in Beijing, China, Atmos. Environ., 45, 665–672, 2011.
30
ACPD
12, 1493–1516, 2012Impact of aerosol composition
Q. Zhang et al.
Title Page
Abstract Introduction
Conclusions References
Tables Figures
◭ ◮
◭ ◮
Back Close
Full Screen / Esc
Printer-friendly Version Interactive Discussion
Discussion
P
a
per
|
Dis
cussion
P
a
per
|
Discussion
P
a
per
|
Discussio
n
P
a
per
|
Fig. 1. The mass concentration(A), mass fraction(B)of aerosol particles observed by AMS,
CN number concentration(C), and the CCN activation (CCN/CN) (D)of aerosols during the experiment.
ACPD
12, 1493–1516, 2012Impact of aerosol composition
Q. Zhang et al.
Title Page
Abstract Introduction
Conclusions References
Tables Figures
◭ ◮
◭ ◮
Back Close
Full Screen / Esc
Printer-friendly Version Interactive Discussion
Discussion
P
a
per
|
Dis
cussion
P
a
per
|
Discussion
P
a
per
|
Discussio
n
P
a
per
|
Fig. 2. the relation of CCN/CN with organics fraction under SS of 0.1 %, 0.2 % and 0.4 %,
respectively.
ACPD
12, 1493–1516, 2012Impact of aerosol composition
Q. Zhang et al.
Title Page
Abstract Introduction
Conclusions References
Tables Figures
◭ ◮
◭ ◮
Back Close
Full Screen / Esc
Printer-friendly Version Interactive Discussion
Discussion
P
a
per
|
Dis
cussion
P
a
per
|
Discussion
P
a
per
|
Discussio
n
P
a
per
|
Fig. 3.The relation of Dp50 with organics fraction under SS of 0.1 %, 0.2 % and 0.4 %,
respec-tively.
ACPD
12, 1493–1516, 2012Impact of aerosol composition
Q. Zhang et al.
Title Page
Abstract Introduction
Conclusions References
Tables Figures
◭ ◮
◭ ◮
Back Close
Full Screen / Esc
Printer-friendly Version Interactive Discussion
Discussion
P
a
per
|
Dis
cussion
P
a
per
|
Discussion
P
a
per
|
Discussio
n
P
a
per
|
‐
Fig. 4. The size-resolved CCN activation of aerosol particles under SS of 0.1 %, 0.2 % and
0.4 %, respectively.
ACPD
12, 1493–1516, 2012Impact of aerosol composition
Q. Zhang et al.
Title Page
Abstract Introduction
Conclusions References
Tables Figures
◭ ◮
◭ ◮
Back Close
Full Screen / Esc
Printer-friendly Version Interactive Discussion
Discussion
P
a
per
|
Dis
cussion
P
a
per
|
Discussion
P
a
per
|
Discussio
n
P
a
per
|
‐
Fig. 5. the calculated stand deviation of size-resolved CCN activation under of 0.1 %, 0.2 %
and 0.4 %, respectively.
ACPD
12, 1493–1516, 2012Impact of aerosol composition
Q. Zhang et al.
Title Page
Abstract Introduction
Conclusions References
Tables Figures
◭ ◮
◭ ◮
Back Close
Full Screen / Esc
Printer-friendly Version Interactive Discussion
Discussion
P
a
per
|
Dis
cussion
P
a
per
|
Discussion
P
a
per
|
Discussio
n
P
a
per
|
‐
Fig. 6. Closure between measured CCN number concentration and the CCN number
con-centration calculated from aerosol number size distribution and size-resolved activation for the three SS.
ACPD
12, 1493–1516, 2012Impact of aerosol composition
Q. Zhang et al.
Title Page
Abstract Introduction
Conclusions References
Tables Figures
◭ ◮
◭ ◮
Back Close
Full Screen / Esc
Printer-friendly Version Interactive Discussion
Discussion
P
a
per
|
Dis
cussion
P
a
per
|
Discussion
P
a
per
|
Discussio
n
P
a
per
|
Fig. 7. the daily averaged composition of the two days with size ranging from 50 to 200 nm on
4 and 20 September 2010.
ACPD
12, 1493–1516, 2012Impact of aerosol composition
Q. Zhang et al.
Title Page
Abstract Introduction
Conclusions References
Tables Figures
◭ ◮
◭ ◮
Back Close
Full Screen / Esc
Printer-friendly Version Interactive Discussion
Discussion
P
a
per
|
Dis
cussion
P
a
per
|
Discussion
P
a
per
|
Discussio
n
P
a
per
|
‐
Fig. 8. The size-resolved CCN activation of aerosol particles under different SS for 4 and
20 September 2010.